
 ?Mathematical formulae have been encoded as MathML and are displayed in this HTML version using MathJax in order to improve their display. Uncheck the box to turn MathJax off. This feature requires Javascript. Click on a formula to zoom.
ABSTRACT
Impacts of cattle production vary among different production systems, but data on their distribution is scarce for most world regions. In this work, we combine datasets on cattle vaccination locations and land cover in a regression framework to define and map major cattle production systems in the Argentinean Dry Chaco. We also explore how cattle occurrence relates to spatial determinants. Results indicate that the region harbors about 5.5 million heads. Cattle density was mainly described by the share of pasture (69.9%), cropland (28.1%) and aridity (23.8%). We identified 12-major cattle production systems: six cow-calf, three whole-cycle, and three fattening systems. Of these, four systems had high woodland cover (>85%). Data generated is available in a website. Understanding the distribution of cattle production systems is important to assess the environmental impacts of beef production at broad scales. Integrating vaccination data with land-cover information provides a promising avenue to identify livestock systems.
Introduction
Cattle ranching is among the most widespread land-use activities on Earth, with a global herd of about 1.47 billion (FAO Citation2019). Cattle production is an important source of protein, from beef to dairy products, sustains millions of local livelihoods (Thornton et al., Citation2002), and is an important economic activity (Gerber et al., Citation2013). At the same time, cattle production causes stark environmental impacts. For example, cattle are responsible for the majority (14%) of the global anthropogenic greenhouse gases (GHG) emissions connected to livestock production (Gerber et al., Citation2013; Tubiello et al., Citation2013). Cattle ranching has also major and often negative consequences for biodiversity and can contribute to soil degradation and compaction (Asner et al., Citation2004; Herrero et al., Citation2009). Finally, cattle ranching is one of the major proximate causes of the conversion of tropical forests, savannas, and grasslands, with cattle ranching now expanding over 22% of the global surface (Ramankutty, Evan, Monfreda, & Foley, Citation2008). Shifting to more sustainable cattle production is therefore urgently needed (Herrero et al., Citation2015) and understanding the distribution of cattle is a first and necessary step for reaching this goal.
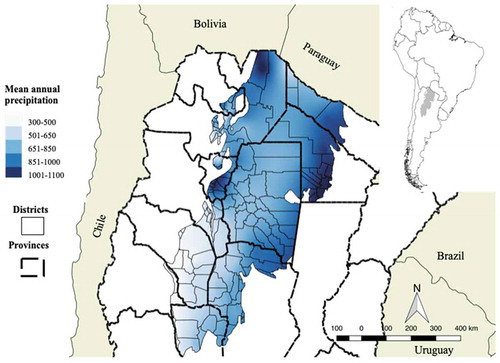
Figure 1. The Argentine Dry Chaco, including district boundaries and mean annual precipitation (Hijmans & Parra, Citation2005). The study region contains 135 administrative units (districts) in 10 provinces (dotted lines) in Argentina. We did not include Santa Fe Province due to data scarcity ().
The intensity of cattle ranching varies vastly among world regions (Herrero et al., Citation2013), and with it vary the environmental impacts of ranching. For example, while the land footprint of cattle production (e.g. low land productivity, high GHG emission intensity) has decreased in some regions, GHG emissions have increased as free-range cattle systems are converted to feed-based systems (Davis et al., Citation2015; Tubiello et al., Citation2013). At the same time, low-intensity ranching prevails in many regions, and intensification might offer opportunities for increasing production or lessening environmental pressure elsewhere (e.g. increasing soil organic carbon sequestration in improved pastures) (Gerssen Gondelach et al., Citation2017; Kreidenweis et al., Citation2018). Assessing cattle production intensity is not trivial though, as intensity should be measured in multiple dimensions (Kuemmerle et al., Citation2013), such as stocking densities, breed selection, feed mixes, manure management, or capital input to ranching. Defining and mapping major production systems is a promising approach for tackling this complexity (Nicolas et al., Citation2016; Robinson et al., Citation2014; Wint & Robinson, Citation2007).
Generally, cattle production system can be divided into milk or beef production systems, with a dairy system typically having more GHG-efficient feed-based systems with lower emission intensity (Herrero et al., Citation2013). Regarding beef production, systems can be further subdivided into (1) cow-calf systems that focus on breeding, (2) fattening systems, that buy calves to rear them for slaughtering, and (3) whole-cycle systems that combine reproduction and fattening. Cow-calf systems are often based on extensive grazing and can lead to grasslands or forest degradation, especially because they are particularly widespread in harsh environments (e.g. semi-arid areas) (Grau, Gasparri, & Aide, Citation2008; Mazzini, Relva, & Malizia, Citation2018). At the same time, fattening systems are common in good environmental condition and are heavily based on feed supplements (Gerber, Mottet, Opio, Falcucci, & Teillard, Citation2015). While these systems are less land-intensive, they can exert substantial environmental pressure via dung and manure concentration, GHG emissions, freshwater contamination, and environmental impacts related to feed production (Naylor et al., Citation2006). Mapping livestock production systems are thus important to understand which environmental impacts are related to cattle production, as well as where these impacts occur.
Unfortunately though, data on livestock systems remain scarce (Kuemmerle et al., Citation2013). A few global livestock maps exist (Nicolas et al., Citation2016; Robinson et al., Citation2014; Wint & Robinson, Citation2007), but all of them are based on downscaled, very coarse livestock statistics, with downscaling models typically not adjusted to regional contexts. These distributional maps were also the basis for limited efforts to evaluate cattle production intensity (Bouwman, Van der Hoek, Eickhout, & Soenario, Citation2005; Fetzel, Havlik, Herrero, & Erb, Citation2017; Krausmann, Erb, Gingrich, Lauk, & Haberl, Citation2008), but lack of data on non-marketable feedstuff, grazed areas, or cattle types and numbers make such assessments highly uncertain (Irisarri, Aguiar, Oesterheld, Derner, & Golluscio, Citation2017). Finally, production systems have been indirectly classified via agro-climatic conditions and satellite-based vegetation indices (Kruska, Reid, Thornton, & Henninger, Citation2003; Robinson et al., Citation2014) or rural population density (Nicolas et al., Citation2016), but none of these efforts used actual data on cattle numbers and distribution.
Vaccination data could be a promising avenue to alleviate some of these data gaps. Vaccination is important and economically beneficial for cattle producers to ensure a healthy stock (Homewood, Trench, Randall, Lynen, & Bishop, Citation2006). In addition, where sanitary standard exists (e.g. regions held free of foot and mouth disease to enable exports of livestock products) virtually all cattle are vaccinated. In addition, geo-located vaccination information often exists, along with specifics on the cattle herd in the location where a vaccination event took place. This presents a clear opportunity to map livestock systems and to better understand what determines their spatial patterns. Yet, to our knowledge just one paper has made use of vaccination information, though for a different purpose, to explore drivers of illegal deforestation in Matto Grosso (Klingler, Klingler, Richards, & Ossner, Citation2017). No study has used vaccination information to map livestock production systems.
South America is a key cattle production region, containing 23% of the global cattle stock, especially in Brazil and Argentina (FAO Citation2019). Cattle production plays a key role in the economies of these countries and cattle sectors have increased by 69% since 1961 (FAO Citation2019). As a consequence, ranching expansion has been a major proximate cause of deforestation in Amazonia (Nepstad et al., Citation2009), the Cerrado (Brannstrom et al., Citation2008), the Chiquitanía (Muller, Muller, Schierhorn, Gerold, & Pacheco, Citation2012) and the Gran Chaco (Baumann et al., Citation2017; Gasparri, Grau, & Gutierrez Angonese, Citation2013). Yet, cattle production systems are diverse, with systems characterized by relatively low stocking rates and forage from natural vegetation prevailing in many regions (Grau & Aide, Citation2008; Grau et al., Citation2014; Mazzini et al., Citation2018). Understanding the distribution of cattle production systems at regional scales would help to explore ways to lessen the impact of ranching in deforestation frontiers.
The Dry Chaco is one of the most active tropical deforestation frontiers of the world, with cattle ranching as the main proximate cause of deforestation (Aide, Clark, Grau, & Lopez-carr, Citation2013; Baumann et al., Citation2017; Gasparri & Grau, Citation2009). In Argentina, concern about deforestation has resulted in the implementation of land-use zoning for the remaining woodlands in 2007 (National Congress, Citation2007). This zoning prohibits conversion to cropland in some areas, while some forms of ranching continue to be allowed across wide areas in the Chaco. Furthermore, ongoing transformation of pastures to cropland in the Pampas region (Piquer-Rodríguez et al., Citation2018; Viglizzo et al., Citation2011) might displace cattle production to the Chaco. Climate, particularly rainfall, can restrict cattle ranching (Oesterheld, Loreti, Semmartin, & Paruelo, Citation1999), but does not appear to be limiting in the Dry Chaco (Houspanossian et al., Citation2016). As a result, further cattle ranching expansion in the Chaco is likely.
Our overarching goal was to understand the distribution of cattle production system in the Argentinean Dry Chaco. We used a unique, spatially-explicit database of cattle vaccination records in combination with high-resolution land-cover maps to define and map major cattle production system. We also use a regression framework to quantify the importance of a suite of environmental and economic variables in determining cattle distributions. Specifically, we addressed two overarching research questions:
What is the spatial pattern of cattle in the Argentinean Dry Chaco and which factors determine it?
What are major cattle production systems in the Argentinean Dry Chaco and where do they occur?
Methods
Study area
The Dry Chaco (787.000 km2) is the largest continuous patch of Neotropical dry forest. Extending into Bolivia, Paraguay and Brazil, the largest part of the Dry Chaco is located in Argentina (62%). Mean annual temperatures range is 19–24°C and annual rainfall is 300–1000 mm, with rainfall almost exclusively during summers and the driest areas located in the center of the Dry Chaco () (Hijmans & Parra, Citation2005). Vegetation is dominated by woodlands composed of broadleaved, deciduous or semi-deciduous trees and shrubs. In addition to woodlands, the landscape includes natural grasslands and wetlands.
The Dry Chaco is one of the largest remaining reserves of uncultivated fertile land globally and has undergone rapid agricultural expansion recently (Grau, Gasparri, & Aide, Citation2005; Lambin et al., Citation2013). The most important agricultural commodities are soybean, maize and cotton, as well as beef. Cattle production is a key agricultural activity with a long history and has been the most widespread land use in the Chaco since the mid-20th century (Morello & Saravia Toledo, Citation1959). Yet, the Chaco is also characterized by a broad diversity of cattle production actors, operating under a range of management regimes, different forms of land tenure, different management intensities and with diverse environmental impacts. At one end of the intensity spectrum, extensive pastoral systems dominated by smallholder and semi-subsistence production exist. These so-called puestos, are traditional, labor-intensive systems, mostly using woodland as forage and with low stocking rates [0.01–0.03 animal unit equivalent (AU.ha−1.year−1)]). On the other end of the intensity-spectrum, industrialized production systems prevail. These producers use large areas for often huge cattle herds, and the main feed for cattle comes from implanted pastures with exotic grasses (e.g. Megathyrsus gatton panic and Pennisetum ciliare) and feed crops (e.g. soybean, cotton seed, corn; dry or as silage). Stocking rates range from 0.2 to 1 AU.ha−1.year−1 in cow-calf and whole cycle systems, and 2–5 AU.ha−1.year−1 in fattening systems. Dairy cattle exist in some areas of the Chaco, but remain a negligible system in the Argentinian Chaco (Supplementary Material, Table S1).
Input datasets
We used the georeferenced Registro Nacional de Sanidad de Productores Pecuarios (RENSPA) database, generated through the foot and mouth disease vaccination program of the Servicio Nacional de Sanidad y Calidad Agroalimentaria (SENASA). This database contains information on all vaccinated cattle, differentiated by category (e.g. bulls, cows, calf) for the year 2016. Argentina is considered free of foot and mouth disease, and all cattle in zones where this disease could break-out (including the Chaco) are mandatory to be vaccinated at least once time by year. RENSPA registration is furthermore obligatory for all livestock producers in Argentina and is the reference database for traceability of cattle for the national government (Ministerio de Agricultura, Citation2015). Data are not accessible in a website, considering that vaccination represents information of rancher’s capital. However, the aggregation of the vaccination data into a gridcell avoids any problems in terms of identifying particular properties. As a result, the RENSPA is the most comprehensive spatially explicit database of cattle for the Chaco. Geolocations in the RENSPA database marks the house or ranch of the person (a rancher or a company) responsible for the vaccination of the associated cattle.
Information on land cover in our study region came from our own previous work (Baumann et al., Citation2016). This map was based on Landsat composite metrics and a random forest classification, and depicts the main land-cover categories in the Chaco, as well as conversions among them, for the period 1985–2013. The map has an overall accuracy of about 90%, and has very high users’ and producers’ accuracies for the most relevant classes in our analysis (e.g. woodlands, croplands, pastures, grasslands). We used the 2013 map for our study.
To assess the spatial determinants of cattle density, expressed in cattle heads, we used four types of variables: (1) climate, (2) land cover, (3) soil and (4) economic variables (). We aggregated all the variables in 20 × 20 km gridcells, the size in which we grouped cattle occurrence data. In terms of climate variables, we assessed six variables known to impact forage productivity, specifically precipitation (i.e. mean annual precipitation, mean precipitation of growing season, mean precipitation of driest quarter, interannual variation of precipitation) and aridity constraints (i.e. mean annual temperature and aridity index). Aridity constrains forage productivity and consequently cattle production, particularly in grazing systems. Our aridity index was calculated with the De Martonne equation (De Martonne, Citation1926) which contemplate temperature, where higher values indicate more wet conditions (Supplementary Material, equation S2). In consequence, we hypothesized a positive relation between the De Martonne Aridity index and cattle density. The growing season was defined as the 6 months in which megathermic pastures growth (From October to March). Except inter-annual variation of precipitation, we assumed a positive relation with all climate variables related to forage productivity (e.g. the higher annual precipitation, the higher cattle density should be). In addition, we used the agroclimatic variable potential soybean yield as a proxy of land competition between cattle ranching and other high-profitability forms of agriculture in the region, assuming a negative relation between soybean yield and cattle density.
Table 1. Variables used for analyzing spatial patterns of cattle density (# of cattle heads) in the Chaco, including their hypothesized influence.
In terms of land cover, we assessed three variables (cropland share, grassland share, woodland share) based on our land-cover map. Grasslands here included both native grasslands and implanted pastures. We assumed a positive relationship between cattle density and Grassland/Cropland share, and a negative relationship with woodland share. Regarding soil variables, we included a soil quality index developed by the Instituto Nacional de Tecnología Agropecuaria (INTA) as it integrates texture and organic carbon. Higher values here indicate better soil quality. In terms of economic variables, we considered the distance to slaughterhouse and a productive orientation index (see below and ). We assumed a negative relationship of cattle density with distance to slaughterhouse and a positive relationship with our productive orientation index. We did not consider human population density because a reliable map of rural population does not exist for the Chaco. To address collinearity between our variables, we calculated Pearson’s correlation coefficient (r) for each variable pair. If |r| exceeded 0.7, we only kept the variable that was correlated higher with cattle density (Supplementary Material, Figure S3). This resulted in a set of 13 variables, which we used in subsequent analysis.
Understanding the spatial determinants of cattle density
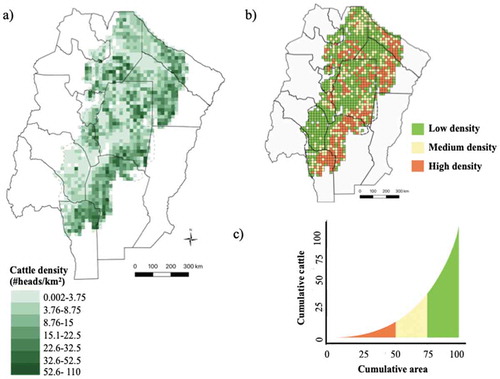
As the basic unit for our analyses regarding cattle distribution and production systems, we used gridcells of 20 × 20 km2 (40,000 ha). We adopt this relatively large cellsize to account for the many large cattle ranches in the Chaco (typically >10.000 ha), the even larger blocks of remaining woodland that are used by semi-subsistence smallholders for woodland grazing (with typical distances between farms of 5 to 10 km) (Morello & Saravia Toledo, Citation1959), and remaining geopositional uncertainty in the vaccination database (that typically provides the location of the main farm). We rasterized the vaccination point data to the 20 × 20 km2 grid and assigned the sum of cattle at vaccination points within that gridcell (hereafter: cattle density). To refer to the total stock of cattle in the region, we use the term cattle stock. Gridcells without vaccination data were considered to have a cattle density of zero. To better understand cattle density in our study region, we prepared a Lorenz curve. To do so, we rank for each gridcell cattle density and order them by rank in a table. Then, we converted each value in a % of the total stock, doing the same with the area of each gridcell. Later, we calculate the running totals, i.e. cumulative %, by adding the % of one gridcell to the ones before. Finally, we graph accumulated area vs accumulated density and segmented the resulting graph into three categories according to the distribution of density ()). We labeled low-density category as the areas which represents the 50% of the region with the lowest cattle densities, the medium-density category represents those areas with cattle densities between the 50th and 75th percentile of the density distribution, and the high-density category represents the areas with the 25% highest cattle densities.
Figure 2. Cattle density in the Argentinean Dry Chaco for the year 2016. (a) Cattle density (#heads) per km2; (b) Gridcells with low (14% of total heads of the regions in a 50% of area), medium (36% of total heads of the region in a 25% of area) and high cattle density (60% of total heads of the region in a 25% of area) based on a classification of the Lorenz curve; (c). Lorenz curve of cattle density in study region (i.e. cumulative cattle density ranked vs and area curve).
To understand the relative importance of spatial determinants of cattle density in the Argentine Dry Chaco, we fitted regression models. Our response variable (i.e. cattle density) was discrete, and constituted the number of cattle heads per gridcell. Specifically, we used best subsets regression (Miller, Citation1984) to fit all possible models. We performed an exhaustive search, ranking all possible models with 3, 4 and 5 variables based on the adjusted R2, and selected the 25 best models. These top-25 models we then analyzed in two ways. First, we counted the number of times each spatial determinant was included in them as our first measure of variable importance (Baumann et al., Citation2011). Second, we applied hierarchical partitioning (Mac Nally, Citation2002) to each of these 25 models. Hierarchical partitioning quantifies the contribution of a variable to the fit of a multiple linear regression model by comparing the model including this variable to a model without it (MacNally, Citation2002). This was done individually, at each hierarchical level (e.g. for all possible combinations of 2-, 3-, or 4-dimensional models), and we averaged the results for each hierarchical level to derive a measure of variable contribution (i.e. a second measure of variable importance).
Identifying and mapping cattle production systems
To identify the main cattle production systems, we first calculated a Productive Orientation (PO) index. Our PO index was calculated by dividing the number of cattle in fattening systems (steers and young bulls) by the total numbers of cows per gridcell (Equation 1).
We then defined four categories representing different types of cattle productive orientation (). Our PO index does not identify dairy cattle, because herd composition is similar with cow-calf systems. To remedy this, we obtained complementary information on where dairy farms found in our study region from SENASA and aggregated these date to the finest administrative unit of our analyses (i.e. districts; Supplementary Material, Table S1).
Table 2. Major cattle production systems in the Chaco, defined by distinct classes of productive orientation (proportion of steers and young bulls related to the number of cows) and landscape composition (woodland share).
While our PO index provides information on herd composition in a gridcell, it does not contain forage information. In other words, similar PO values can be found in a broad range of landscapes, including landscapes dominated by woodlands, grasslands, or croplands (Supplementary Material, Figure S4), which in reality present different production systems. As a second dimension in our production system typology, we therefore used the percentage woodland share. This allowed discriminating systems based on woodland grazing from those that are based on implanted pastures or predominantly use feed from cropland (). We defined three-landscape composition types: (1) woodland (woodland share >85%), mixed (>15% to <85%) and agricultural (<15%). We carried out an extensive sensitivity analysis to assess the impact of these thresholds on our results (Supplementary Material, Figure S5). Overlaying the PO categories and the woodland share categories resulted in 12 distinct cattle production systems (). We described these qualitatively, based on our field experience, knowledge of the study region, and the literature (). Finally, we used descriptive statistic to compare the cattle production systems in relation with the environmental factors selected for regression analyses.
Table 3. Description of the cattle production systems identified for the Argentine Dry Chaco.
Results
The maps presented in results are available for researchers in this URL: https://inta.gob.ar/documentos/geografia-de-la-ganaderia-bovina-en-el-chaco-seco-argentino. Our vaccination database included a total of 5.494.937 cattle heads for the Argentinean Dry Chaco, revealing marked patterns of cattle density across the region ()). Of the total herd, only 14% (about 770.000 heads) were spread over the 50% of the region with lowest cattle densities. The medium density category (50-75% of the cumulative area distribution; )) contained 36% of the entire cattle herd (equaling about 1.980.000 heads), and the upper 25% of the cumulative area distribution (high-density category) included half of the cattle herd (equaling about 2.747.000 heads; )). The three districts containing most cattle were Anta (Salta province, 375.287 heads), Patiño (Formosa, 272.278 heads), and Moreno (Santiago del Estero, 272.197 heads; Supplementary Material, Table S6).
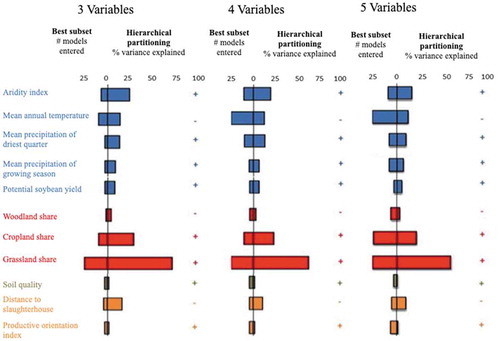
Analyzing the spatial determinants of cattle density using our regression analysis revealed that land cover (particularly grassland and cropland share with a positive relation) and climate variables (particularly aridity with a positive relation, indicating major density in wettest areas) were the most influence variables driving cattle density patterns. The relation of determinant variables with cattle occurrence remains as we hypothesized. Five-dimensional models (i.e. containing five-predictor variables) had higher goodness-of-fit (median adjusted R2 = 0.25), than four- and three-dimensional models (median adjusted R2 of 0.23 and 0.20, respectively). Our overall best model included the five variables grassland share, cropland share, woodland share, mean annual temperature and aridity index. The variable grassland share variable was included in all 25 best models of the three-, four- and five-dimensional models. The second most frequently included variable was mean annual temperature (10/25, 24/25, 25/25); followed by cropland share (10/25, 10/25, 24/25) and aridity index (7/25, 10/25 and 9/25). Land cover proportions and climate variables also had the highest independent contributions in the hierarchical partitioning analysis, especially grassland share (69,9%, 62,6%, 55% for five-, four- and three-dimensional models, respectively), cropland share (28,1%, 23,1%, 20%), aridity index (23,8% 19,6% 15,2%) and mean annual temperature (13,6% 12,3%, 11,5%) ().
Figure 3. Importance of spatial determinants (rows) in explaining cattle density patterns in our study region for five-dimensional models (i.e. five variables, right column), four-dimensional models (middle) and three-dimensional models (left). For each column and row, the left bar indicates how often a variable entered in the 25 best subset regression models. The right bar indicates the independent contribution of this variable in this model, as identified by Hierarchical Partitioning. Climate variables are in blue, land cover variables in red, soil variable in brown, and economic variables are in orange.
We identified and mapped 12 distinct cattle production systems (). Assessing only the four-PO classes ()) showed that the pure and predominantly cow-calf systems were most widespread (44% and 30% of the study area, respectively) especially in the southwest and center of the region. Landscapes dominated by these systems contained 3,844,200 heads of cattle (or 69% of the total herd; ). Whole-cycle systems dominated in 17% of the study region (representing 948,400 heads, 18% of the total herd), especially in the east of Salta and the west of Chaco provinces. Finally, fattening systems extended across 9% of the study area, containing 721,900 heads (14% of the total herd).
Table 4. Cattle production systems in terms of total area, share of study area, heads (thousands), and share of total herd in Dry Chaco.
Figure 4. Cattle production system in the Argentine Dry Chaco. a) Production orientation types according to the relation of steers/cows by gridcell. b) Cattle production systems by a combination of the previous production orientation categories (color) and the dominant landscape class (dark to light). White gridcells represent no data.
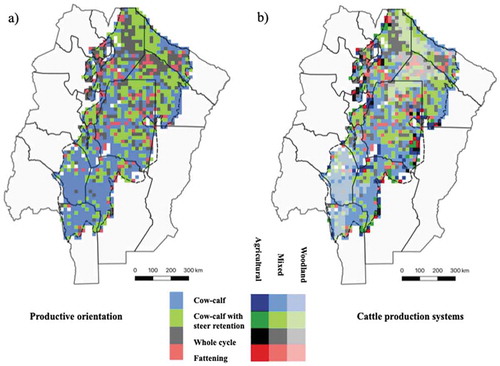
Combining the PO index categories with major categories in terms of landscape composition revealed that cattle production systems in mixed systems (i.e. landscapes with more than 15% and less than 85% of the woodland share) were most dominant (). Particularly cow-calf was found in mixed landscapes, extending across 47% of the area and containing 2,874,000 heads (52% of the total herd). Furthermore, we found close to 23% of the study area and 14% of the entire cattle stock to occur in woodland systems, which in turn represented approximately more than 50% of all woodland with cattle grazing in the region. Finally, agricultural systems were concentrated in 12% of the study area, containing only 9% of the cattle heads.
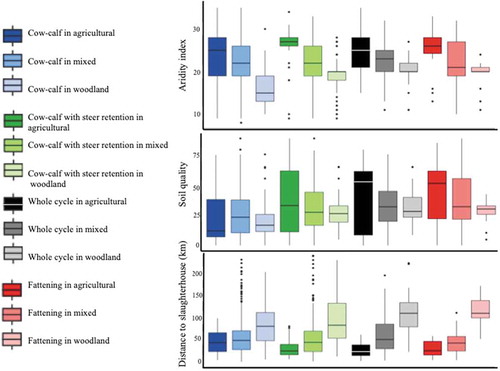
Comparing the resulting cattle production systems to environmental factors (not used for defining them) revealed interested differences (). For example, woodland-dominated systems were consistently located in the driest zones, on soils with lower quality, and farthest away from slaughterhouse (). In contrast, cattle production systems in agricultural landscapes were typically located on more wet areas with better soils and closer to slaughterhouses. Yet, soil quality varied also the most for cattle production systems in areas dominated by agriculture. Finally, cattle production systems in mixed landscapes showed a tendency towards higher shares of grassland (see Supplementary Material S7 and S8 for a full comparison of cattle production systems and spatial determinants).
Figure 5. Cattle production systems and their characteristics in terms of selected spatial determinates (aridity index, soil quality, and distance to slaughterhouses).
Discussion
Beef and dairy production have major impacts on the environment, but these impacts vary depending on the cattle production systems. Data on these systems are notoriously scarce, which is a real obstacle for context-specific impact assessments and spatial planning. Here, we developed a novel approach that combines vaccination data, which contains detailed information on the location and composition of cattle herds, with fine-scale land-cover information to map cattle production systems. We demonstrate this approach for the entire Argentinean Dry Chaco, a global deforestation hotspot. Our analyses reveal four major insights. First, cattle were distributed across almost the entire Argentinean Dry Chaco, with about 13% of the entire Argentinean stock in our study region, underpinning the relevance of cattle ranching as a land use in that area, as well as the global importance of the Chaco as cattle production region. Second, cattle density was most strongly correlated with land cover, particularly grassland share, as well as by climate variables. This underpins the role of ranching as a deforestation driver, changing woodlands by pastures, but also suggests this proximate driver might at least in the long term be curbed by the increasingly dry conditions of remaining woodlands. Third, we identified 12 distinct cattle production systems, but cow-calf systems were by far the most important systems. This suggests the Dry Chaco is still in an early stage of intensification, providing opportunities to increase production via intensification rather than further expansion. Finally, woodland-dominated systems extended over nearly a quarter of our study area, highlighting the continuing importance of subsistence grazing and smallholder ranching in the Argentinean Chaco. Mapping cattle production system in the Chaco, and elsewhere, is necessary to assess its environmental impacts and its role as a deforestation driver, as well as to identify strategies towards more sustainable cattle production. We here show how combining vaccination and land-cover data provides a viable avenue to do so in data-scarce regions.
We found more than 5.5 million heads of cattle, nearly 13% of the total Argentinean national stock, to be located in the Chaco – especially in the more wet parts and coinciding with active deforestation frontiers (Gasparri & Grau, Citation2009; Grau et al., Citation2005; Viglizzo et al., Citation2011). This point up the Dry Chaco as global important region in terms of cattle productions and conflicts with deforestation advances, particularly when considering that almost all agricultural land in the Paraguayan Chaco is used for ranching as well (Baumann et al., Citation2017). Compared with other deforestation frontiers of South America, cattle stocks and cattle density are still lower in the Chaco then elsewhere. For example, the cattle stock in our study region represents only 26% of the cattle stock of the Brazilian state of Pará, or the 18% of stock of the state of Matto Grosso (but note that these regions are 2.5 and 2 times larger than Argentinean Chaco, respectively). Cattle density in Pará is 16 heads/km2 and in Matto Grosso 32 heads/km2 (IBGE, Citation2018), while we find a cattle density of only 11 heads/km2 in the Argentine Chaco. Cattle stock and density in the Chaco will likely increase in the future, especially if the ongoing agricultural intensification process in the Pampas continues to displace cattle from there to the Chaco (Rearte, Citation2010; Viglizzo et al., Citation2011).
With a positive relation, grassland share was the most important variable among the spatial determinants of cattle density we explored, a finding in line with Rueda, Aldi, Verón, and Jobbágy (Citation2013) who explained patterns of Human Appropriation of Net Primary Productivity in relation to cattle production in our study region. Cow-calf systems are the most widespread in our region and rely heavily on implanted or native pastures. Reason for why grassland share constitute the preponderant variable for extensive cattle ranching, underpinning the importance of this particular system as deforestation driver. Cropland share was also important, possibly highlighting the increasing spatial integration of cropping and cattle production, as suggested by Gasparri and Le Polain de Waroux (Citation2014) for the Herrero et al. (Citation2015) globally. We caution though that this integration is complex, including various flows of inputs, capital and information (Gasparri & Le Polain de Waroux, Citation2014; Martin, Moraine, Ryschawy, & Magne, Citation2016). Aridity was also an important variable for determining cattle density, with cattle concentrating in more wet areas (). While prior suggestions that the expansion of pastures will likely not be restricted by aridity (Houspanossian et al., Citation2016). The relationship with aridity we find is likely explained by the strong impact of water scarcity on grassland productivity, and thus stocking rates for grazing systems (Oesterheld et al., Citation1999). In addition, under some threshold of aridity, the possibility to cultivate crops in semiarid regions is constrained, what is crucial for implement more intensified cattle production systems, as whole-cycle systems. However, our empirical results and field experience suggest that management can adapt to strong seasonality, importing external fodder to the farm for example (Fetzel et al., Citation2017). In addition, more efficient water harvesting and management could lead to a stronger decoupling of cattle production and aridity constraints in the future (Magliano et al., Citation2015). Widespread implementation of new technologies could increase cattle productivity as well as lead to the expansion of cattle ranching into areas currently considered too dry ().
We identified and mapped 12 cattle production systems, with the pure cow-calf system in mixed landscapes being most widespread (), ). The dominance of cow-calf systems suggests that the region is still in early stage of cattle production intensification ( and ). Grazing land is become scarce, for instance, due to aridity constraints (see above), more stringent regulations, or diminishing areas that are allowed to be converted, and as prices for beef are still increasing. This suggests the conversion of cow-calf systems, based on mixed feed and a high reliance on pastures, to more intensified systems with a higher share of crop feed is likely, as elsewhere (Davis et al., Citation2015). This is further amplified by the recent increase in beef exports from Argentina (Williams, Citation2018), which suggests a rising demand for heavier animals and fattening system (i.e. feedlots). Our study highlights much potential for intensification in the Chaco itself (e.g. the low stocking rates mentioned above). For example, the weaning rate (ratio between calf and cow) in the most widespread system is on average 60% in the Chaco (INTA, IER, SENASA, Citation2016) and thus well below values that can be achieved with better technology (>80%) (Nasca et al., Citation2015). Our assessment and maps could help to identify areas that are likely to experience the environmental impacts of such an intensification (i.e. dung concentration or freshwater contamination) and thus to prevent some of these outcomes via pro-active planning (e.g. waste management).
We found almost a quarter of the study region to be dominated by woodland grazing systems, typically in lower quality soils and with larger distances to slaughterhouses. This highlights the continued importance of smallholder ranching, subsistence-oriented systems, broadly corresponding to the traditional ‘puestos’ systems (e.g. Grau et al., Citation2008). Overall, these systems contained a minor share of the total cattle stock, but exert environmental pressure over a very large area (). At the same time, these systems are locally less detrimental for bird biodiversity than most other form of cattle production (Macchi et al., Citation2019; Mastrangelo & Gavin, Citation2012). Furthermore, cattle grazing has consequence in structure and functionality of vegetation (Herrero-Jáuregui & Oesterheld, Citation2018), however the impact of cattle grazing in woodland biomass, remain undetectable by remote sensing and in consequence at regional scales (Erb et al., Citation2017). This highlights the need to assess how trade-offs between cattle production and the environment, for instance, biodiversity, scale-up. Mapping cattle production systems provide an avenue and spatial template to do so. Puesto systems also strongly depend on cattle production and are typically characterized by low income and high social vulnerability. This is also reflected in the cattle composition of these systems we found, consisting mainly of old animals, which in turn to act as an economic insurance (Ng’ang’a et al., Citation2016; Seghezzo, Venencia, & Buliubasich, Citation2016). There are clear and substantial cultural values associated with puestos systems (Adamoli, Sennhauser, Acero, & Rescia, Citation1990). The widespread nature of these systems emphasizes the need to put more attention in them in terms of policies, regarding development, conservation and restoration.
We here, for the first time, combine fine-scale vaccination data and land-cover information to provide the first classification of cattle production systems for the Chaco, a global deforestation hotspot. A number of sources of uncertainty need mentioning. First, the snapshot nature of our maps (2016) constitutes a barrier to understand long-term changes in cattle production systems, but our map can be updated as new vaccination and land-cover data becomes available. Second, we considered grasslands, but we cannot determine the actual area grazed, which would be beneficial to calculate stocking densities more precisely. We do not use current population data because do not capture the information of rural population, is just aggregated in cities. Maps of underground water, what can constraints the development of cattle ranching also could be useful to test the determinants of current or future distribution. Paddock sizes in ranches (e.g. Graesser, Ramankutty, & Coomes, Citation2018), piospheres around puestos (e.g. Grau et al., Citation2008) or rural population maps (not rural cities as the data available now), could help to further refine our maps in this regard.
Third, other intensity metrics would be beneficial to include in our classification of cattle systems (e.g. the type of cropland, forage storage). Finally, more detailed vegetation structure indicators, such as woodland biomass (Gasparri & Baldi, Citation2013), tree or shrub cover (Baumann et al., Citation2018), or woodland functionality (Powell et al., Citation2018) could also further improve our maps.
Cattle ranching is a globally important economic driver, but also contributes to many sustainability problems we face in the twenty-first century. Production systems, however, differ vastly, regarding herd management, infrastructure, productive orientation and environmental trade-offs, and accounting for this variability, against regional social-ecological contexts, is important. Data scarcity has prevented such a more nuanced assessment of the distribution and impacts of such systems, especially in those regions where impacts are likely most severe such as tropical deforestation frontiers. Our study highlights how vaccination registers, which exists in all major cattle producing regions, combined with high-resolution land-cover maps, which also are increasingly available globally (Avitabile et al., Citation2016; Song et al., Citation2018), can constitute a viable low-cost avenue towards identifying and mapping cattle production systems. Our work for the Dry Chaco that could thus be repeated, both in time and in other regions. For example, in South America, large areas in Argentina, Brazil, Ecuador, Bolivia and Colombia are officially maintained as free of foot and mouth disease, requiring vaccination (OIE, Citation2019). These areas overlap with valuables tropical forest and savanna ecosystems, such as the Amazon, Chaco, Chiquitania and Cerrado – for all of which more detailed cattle production system maps would be a major step forward in understanding the impact of ranching on these systems. Likewise, applying our approach to these areas could be critical for understanding cattle intensification pathways and their relation to deforestation and ranching expansion. Standardizing and reinforcing international protocols and to gather and provide access to vaccination data should therefore be a priority not only for the production and animal sanitary sector, but also for a wider community interested in land system sustainability.
Correction Statement
This article has been republished with minor changes. These changes do not impact the academic content of the article.
Supplemental Material
Download MS Word (978.8 KB)Disclosure statement
No potential conflict of interest was reported by the authors.
Supplementary material
Supplemental data for this article can be accessed here.
Additional information
Funding
References
- Adamoli, J., Sennhauser, E., Acero, J.M., & Rescia, A. (1990). Stress and disturbance: Vegetation dynamics in the dry Chaco region of Argentina. Journal of Biogeography, 17, 147–156.
- Aide, T.M., Clark, M., Grau, R., & Lopez-carr, D.L. (2013). Deforestation and Reforestation of Latin America and the Caribbean (2001 – 2010). Biotropica, 45, 262–271.
- Asner, G.P., Elmore, A.J., Olander, L.P., Asner, G.P., Elmore, A.J., Olander, L.P., … Harris, A.T. (2004). Grazing systems, ecosystem responses, and global change. Annu. Rev. Environ. Resour., 29, 261–299.
- Avitabile, V., Herold, M., Huvelink, G.B.M., Lewis, S.L., Phillips, L., Asner, O., … WIillcock, S. (2016). An integrated pan-tropical biomass map using multiple reference datasets An integrated pan-tropical biomass map using multiple reference datasets. Global Change Biology, 22, 1406–1420.
- Baumann, M., Gasparri, I., Piquer-Rodriguez, M., Gavier-Pizarro, G., Griffith, P., Hostert, P., & Kuemmerle, T. (2016). Carbon emissions from agricultural expansion and intensification in the Chaco Carbon emissions from agricultural expansion and. Global Change Biology. doi:10.1111/gcb.13521
- Baumann, M., Israel, C., Piquer-Rodriguez, M., Gavier-Pizarro, G., Volante, J.N., & Kuemmerle, T. (2017). Deforestation and cattle expansion in the Paraguayan Chaco. Regional Environmental Change, 17, 1179–1191.
- Baumann, M., Kuemmerle, T., Elbakidze, M., Ozdogan, M., Radeloff, V.C., Keuler, N.S., … Hostert, P. (2011). Land Use Policy Patterns and drivers of post-socialist farmland abandonment in Western Ukraine. Land use policy, 28, 552–562.
- Baumann, M., Levers, C., Macchi, L., Bluhm, H., Waske, B., Ignacio, N., & Kuemmerle, T. (2018). Mapping continuous fi elds of tree and shrub cover across the Gran Chaco using Landsat 8 and Sentinel-1 data. Remote Sensing of Environment, 216, 201–211.
- Bouwman, A.F., Van der Hoek, K.W., Eickhout, B., & Soenario, I. (2005). Exploring changes in world ruminant production systems. Agricultural Systems, 84(2), 121–153.
- Brannstrom, C., Jepson, W., Filippi, A.M., Redo, D., Xu, Z., & Ganesh, S. (2008). Land change in the Brazilian Savanna (Cerrado), 1986 – 2002 : Comparative analysis and implications for land-use policy. Land use policy, 25, 1986–2002.
- Davis, K.F., Yu, K., Herrero, M., Havlik, P., Carr, J.A., & Odorico, P.D. (2015). Historical trade-offs of livestock ’ s environmental impacts. Environmental Research Letters, 10, 125013.
- De Martonne, E. (1926). L ’ indice d ’ aridité. Bulletin de l’Association de géographes français, 3(9), 3–5.
- Erb, K.H., Kastner, T., Plutzar, C., Bais, A.L.S., Carvalhais, N., Fetzel, T., … Luyssaert, S. (2017). Unexpectedly large impact of forest management and grazing on global vegetation biomass. Nature, 553(7686), 73–76.
- FAO 2019. Food and Agriculture Organization of the United Nations. Rome: FAOSTAT statistics database. Retrieved from http://www.fao.org/faostat/en/.
- Fetzel, T., Havlik, P., Herrero, M., & Erb, K.H. (2017). Seasonality constraints to livestock grazing intensity. Global Change Biology, 23, 1636–1647.
- Gasparri, N.I., & Baldi, G. (2013). Regional patterns and controls of biomass in semiarid woodlands: Lessons from the Northern Argentina Dry Chaco. Regional Environmental Change, 13, 1131–1144.
- Gasparri, N.I., & Grau, H.R. (2009). Deforestation and Fragmentation of Chaco Dry Forest in NW Argentina (1972 – 2007). Forest Ecology and Management, 258, 913–921.
- Gasparri, N.I., Grau, H.R., & Gutierrez Angonese, J. (2013). Linkages between soybean and neotropical deforestation: Coupling and transient decoupling dynamics in a multi-decadal analysis. Global Environmental Change, 23, 1605–1614.
- Gasparri, N.I., & Le Polain de Waroux, Y. (2014). The Coupling of South American Soybean and Cattle Production Frontiers: New Challenges for Conservation Policy and Land Change Science. Conservation Letters, 8, 290–298.
- Gerber, P.J., Mottet, A., Opio, C.I., Falcucci, A., & Teillard, F. (2015). Environmental impacts of beef production : Review of challenges and perspectives for durability. MESC, 109, 2–12.
- Gerber, P.J., Steinfeld, H., Henderson, B., Mottet, A., Opio, C., Dijkman, J., … Tempio, G. (2013). Tackling climate change through livestock – A global assessment of emissions and mitigation opportunities. Food and Agriculture Organization of the United Nations (FAO).
- Gerssen Gondelach, S.J., Lauwerijssen, R.B.G., Havlik, P., Herrero, M., Valin, H., Faaij, A.P., & Wicke, B. (2017). Intensification pathways for beef and dairy cattle production systems : Impacts on GHG emissions, land occupation and land use change. Agriculture, Ecosystems & Environment, 240, 135–147.
- Graesser, J., Ramankutty, N., & Coomes, O.T. (2018). Increasing expansion of large-scale crop production onto deforested land in sub-Andean South America Increasing expansion of large-scale crop production onto deforested land in sub-Andean South America. Environmental Research Letters, 13(8), 084021.
- Grau, H.R., Gasparri, N.I., & Aide, T.M. (2005). Agriculture expansion and deforestation in seasonally dry forests of north-west Argentina. Environmental Conservation, 32, 140.
- Grau, H.R., Gasparri, N.I., & Aide, T.M. (2008). Balancing food production and nature conservation in the Neotropical dry forests of northern Argentina. Global Change Biology, 14, 985–997.
- Grau, H.R., Torres, R., Gasparri, N.I., Blendinger, P.G., Marinaro, S., & Macchi, L. (2014). Natural grasslands in the Chaco. A neglected ecosystem under threat by agriculture expansion and forest-oriented conservation policies.
- Grau, R., & Aide, T.M. (2008). Globalization and Land-Use Transitions in Latin America. Ecology and Society, 13(2).
- Herrero, M., Havlík, P., Valin, H., Notenbaert, A., Ru, M.C., & Thornton, P.K. (2013). Biomass use, production, feed efficiencies, and greenhouse gas emissions from global livestock systems. Proceedings of the National Academy of Sciences, 110, 20888–20893.
- Herrero, M., Reid, R.S., Gerber, P., Thornton, P.K., Thornton, P.K., Bank, F.A.O.W., … Thornton, P.K. (2009). Livestock, Livelihoods and the Environment : Understanding the Trade-offs. Current Opinion in Environmental Sustainability,1(2), 111–120.
- Herrero, M., Wirsenius, S., Henderson, B., Rigolot, C., Thornton, P., Havlik, P., & de Boer Gerber, I. (2015). Livestock and the environment : What have we learned in the past decade? doi:10.1146/annurev-environ-031113-093503.
- Herrero-Jáuregui, C., & Oesterheld, M. (2018). Effects of grazing intensity on plant richness and diversity: A meta-analysis. Oikos, 127, 757–766.
- Hijmans, R., & Parra, J.L. (2005). Very high resolution interpolated climate surfaces of global land areas. International Journal of Climatology, 25, 1965–1978.
- Homewood, K., Trench, P., Randall, S., Lynen, G., & Bishop, B. (2006). Livestock health and socio-economic impacts of a veterinary intervention in Maasailand . Infection-and-treatment vaccine against East Coast fever, 89, 248–271.
- Houspanossian, J., Giménez, R., Baldi, G., Nosetto, M., Houspanossian, J., Giménez, R., … Nosetto, M. (2016). Is aridity restricting deforestation and land uses in the South American Dry Chaco? Journal of Land Use Science, 4248. doi:10.1080/1747423X.2015.1136707
- IBGE (2018). Retreived from https://www.ibge.gov.br/estatisticas/economicas/agricultura-e-pecuaria/9201-levantamentsistematico-da-producao-agricola.html?=&t=series-historicasCorrectcitesisi.
- INTA, IER, SENASA. (2016, August 9). Existencia, distribución y eficiencia de la producción bovina en el Chaco semiárido,Otoño 2015. Retrieved for https://inta.gob.ar/documentos/existencia-distribucion-y-eficiencia-de-la-produccion-bovina.
- Irisarri, J.G.N., Aguiar, S., Oesterheld, M., Derner, J.D., & Golluscio, R.A. (2017). A narrower gap of grazing intensity. Reply to Fetzel et al., 2017. Seasonality constrains to livestock grazing intensity. Glob. Global Change Biology, 23, 3965–3966.
- Karger, D.N., Conrad, O., Böhner, J., Kawohl, T., Kreft, H., Soria-auza, R.W., … Kessler, M. (2017). Data Descriptor : Climatologies at high resolution for the earth’ s land surface areas. National Publication Gr, 4, 1–20.
- Klingler, M., Klingler, M., Richards, P.D., & Ossner, R. (2017). Cattle vaccination records question the impact of recent zero-deforestation agreements in the Amazon Cattle vaccination records question the impact of recent zero-deforestation agreements in the Amazon. doi:10.1007/s10113-017-1234-1
- Krausmann, F., Erb, K., Gingrich, S., Lauk, C., & Haberl, H. (2008). Global patterns of socioeconomic biomass flows in the year 2000: A comprehensive assessment of supply, consumption and constraints. Ecological Economics, 65, 471–487.
- Kreidenweis, U., Popp, A., Kehoe, D.L., Humpen, F., Kuemmerle, T., Leon, B., & Hermann, B. (2018). Pasture intensification is insufficient to relieve pressure on conservation priority areas in open agricultural markets. Global Change Biology, 24, 3199–3213.
- Kruska, R.L., Reid, R.S., Thornton, P.K., & Henninger, N. (2003). Mapping livestock-oriented agricultural production systems for the developing world. Agricultural Systems, 77, 39–63.
- Kuemmerle, T., Müller, D., Erb, K., Meyfroidt, P., Mu, D., Verburg, P.H., … Van Der Reenberg, A. (2013). Challenges and opportunities in mapping land use intensity gIobally. Current Opinion in Environmental Sustainability, 5, 484–493.
- Lambin, E.F., Gibbs, H.K., Ferreira, L., Grau, R., Mayaux, P., Meyfroidt, P., … Munger, J. (2013). Estimating the world’s potentially available cropland using a bottom-up approach. Global Environmental Change, 23, 892–901.
- Mac Nally, R. (2002). Multiple regression and inference in ecology and conservation biology: Further comments on identifying important predictor variables. Biodiversity and Conservation, 11, 1397–1401.
- Macchi, L., Baumann, M., Bluhm, H., Baker, M., Levers, C., Ricardo, H., & Tobias, G. (2019). Thresholds in forest bird communities along woody vegetation gradients in the South American. Dry Chaco, 1–11. doi:10.1111/1365-2664.13342
- Magliano, P.N., Murray, F., Baldi, G., Araud, S., Paez, R., Harder, W., & Jobbagy, E.G. (2015). Rainwater harvesting in Dry Chaco: Regional distribution and local water balance. Journal of Arid Environments, 123, 93–102.
- Martin, G., Moraine, M., Ryschawy, J., & Magne, M. (2016). Crop–Livestock integration beyond the farm level: A review. Agronomy for Sustainable Development, 36. doi:10.1007/s13593-016-0390-x
- Mastrangelo, M., & Gavin, M.C. (2012). Trade-Offs between Cattle Production and Bird Conservation in an Agricultural Frontier of the Gran Chaco of Argentina. Conservation Biology, 26, 1040–1051.
- Mazzini, F., Relva, M.A., & Malizia, L.R. (2018). Impacts of domestic cattle on forest and woody ecosystems in southern South America. Plant ecology, 219, 913–925.
- Miller, A.J. (1984). Selection of Subsets of Regression Variables. Journal of the Royal Statistical Society. Series A (General), 147, 389.
- Ministerio de Agroindustria, INTA, SENASA (2015). Caracterización de la Producción Bovina Buenos Aires – Corrientes – Chaco – Formosa - La Pampa.
- Morello, J., & Saravia Toledo, C. (1959). El bosque Chaqueño. La ganadería y El bosque en el oriente de Salta. Rev. Agronómica del Noroeste Argentino, 3, 209–258.
- Muller, R., Muller, D., Schierhorn, F., Gerold, G., & Pacheco, P. (2012). Proximate causes of deforestation in the Bolivian lowlands : An analysis of spatial dynamics. Regional Environmental Change, 12, 445–459.
- Nasca, J. A., Feldkamp, C. R., Arroquy, J. I., & Colombatto, D. (2015). Efficiency and stability in subtropical beef cattle grazing systems in the Northwest of Argentina. Agricultural Systems, 133, 85–96.
- National congress metting. (2007). Ley 26331 BOSQUES NATIVOS PRESUPUESTOS MINIMOS DE PROTECCION AMBIENTAL DE LOS BOSQUES NATIVOS.
- Naylor, R., Steinfeld, H., Falcon, W., Galloway, J., Smil, V., Bradford, E., … Mooney, H. (2006). Losing the Links Between. Science, 80, 3–5.
- Nepstad, D., Soares-Filho, B. S., Merry, F., Lima, A., Moutinho, P., Carter, J., … & McGrath, D. G. (2009). The end of deforestation in the Brazilian Amazon. Science, 326(5958), 1350–1351.
- Ng’ang’a, S.K., Bulte, E.H., Giller, K.E., Ndiwa, N.N., Kifugo, S.C., McIntire, J.M., … Rufino, M.C. (2016). Livestock wealth and social capital as insurance against climate risk: A case study of Samburu County in Kenya. Agricultural Systems, 146, 44–54.
- Nicolas, G., Robinson, T.P., Wint, W., Nicolas, G., Robinson, T.P., Wint, G.R.W., & Conchedda, G. (2016). Using Random Forest to Improve the Downscaling of Global Livestock Census Data Using Random Forest to Improve the Downscaling of Global Livestock Census Data. PloS one. doi:10.1371/journal.pone.0150424
- Oesterheld, M., Loreti, J., Semmartin, M., & Paruelo, J.M. (1999). Grazing, fire, and climate in grasslands and savannas, regimes and effects on primary productivity. Ecosystems of Disturbed Ground. In L.R. Walker (Ed.), Ecosystems of the World (Vol. 16, pp. 287–306). USA.
- OIE. (2019). Retreived from http://www.oie.int/en/animal-health-in-the-world/official-disease-status/fmd/list-of-fmd-free-members/
- Piquer-Rodríguez, M., Butsic, V., Gärtner, P., Macchi, L., Baumann, M., Gavier Pizarro, G., … Kuemmerle, T. (2018). Drivers of agricultural land-use change in the Argentine Pampas and Chaco regions. Applied Geography, 91, 111–122.
- Powell, P.A., Nanni, A.S., Názaro, M.G., Loto, D., Torres, R., & Gasparri, N.I. (2018). Characterization of forest carbon stocks at the landscape scale in the Argentine Dry Chaco Forest Ecology and Management Characterization of forest carbon stocks at the landscape scale in the Argentine Dry Chaco. Forest ecology and management, 424, 21–27.
- Ramankutty, N., Evan, A.T., Monfreda, C., & Foley, J.A. (2008). Farming the planet : 1. Geographic distribution of global agricultural lands in the year, 2000(22), 1–19.
- Rearte, D. 2010. Situacion actual y prospectivas de la produccion de carne vacuna.
- Robinson, T.P., Wint, W., Robinson, T.P., Wint, G.R.W., Conchedda, G., & Van Boeckel, T.P. (2014). Mapping the Global Distribution of Livestock. PloS one. doi:10.1371/journal.pone.0096084
- Rueda, C.V., Baldi, G.B., Verón, S.R., & Jobbágy, E.G. (2013). Apropiación humana de la producción primaria en el Chaco Seco. Ecología Austral, 23, 44–54.
- Seghezzo, L., Venencia, C., & Buliubasich, E.C. (2016). Participatory, Multi - Criteria Evaluation Methods as a Means to Increase the Legitimacy and Sustainability of Land Use Planning Processes. The Case of the Chaco Region in Salta, Argentina. Environmental management, 59(2), 307–324.
- Song, X., Hansen, M.C., Stephen, V., Peter, V., Tyukavina, A., Vermote, E.F., & Townshend, J.R. (2018). Global land change from 1982 to 2016. Nature, 560, 639–643.
- Thornton, P.K., Kruska, R.L., Henninger, N., Kristjanson, P.M., Reid, R.S., Atieno, F., … Ndegwa, T. (2002). Mapping Poverty and Livestock in the Developing World. Nairobi, Kenya: International Livestock Research Institute.
- Tubiello, F.N., Salvatore, M., Rossi, S., Ferrara, A., Fitton, N., & Smith, P. (2013). The FAOSTAT database of greenhouse gas emissions from agriculture. Environmental Research Letters, 8, 015009.
- Viglizzo, E.F., Frank, F.C., Carreño, L.V., Jobbágy, E.G., Pereyra, H., Clatt, J., … Ricard, M.F. (2011). Ecological and environmental footprint of 50 years of agricultural expansion in Argentina. Global Change Biology, 17, 959–973.
- Williams, A. 2018. Argentina sets new export record for booming bovine meat. Retrieved from www.globalmeatnews.com
- Wint, W., & Robinson, T. (2007). Gridded livestock of the world 2007 (No. FAO 636.2 W784 2007). Roma, Italia: FAO..