
ABSTRACT
Time-related information in land-change studies is reviewed using case studies in JLUS and LAND. An explicit focus on time has potential for exploring process-based perspectives. We report how time is represented and patterns in pre-analytical choices are detected, identifying practices to enhance the relevance and impact of land-change studies. Results show 40% of the studies use two datasets; the modal timespan and interval between datasets are 10 years; 79% are durations up to 30 years; 73% are changes since 1972. Modal start dates are 1990 and 2000. Dates ending in 0 and 5 are over-represented and lack explicit justification. The prevalence of a ‘two-date approach’ restricts measuring and analyzing change, identifying temporal non-stationarity is precluded, and modelling change pathways and responses to underlying system dynamics are limited. An improved focus on time in dataset choice to developimproved understanding of dynamics and change offers broader insights into land-system functions.
Introduction
Description and exploration of changes over time are fundamental to studies of land change (Lambin et al., Citation2006) and understanding of the nature of land-system dynamics within land-systems science (Aspinall & Staiano, Citation2017; Brown et al., Citation2013; Rindfuss et al., Citation2004). The data that are used (and available) for studying the complexity of both land-changes and land-system dynamics are important for identifying the capacity and focus of studies, since they allow quantification and measurement of the types of changes and dynamics that can be addressed (Rindfuss et al., Citation2004). Comparability and diversity of data and approaches also inform attempts to identify general patterns and trends across a range of studies (Geist & Lambin, Citation2002, Citation2004), and help to support the search for general theories of change and land systems (Rindfuss et al., Citation2004).
The ways in which time is conceptualised within studies of land change and dynamics are important because both land change and dynamics are time-centred phenomena. It is also an operational issue; however, since the ways in which time is conceptualised helps to define the measurement, data needs, theory, and models of change and dynamics (Isard, Citation1970; Schumm, Citation1998) and to focus research on processes. Time can be treated as a continuous or discrete parameter for modelling purposes, with consequences for data needed to describe and analyse change (Thornes & Brunsdon, Citation1977). For example, use of a series of sequential snapshots at selected time intervals, as when using satellite imagery or census data from successive dates to measure change, employs a discrete description of time in a series of data that measure the state of land at each observation date and reveal changes between the dates by calculation. Depending on the specific interval between dates for the snapshots, and the accuracy of classification, this approach can reveal change by calculation and inference, but these changes are computed from states and do not directly represent the events that change the state over time (Langran, Citation1992). Sequential snapshots may also not have the temporal resolution that helps to link changes to other factors or events influencing land change and dynamics, especially in the context of land systems that reflect the operation and interactions of drivers from human and environment sub-systems. Human and environment sub-systems themselves have time-related dynamics, including cycles, trends, and specific events, as well as history and path dependencies, that require measurement on a comparable basis to the measurement of change and dynamics in land cover and land use. A characteristic of human and environment sub-systems are that they will each operate over varying time spans (Schumm, Citation1998).
The selection of datasets to use in a study, and their time-related (and other) characteristics, is a pre-analytical choice made on the basis of research questions, hypotheses, and theory, as well as for a variety of operational and practical reasons related to data availability (Giampietro et al., Citation2006). Although these choices have a major influence on the nature of changes and dynamics that can be detected and described, the reasons for the pre-analytical choices are seldom made explicit, nor are their limitations evaluated as part of a discussion of change.
In this paper, we review time- and date-related characteristics of the data used in studies of land change published in the Journal of Land Use Science (JLUS) and in LAND. Our goals are (i) to synthesise published operational approaches to time, change and dynamics in land systems; (ii) to assess ways in which studies of change can develop further in order to improve understanding of land change as a process within as a dynamic coupled human-environment system; and (iii) to discuss the nature and role of time in studies of land, with observations on possible implications of the results for studies of land change more generally, and on uses of remote sensing data and other data in land-change studies and studies of dynamics of land systems.
Both JLUS and LAND are relatively recent additions to the international literature but are distinctive in their focus on land systems and land change (Aspinall, Citation2006; Millington, Citation2012; Müller & Munroe, Citation2014), and each has grown rapidly since being founded. The journals were started following the emergence and growth of a land-change and land-systems science community, that was established and fostered, in part, by the successive IHDP/IGBP programmes Land Use-Cover Change (LUCC), Global Land Project (GLP) and Global Land Programme (Global Land Project, Citation2005; Lambin et al., Citation1999; Verburg, Erb et al., Citation2013), as well as programmes of research funding (Justice et al., Citation2015; Moran et al., Citation2004). Although land-change research is published in a wide range of journals, we consider the percentage of papers on land change that make up the content of JLUS and LAND, and their relatively recent establishment, to indicate that they can be considered to provide a cross-section of the current state-of-the-art of land-change and land-systems science, as well as its recent evolution to support the discussion of time, change and land-system dynamics.
Data and methods
Metadata describing datasets used in studies of land change were extracted from all papers that describe land change published in the JLUS and LAND from the inception of the journals (JLUS: 2006; LAND: 2012) until December 2018. The metadata are:
the start and end dates over which land changes take place,
the span of time over which changes take place (total time interval between start and end dates)
the number and dates for all datasets used to characterise changes, since the change over the time span of a study is not only characterised by data for the start and end years, but also by data for times between the start and end.
These metadata are described using tabulation to summarise the characteristics of the data used. We recognise that any two of the start and end dates and span of time of the study are sufficient to define all three, but since it is not clear that span of time is an explicit pre-analytical choice for a study, rather than start and end dates, we report on all three, with the caveat that the three pieces of information are not independent.
Results
Number of case studies and types of data
A total of 734 papers were published in JLUS and LAND up to the end of 2018, of which 249 (34%) are concerned with change, presenting results for 327 case studies (). JLUS has published a higher percentage of papers on change than LAND, as could be expected given the specific missions of the two journals; the number of case studies per paper is similar for both journals (JLUS: mean 1.45 case studies per land-change paper, standard deviation 1.86; LAND: mean 1.16, sd 0.57)
Table 1. Summary of papers and case studies of land change in JLUS and LAND from the inception of each journal until december 2018
Datasets used to characterise change include satellite imagery, air photos, field surveys, national survey and census data, and pollen analysis.
Start and end dates
One paper (Kaplan et al., Citation2017) reports on land changes from the 4th millennium BC until the 19th century, but for the other 326 case studies, the earliest start dates are the years 1870 (JLUS) and 1651 (LAND). Three hundred and twenty of the case studies (98%) have a start year in the 20th or 21st Centuries. The starting and ending years for case studies that start and end in years since 1900 are shown in . Two hundred and seventy-two case studies (73.1%) have a start year on or after 1972, the first year of LANDSAT data (USGS, Citation1997), and 206 (55.4%) have a start year since 1985, following the availability of LANDSAT 4 and 5 data. The three most frequent start years are 1990 (n = 32; 10%) and 2000 (n = 26; 8%) and 1985 (n = 19, 5.8%); these three years combined are 24% of all case studies (n = 77). There is no significant statistical difference in either the mean start year among the case studies between the journals (JLUS mean 1982, sd 21.2, median 1987, LAND 1982 sd 38.7 median 1989; t = 0.165, p = not significant) or between the distribution functions of start years (Kolmogorov-Smirnov D193,134 = 0.132, not significant at p = 0.05), despite the different founding years for the two journals.
Figure 1. Start and end dates for post-1900 case studies of land change published in JLUS and LAND up to December 2018
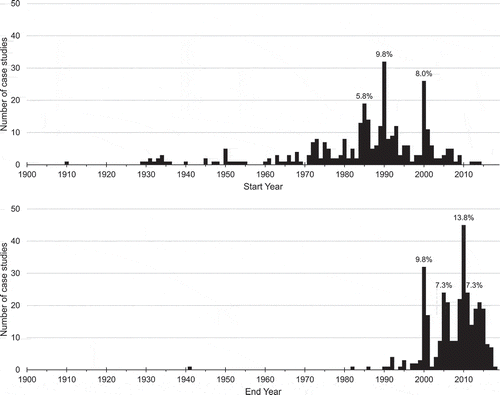
The end years for 323 (98.7%) of the 327 case studies are since 1990; 306 (93.6%) are since 2000 (). The most frequent end years are 2010 (n = 45, 13.8%), 2000 (n = 32, 9.8%) and 2005 and 2011 (each n = 24, 7.3%). These four years combined are 38% of all case studies (n = 125). There are 25 case studies (7.6%) with a start/end year of 1990/2000, 1990/2010 or 2000/2010. More generally, there appears to be a preference for years ending in 0 or 5 for each of start and end years, years ending in 0 comprising 25% of each of start years and end years, and 0 or 5 being 36% of start years and 38% of end years. This ‘digit preference’ for years ending in 0 and 5 is similar to age heaping in population census data (Myers, Citation1940; Nagi et al., Citation1973; West et al., Citation2005). The consequences of the prevalence of years ending in 0 or 5 are also apparent in the data for timespans (below).
There are statistically significant differences in end years, but not between start years, comparing the cases studies in JLUS and LAND. Given the 6 year difference in the founding year of each journal and the focus of studies on contemporary land changes, it is not surprising that a difference between the end years emerges. The mean and median end years for case studies in JLUS are about 5 years earlier than in LAND (JLUS mean 2005, sd 6.0, median 2006; LAND mean 2009, sd 15.7, median 2011; t = 6.22, p < 0.001) and testing the difference between the distribution functions for end years shows significance (Kolmogorov-Smirnov D193,134 = 0.42, p < 0.001). The difference between distribution functions of end years remains significant between the journals also for those case studies in papers published since 2012, when LAND was first published (Kolmogorov-Smirnov D149,134 = 0.309, p ≤ 0.001). The different years of foundation of the two journals thus have an impact on the two distributions of end dates, especially in the right tail of the distributions, but this does not preclude comparison of the case studies as exemplars of current practice in the study of land change. Statistical differences in means and distribution functions across the sets of case studies are relatively unimportant compared to the focus of case studies on particular periods of history, and selection of possible start and end dates for specific investigations. Specifically, the average (mean, median) dates computed across the set of case studies are unimportant for the changes studied in individual case studies, and the distribution function for end dates in case studies reflects a long period of history from which dates for individual case studies can be selected. As noted above, the start date and end date are related through the time span of the study, and thus the timespan could be the true driver of end dates, given the choice of start date.
Time span (or time interval) over which changes are observed
The time span for the 327 case studies is shown in . Two hundred and forty-three (74.3%) are of time span less than 30 years, 294 (89.9%) are of a time span less than 50 years, 26 (8%) of 51 to 100 years, and 7 (2%) are of a time span of more than 100 years. The longest time span for a case study is from 4250–3750BC until 1650–1850AD (Kaplan et al., Citation2017).
Figure 2. Time span of 327 case studies of land change published in JLUS and LAND up to December 2018. (Note log scale on abscissa)
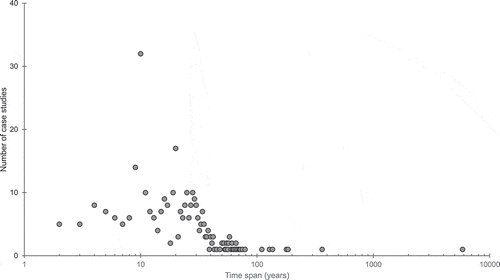
A wide range of time spans is evident within the 294 case studies of up to 50 years; the most frequent time span for case studies are 10 years (n = 32, 9.8%) and 20 years (n = 17, 5.2%). Sixty-two (21%) of the case studies of time span of 50 years or less are of 10, 20, 30, 40 or 50 years, and 32% (n = 92) are of a multiple of years ending in a 5 or 0. Both of these time spans, multiples of years ending in 0 or in 0 or 5, are significantly different than would be expected if years were selected at random time spans have occurred by chance (Chi-square: 44.6, df 9, p < 0.001; Chi-square: 26.2, df 4, p < 0.001, respectively).
Number of datasets used and sampling intervals for characterising change
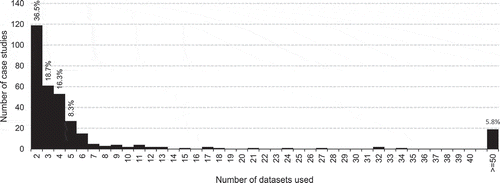
The number of datasets used to characterise change over and through the time span of each of the case studies is shown in . The histogram is strongly skewed to the left. In total, 180 case studies (55%) use 2 or 3 datasets, and 260 case studies (80%) use 5 datasets or fewer. The most frequent number of datasets used is 2 (n = 119, 36.5%), then 3 (n = 61, 19%). Nineteen case studies (5.8%) use 50 or more datasets; these mostly use composite time series of MODIS data (Setiawan & Yoshino, Citation2014; Souza et al., Citation2017; Tsutsumida et al., Citation2013).
Figure 3. Number of datasets used in case studies of land change published in JLUS and LAND up to December 2018
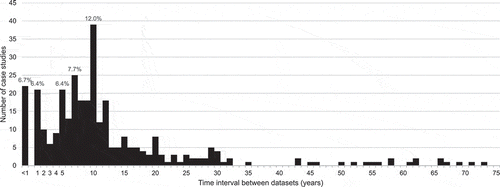
The time interval between the datasets used is shown in . Two hundred and two case studies (62%) have an interval of 10 years or fewer between sampled dates, 22 of these having a sampling interval of less than one year. The most frequent intervals between sample dates are 10 years (n = 39, 12%), 7 years (n = 25, 7.7%), and 5 years and 1 year (each n = 21, 6.4%).
Figure 4. Time interval between datasets used in case studies of land change published in JLUS and LAND up to December 2018
The number of datasets used, their dates, and the time span of the case study based on start and end years, combine to describe the intensity of sampling over the time span of the case study. shows the time span of case studies and the sampling intensity, shown as the mean interval between dates for each dataset used in a case study, for all 327 case studies, together with the number of datasets used.
Figure 5. Time span (years), mean number of years between sample dates (years), and number of datasets used for 327 case studies of land change published in JLUS and LAND up to December 2018. (Bubble size represents the number of case studies. Note log scales on ordinate and abscissa)
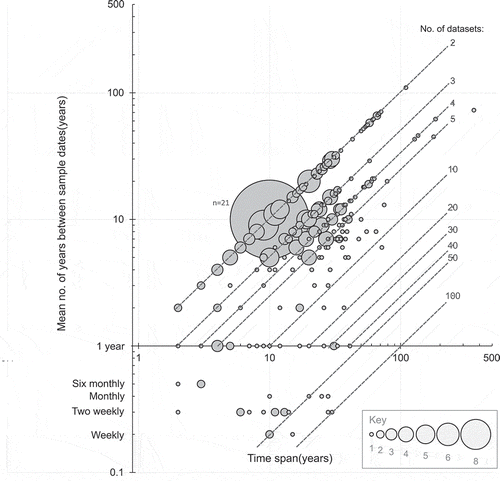
There are 120 case studies (36.7%) that have a sample interval equal to the time span. These studies, which use two datasets to document change over the time span, fall on the number of datasets equal 2 lines of . The most frequent combination of the interval between sample dates and time span is 21 case studies (6.4%) with a 10-year interval for a 10-year time span. Forty-three of the case studies (13.1%) have an annual sampling interval, the time spans of these studies ranging from 2 to 41 years (). Twenty-two (6.7%) of case studies use a sub-year time interval, 19 of these being monthly or less, and 3 of 6 months. The case studies employing sub-annual data typically use high time-resolution data to characterise seasonal dynamics of the land surface to derive more accurate estimates of properties to feed into the analysis of land change (e.g. (Tsutsumida et al., Citation2013), although Southworth et al use time-series analysis methods to examine long-term climate/vegetation changes across multiple scales (Southworth et al., Citation2013)).
Discussion
The start and end years of case studies, as well as the number and types of datasets used, are informative about the recent state and practice of land-change modelling. They also point to some other approaches that might become a focus for land-system science as the importance of complexity, sustainability, and interconnections of land systems as coupled human-environment systems increase in relation to contemporary systemic challenges at local to global scales (Verburg, Erb et al., Citation2013).
Current state
The focus on recent changes in land use for published case studies, reflected in the start years, and, particularly, end years, is not surprising, especially since the journals were first published in 2006 (JLUS) and 2012 (LAND). The focus on contemporary change means that the time span of changes studied is, correspondingly, focussed primarily on intervals of up to 30 years, particularly within the period from the 1970s to present, a period presenting fundamental issues and important challenges over land and its use, but, nevertheless, a relatively narrow period of socio-economic and political structures and technological capacities (Ellis et al., Citation2020; Meyer & Turner II, Citation1992; Young et al., Citation2006). Very few other studies have examined the time period or the use of time data across a range of case studies of land change. Geist and Lambin report the mean time horizon of 152 case studies of tropical deforestation as from 1940 to 1990 (mode) and 1960 to 1990 (mean), with a mean time span of 25 years (Geist & Lambin, Citation2002), and a mean time horizon of 1915 to 1994 for 132 case studies of desertification (Geist & Lambin, Citation2001, Citation2004). For comparison with Geist and Lambin, the case studies in JLUS and LAND have time horizon modal values of 1990–2000, 1990–2010 and 2000–2010, and a mean time horizon of 1982–2007 (although there is no single case study in the published set with 1982 and 2007 as its start and end years).
The frequency of 10- and 20-year time spans for studies, and the modal value of 10 years for the interval between datasets, possibly more reflects the practical difficulties of detecting changes in land sufficiently accurately using satellite imagery (Rocchini et al., Citation2013) and periodically collected survey and census data (Bank, Citation2010; FAO, Citation2015), than any underlying scientific or operational question inherent in the nature of land change in any case-study area. Further evidence for this comes from the prevalence of start and end years for calendar years that end in 0 and 5, and the associated prevalence of timespans for case studies that are decadal or quinquennial. This prevalence of decadal and quinquennial dates suggests that datasets may be being selected on the basis of regular dates rather than to frame specific events of interest in land use history, This evidence emphasises the consequences of choices made in pre-analytical stages of studies (Giampietro et al., Citation2006), and authors, editors and referees might usefully expect explicit documentation of why particular dates were used as an inclusion of future published work.
Use of satellite imagery also results in many of the existing published change studies being based on detection of changes in categories or classes of land cover, rather than a change in condition or use of land (Bakker & Veldkamp, Citation2008; Comber, Citation2008), although detailed sub-year time series of data offer opportunities for analysis of changes over short timescales. This has implications for the relevance of land-change studies, since gradual and evolutionary changes in land management that influences land change and its dynamics are not revealed in this type of dataset and study. Thus, although the 10-year interval between datasets represents both a recent and contemporary focus for land-change studies, and the modal time span is corresponding of 10 years, their frequency in case studies perhaps indicates that a ‘two datasets at 10-year interval’ case study has become a kind of de facto standard for land-change studies, especially for those based on satellite imagery.
Analysis of land changes using few datasets and, generally, over a decadal time span, does have some limitations, even if methodologically well established in the published literature and operationally practical for case studies, as well as providing useful insights (Guneralp et al., Citation2020). Changes that are identified and documented using two datasets a decade apart, are primarily descriptive, with results that apply to a narrow, and relatively short-term, cross-section of time and the specific history of an area. Their link to causation is often general, through drivers of change, but offers limited power to analyse specific and dis-aggregated changes related to individual drivers over the course of the time span studied, partly because of an inability to match cause and effect on shorter-time scales and to identify non-stationarity and path dependence in change; they are also limited by lack of independent test data for model evaluation that might establish and test general patterns of change over a longer time span (Pontius & Spencer, Citation2005). Relatively few case studies (in JLUS and LAND) provide a longer-term perspective (Haase & Nuissl, Citation2010; Ray & Pijanowski, Citation2010; Statuto et al., Citation2017). The focus of case studies on a narrow range of time spans is similar to findings of meta-studies of models of land change (Agarwal et al., Citation2002; Evans et al., Citation2013). Case studies of change, as summarised in this paper, that focus on a narrow range of time spans does not foster the development of models that can be parameterised or tested for longer or shorter timespans; explicit attention to timescales and the temporal resolution of change data would be of benefit to both case studies of land change and models of change.
Case studies with a more frequent sampling interval tend to use time series of survey and census data rather than imagery, and although often not as explicitly ‘spatial’ (Agarwal et al., Citation2002), in the sense of a detailed-scale spatial description of the land-cover geography of a study area as a study based on satellite imagery, the shorter time interval between datasets provides advantages in detecting consequences of drivers for land change, and an improved understanding of temporal dynamics over the time span of the case study. Some studies combine imagery with census data (Fore et al., Citation2015). There are also 23 case studies (7%) among the 327 that use MODIS and SENTINEL composite image time-series data (Mishra et al., Citation2015; Setiawan & Yoshino, Citation2014; Sirin et al., Citation2018; Souza et al., Citation2017); these data are used to generate improved accuracy of land surface characterisation based on seasonal dynamics.
Time and land change
We suggest that studies of land change would benefit from introducing some underlying conceptual frames to include time more explicitly in studies of change, and to use of time as part of the analysis, beyond defining the time interval and historic period for the results. Currently, there are few ‘time-focussed’ theories of change beyond Forest Transition Theory (Mather, Citation2004; Walker, Citation2008), the general sequences of change over millennia (Ellis et al., Citation2020), and other transitions (Meyfroidt et al., Citation2018), and, within the complexity of land-system change and dynamics, there are few process-based studies, observed changes typically being ascribed to different drivers of change, often without consideration of mechanism or consideration of any temporal nature and evolution of drivers (Steen-Adams et al., Citation2015). Process studies are common in other fields, but the current study of land change appears more typically to be concerned with the documentation of the change in the state of the land, although land change is itself a process with relevance to many issues (Meyfroidt et al., Citation2019; Turner II et al., Citation2007; Verburg, Mertz et al., Citation2013) and scientific disciplines (Ellis, Citation2015; Turner II et al., Citation2004; Watson et al., Citation2014). Clearly study of process is complex in coupled human-environment systems (Erb et al., Citation2017; Meyfroidt et al., Citation2018; Young et al., Citation2006), and research directions in modelling for land change are encouraged to develop process-based models to improve understanding of interactions and feedbacks within land systems (Brown et al., Citation2013; National Research Council, Citation2014); data and case studies are needed to support this focus on the process. With time as a more explicit focus within case studies, we might expect to see studies of causation in complex process-responses of land systems, and increased attention to land change within the wider dynamics of land systems as coupled human-environment systems. Further, land-change studies most frequently treat change as a result of stationary processes (which is bound to be the case with the use of only two dates as data points in time), and given the frequency of dates since 1970, coinciding with availability of satellite imagery, as a start date for the change, mostly about ‘recent’ change. Studies of change over longer time intervals and in different historic periods show that the type and emphasis of different drivers of change need not be stationary over time (Aspinall, Citation2004; Steen-Adams et al., Citation2015), and that path dependence can be an important factor in change (Brown et al., Citation2005). A greater variety of temporal dynamics might be uncovered by investigating land change over longer time intervals (Thirsk, Citation1997). For example, what changes, if any, are reversible/irreversible, and, if reversible, over what time spans? How are land changes explained as a series of sequential events, and are there repeated patterns of change? Is change slower or more rapid over time, and under what conditions? Are process-response dynamics in coupled human-environment systems explicit, or is it sufficient to attribute the change to a set of non- or temporal drivers of change, especially following the typology of drivers in meta-studies of change that were part of the LUCC programme (Geist & Lambin, Citation2002, Citation2004)?
As noted above, the use of satellite imagery in land-change studies produces a shift of focus to change in land category or class, rather than change in condition or use, although there are exceptions such as studies of change in both extent and density of urban areas (MacLachlan et al., Citation2017), and in land condition (Del Barrio et al., Citation2010; Ringrose et al., Citation2003). A focus on category change is a limitation because gradual and evolutionary changes in land management practices within a category of land cover or use, with their acknowledged impacts on social, economic, environmental sub-systems, including, for example, labour, biodiversity, water, food, and health, seldom show up in this type of dataset. The role and impacts of land-change processes depend on a variety of measures of change, including the frequency, sequence, time span and magnitude of change (Watson et al., Citation2014). Explicit recognition of interactions of time, space, causality and scale have been important in the development of other disciplines such as geomorphology and physical geography (Gregory, Citation1985; Schumm & Lichty, Citation1965), and would be of benefit in land-systems science.
More attention to how time is conceptualised and use in land-change studies might move land-system science from accounting for change as the result of a set of drivers, to addressing observed change and dynamics in land systems as a reflection of changes to the underlying coupled system, rather than simply to one or more drivers producing the observed changes in cover (Steen-Adams et al., Citation2015). Understanding land-system change as a process, and understanding land-system dynamics as a function of the evolution, cycles, trends and other temporal dynamics of underlying human and environment sub-systems are also important in relation to planning for possible future changes, to issues of sustainability, and to addressing the pressures currently faced in relation to food, biodiversity, climate, ecosystem services, landscapes, populations and health (Nielsen et al., Citation2019; Verburg, Erb et al., Citation2013; Verburg, Mertz et al., Citation2013).
Conclusion
This analysis of published case studies of land change from JLUS and LAND shows the dominance of the use of data for a few snapshots in time to characterize change. In particular, the dominance of the use of two datasets shows that the design of change studies has the potential for improvement to move from a description of the change to understanding of the dynamics of land change. This is particularly relevant for studies of land systems as coupled human-environment systems, in which process-based interactions and feedbacks between system components are fundamental to understanding. Although the descriptive study of changes offers a record of changes that have occurred, it is relatively limited for linking change to processes and events.
We propose that three changes to case studies of land change would provide a basis for improved understanding of time, change and land-system dynamics:
An improved and explicit conceptualization of time in studies of land change, and consequential use of more temporally detailed data, for both land change and human and environment sub-systems.
A focus, across case studies but also, where possible, within individual case studies, on longer, shorter, and multi-scale time scales. The case studies published in JLUS and LAND to the end of 2018 have a dominant focus on recent change (since 1970), and development of case studies with longer-term perspectives and in different periods of history offer possibilities for more varied examples and insights. Similarly, case studies with shorter time perspectives are required to examine land changes relevant to processes and dynamics in related systems, such as human and ecological systems, that have important short-term dynamics with longer-term consequences (Watson et al., Citation2014)
Authors, editors and referees should establish that suitable reporting of temporal characteristics for case studies is required as a norm. This will not only add to the conduct towards full and open reporting of land-systems and land-change research, but will also establish a context for individual case studies that brings a broader synthesis in land-systems science.
SupplInfoLAND.docx
Download MS Word (58.9 KB)SupplementaryInfoJLUS.docx
Download MS Word (67.2 KB)Acknowledgments
RA acknowledges financial support from the University of Naples for collaboration with the STAD group based at the University of Naples Federico II. MS acknowledges financial support from the European Union’s Horizon 2020 research and innovation programme under grant agreement No 689669. DP and RA acknowledge financial support from the Massey University International Visitor Research Fund. This work reflects the authors’ views only: the funding agencies are not responsible for any use that may be made of the information contained. We thank the two anonymous referees for their constructive feedback and comments.
Supplemental data
Supplemental data for this article can be accessed here.
Disclosure statement
No potential conflict of interest was reported by the authors.
Related Research Data
References
- Agarwal, C., Green, G.M., Grove, J.M., Evans, T.P., & Schweik, C.M. (2002). A review and assessment of land-use change models: Dynamics of space, time and human choice. Indiana: F. S. US Department of Agriculture.
- Aspinall, R.J. (2004). Modelling land use change with generalized linear models - a multi-model analysis of change between 1860 and 2000 in gallatin valley, Montana. Journal of Environmental Management, 72(1–2), 91–103. https://doi.org/10.1016/j.jenvman.2004.02.009
- Aspinall, R.J. (2006). Editorial. Journal of Land Use Science, 1(1), 1–4. https://doi.org/10.1080/17474230600743987
- Aspinall, R.J., & Staiano, M. (2017). A conceptual model for land system dynamics as a coupled human-environment system. Land, 6(4), 81. https://doi.org/10.3390/land6040081
- Bakker, M.M., & Veldkamp, A. (2008). Modelling land change: the issue of use and cover in wide-scale applications. Journal of Land Use Science, 3(4), 203–213. https://doi.org/10.1080/17474230802465181
- Bank, W. (2010). Global Strategy to improve Agricultural and Rural Statistics. T. W. Bank.
- Brown, D.G., Page, S., Riolo, R., Zellner, M., & Rand, W. (2005). Path dependence and the validation of agent-based spatial models of land use. International Journal of Geographical Information Science, 19(2), 153–174. https://doi.org/10.1080/13658810410001713399
- Brown, D.G., Verburg, P.H., Pontius, J.R.G., & Lange, M.D. (2013). Opportunities to improve impact, integration, and evaluation of land change models. Current Opinion in Environmental Sustainability, 5(5), 452–457. https://doi.org/10.1016/j.cosust.2013.07.012
- Comber, A.J. (2008). Land use or land cover? Journal of Land Use Science, 3(4), 199–201. https://doi.org/10.1080/17474230802465140
- Del Barrio, G., Puigdefabregas, J., Sanjuan, M.E., Stellmes, M., & Ruiz, A. (2010). Assessment and monitoring of land condition in the Iberian Peninsula, 1989-2000. Remote Sensing of Environment, 114(8), 1817–1832. https://doi.org/10.1016/j.rse.2010.03.009
- Ellis, E.C. (2015). Ecology in an anthropogenic biosphere. Ecological Monographs, 85(3), 287–331. https://doi.org/10.1890/14-2274.1
- Ellis, E.C., Beusen, A.H.W., & Goldewijk, K.K. (2020). Anthropogenic Biomes: 10,000 BCE to 2015 CE. LAND, 9(5), 129. https://doi.org/10.3390/land9050129
- Erb, K.H., Luyssaert, S., Meyfroidt, P., Pongratz, J., Don, A., Kloster, S., & Dolman, A.J. (2017). Land management: Data availability and process understanding for global change studies. Global Change Biology, 23(2), 512–533. https://doi.org/10.1111/gcb.13443
- Evans, T.P., Robinson, D.T., & Schmitt-Harsh, M. (2013). Limitations, Challenges, and Solutions to Integrating Carbon Dynamics with Land-Use Models. In D.G. Brown, D.T. Robinson, N.H.F. French, & B.C. Reed (Eds.), Land Use and the Carbon Cycle. Advances in Integrated Science, Management and Policy (pp. 178–208). Cambridge University Press.
- FAO. (2015). World programme for the census of agriculture 20201. . Rome: F. a. A. O. o. t. U. Nations. Retrieved from FAO Statistical Development Series.
- Fore, S., Overmoe, K., & Hill, M.J. (2015). Grassland conservation in North Dakota and Saskatchewan: Contrasts and similarities in protected areas and their management. Journal of Land Use Science, 10(3), 298–322. https://doi.org/10.1080/1747423X.2013.858787
- Geist, H.J., & Lambin, E.F. (2001). What drives tropical deforestation? A meta-analysis of proximate and underlying causes of deforestation based on subnational case study evidence. Louvain-la-Neuve. LUCC Report Series: 4. LUCC International Project Office
- Geist, H.J., & Lambin, E.F. (2002). Proximate causes and underlying driving forces of tropical deforestation. Bioscience, 52(2), 143–150. https://doi.org/10.1641/0006-3568(2002)052[0143:PCAUDF]2.0.CO;2
- Geist, H.J., & Lambin, E.F. (2004). Dynamic causal patterns of desertification. Bioscience, 54(9), 817–829. https://doi.org/10.1641/0006-3568(2004)054[0817:DCPOD]2.0.CO;2
- Giampietro, M., Allen, T.F.H., & Mayumi, K. (2006). The epistemological predicament associated with purposive quantitative analysis. Ecological Complexity, 3(4), 307–327. https://doi.org/10.1016/j.ecocom.2007.02.005
- Global Land Project. (2005). Science Plan and Implementation Strategy. Stockholm. IGBP Report No. 53/IHDP Report No. 19. IHDP
- Gregory, K.J. (1985). The Nature of Physical Geography. Edward ARnold.
- Guneralp, B., Reba, M., Hales, B.U., Wentz, E.A., & Seto, K.C. (2020). Trends in urban land expansion, density, and land transitions from 1970 to 2010: A global synthesis. Environmental Research Letters, 15(4), 044015. https://doi.org/10.1088/1748-9326/ab6669
- Haase, D., & Nuissl, H. (2010). The urban-to-rural gradient of land use change and impervious cover: A long-term trajectory for the city of Leipzig. Journal of Land Use Science, 5(2), 123–141. https://doi.org/10.1080/1747423X.2010.481079
- Isard, W. (1970). On Notions and Models of Time. Papers in Regional Science, 25(1), 7–31. https://doi.org/10.1111/j.1435-5597.1970.tb01475.x
- Justice, C.O., Gutman, G., & Vadrevu, K.P. (2015). NASA land cover and land use change (LCLUC): an interdisciplinary research program. Journal of Environmental Management, 148, 4–9. https://doi.org/10.1016/j.jenvman.2014.12.004
- Kaplan, J.O., Krumhardt, K.M., Gaillard, M.-J., Sugita, S., Trondman, A.-K., Fyfe, R., … Nielsen, A.B. (2017). Constraining the deforestation history of europe: evaluation of historical land use scenarios with pollen-based land cover reconstructions. Land, 6(4), 91. https://doi.org/10.3390/land6040091
- Lambin, E.F., Geist, H., & Rindfuss, R.R. (2006). Introduction: Local Processes with Global Impacts. In E.F. Lambin & H. Geist (Eds.), Land-use and land-cover change (pp. 1–8). Springer-Verlag.
- Lambin, E.F., Baulies, X., Bockstael, N., Fischer, G., Krug, T., Leemans, R., & Vogel, C. (1999).Land-use and land-cover change (LUCC): implementation strategy. Stockholm and Bonn. IHDP. IGBP Report No. 48, IHDP Report No. 10.
- Langran, G. (1992). Time in Geographic Information Systems. Taylor and Francis.
- MacLachlan, A., Biggs, E., Roberts, G., & Boruff, B. (2017). Urban Growth Dynamics in Perth, Western Australia: Using Applied Remote Sensing for Sustainable Future Planning. Land, 6(1), 9. https://doi.org/10.3390/land6010009
- Mather, A.S. (2004). Forest transition theory and the reforesting of Scotland. Scottish Geographical Journal, 120(1–2), 83–98. https://doi.org/10.1080/00369220418737194
- Meyer, W.B., & Turner II, B.L. (1992). Human population growth and global land-use/cover change. Annual Review of Ecology and Systemaics, 23(1), 39–61. https://doi.org/10.1146/annurev.es.23.110192.000351
- Meyfroidt, P., Abeygunawardane, D., Ramankutty, N., Thomson, A., & Zeleke, G. (2019). Interactions between land systems and food systems. Current Opinion in Environmental Sustainability, 38, 60–67. https://doi.org/10.1016/j.cosust.2019.04.010
- Meyfroidt, P., Chowdhury, R.R., de Bremond, A., Ellis, E.C., Erb, K.H., Filatova, T., … Verburg, P.H. (2018). Middle-range theories of land system change. Global Environmental Change-Human and Policy Dimensions, 53, 52–67. https://doi.org/10.1016/j.gloenvcha.2018.08.006
- Millington, A. (2012). Land — A multidisciplinary journal addressing issues at the land use and sustainability nexus. Land, 1(1), 1–4. https://doi.org/10.3390/land1010001
- Mishra, N.B., Crews, K.A., Miller, J.A., & Meyer, T. (2015). Mapping vegetation morphology types in Southern Africa Savanna using MODIS time-series metrics: a case study of central kalahari, Botswana. Land, 4(1), 197–215. https://doi.org/10.3390/land4010197
- Moran, E.F., Skole, D.L., & Turner II, B.L. (2004). The development of the international Land-Use and Land-Cover Change (LUCC) research program and its links to NASA’s Land-Cover and Land-Use Change (LCLUC) initiative. In G. Gutman, A.C. Janetos, C.O. Justice, E.F. Moran, J.F. Mustard, R.R. Rindfuss, D. Skole, B.L. Turner II, & M.A. Cochrane (Eds.), Land Change Science (pp. 1–15). Kluwer Academic Publishers.
- Müller, D., & Munroe, D.K. (2014). Current and future challenges in land-use science. Journal of Land Use Science, 9(2), 133–142. https://doi.org/10.1080/1747423X.2014.883731
- Myers, R.J. (1940). Errors and bias in the reporting of ages in census data. Transactions of the Actuarial Society of America, 41(2), 295–415.
- Nagi, M.H., Stockwell, E.G., & Snavley, L.M. (1973). Digit preference and avoidance in the age statistics of some recent African Censuses: Some patterns and correlates. International Statistical Review, 41(2), 165–174. https://doi.org/10.2307/1402833
- National Research Council. (2014). Advancing Land Change Modeling: Opportunities and Research Requirements. W. D. National Academies Press. https://doi.org/10.17226/18385.
- Nielsen, J.O., de Bremond, A., Chowdhury, R.R., Friis, C., Metternicht, G., Meyfroidt, P., … Thomson, A. (2019). Toward a normative land systems science. Current Opinion in Environmental Sustainability, 38, 1–6. https://doi.org/10.1016/j.cosust.2019.02.003
- Pontius, R.G., & Spencer, J. (2005). Uncertainty in extrapolations of predictive land-change models. Environment and Planning B-Planning & Design, 32(2), 211–230. https://doi.org/10.1068/b31152
- Ray, D.K., & Pijanowski, B.C. (2010). A backcast land use change model to generate past land use maps: Application and validation at the Muskegon River watershed of Michigan, USA. Journal of Land Use Science, 5(1), 1–29. https://doi.org/10.1080/17474230903150799
- Rindfuss, R.R., Walsh, S.J., Turner, B.L., Fox, J., & Mishra, V. (2004). Developing a science of land change: Challenges and methodological issues. Proceedings of the National Academy of Sciences of the United States of America, 101(39), 13976–13981. https://doi.org/10.1073/pnas.0401545101
- Ringrose, S., Vanderpost, C., & Matheson, W. (2003). Mapping ecological conditions in the Okavango delta, Botswana using fine and coarse resolution systems including simulated SPOT vegetation imagery. International Journal of Remote Sensing, 24(5), 1029–1052. https://doi.org/10.1080/01431160210155046
- Rocchini, D., Foody, G.M., Nagendra, H., Ricotta, C., Anand, M., He, K.S., … Neteler, M. (2013). Uncertainty in ecosystem mapping by remote sensing. Computers & Geosciences, 50, 128–135. https://doi.org/10.1016/j.cageo.2012.05.022
- Schumm, S.A. (1998). To Interpret the Earth: 10 ways to be wrong. Cambridge University Press.
- Schumm, S.A., & Lichty, R.W. (1965). Time, space and causality in geomorphology. American Journal of Science, 263(2), 110–119. https://doi.org/10.2475/ajs.263.2.110
- Setiawan, Y., & Yoshino, K. (2014). Detecting land-use change from seasonal vegetation dynamics on regional scale with MODIS EVI 250-m time-series imagery. Journal of Land Use Science, 9(3), 304–330. https://doi.org/10.1080/1747423X.2013.786151
- Sirin, A., Medvedeva, M., Maslov, A., & Vozbrannaya, A. (2018). Assessing the land and vegetation cover of abandoned fire hazardous and rewetted peatlands: comparing different multispectral satellite data. Land, 7(2), 71. https://doi.org/10.3390/land7020071
- Southworth, J., Rigg, L., Gibbes, C., Waylen, P., Zhu, L., McCarragher, S., & Cassidy, L. (2013). Integrating dendrochronology, climate and satellite remote sensing to better understand savanna landscape dynamics in the okavango delta, Botswana. Land, 2(4), 637–655. https://doi.org/10.3390/land2040637
- Souza, C.H.W.D., Cervi, W.R., Brown, J.C., Rocha, J.V., & Lamparelli, R.A.C. (2017). Mapping and evaluating sugarcane expansion in Brazil’s savanna using MODIS and intensity analysis: A case-study from the state of tocantins. Journal of Land Use Science, 12(6), 457–476. https://doi.org/10.1080/1747423X.2017.1404647
- Statuto, D., Cillis, G., & Picuno, P. (2017). Using historical maps within a gis to analyze two centuries of rural landscape changes in Southern Italy. Land, 6(3), 65. https://doi.org/10.3390/land6030065
- Steen-Adams, M.M., Langston, N., Adams, M.D.O., & Mladenoff, D.J. (2015). Historical framework to explain long-term coupled human and natural system feedbacks: Application to a multiple-ownership forest landscape in the northern great lakes region, USA. Ecology and Society, 20(1), 28. https://doi.org/10.5751/ES-06930-200128
- Thirsk, J. (1997). Alternative Agriculture. A History. Oxford University Press.
- Thornes, J.B., & Brunsdon, D. (1977). Geomorphology and Time. Methuen.
- Tsutsumida, N., Saizen, I., Matsuoka, M., & Ishii, R. (2013). Land cover change detection in ulaanbaatar using the breaks for additive seasonal and trend method. Land, 2(4), 534–549. https://doi.org/10.3390/land2040534
- Turner II, B.L., Moran, E.F., & Rindfuss, R.R. (2004). Integrated land-change science and its relevance to the human sciences. In G. Gutma\n, A.C. Janetos, C.O. Justice, E.F. Moran, J.F. Mustard, R.R. Rindfuss, D. Skole, B.L. Turner II, & M.A. Cochrane (Eds.), Land Change Science (pp. 431–447). Kluwer Academic Publishers.
- Turner II, B.L., Lambin, E.F., & Reenberg, A. (2007). The emergence of land change science for global environmental change and sustainability. Proceedings of the National Academy of Sciences of the United States of America, 104(52), 20666–20671. https://doi.org/10.1073/pnas.0704119104
- USGS. (1997). USGS fact sheet 084–97. Landsat Data - A Brief History of the Landsat Program.
- Verburg, P.H., Erb, K.H., Mertz, O., & Espindola, G. (2013). Land system science: between global challenges and local realities. Current Opinion in Environmental Sustainability, 5(5), 433–437. http://dx.doi.org/10.1016/j.cosust.2013.08.001
- Verburg, P.H., Mertz, O., Erb, K.H., Haberl, H., & Wu, W.B. (2013). Land system change and food security: Towards multi-scale land system solutions. Current Opinion in Environmental Sustainability, 5(5), 494–502. http://dx.doi.org/10.1016/j.cosust.2013.07.003
- Walker, R. (2008). Forest transition: without complexity, without scale. Professional Geographer, 60(1), 136–140. https://doi.org/10.1080/00330120701724277
- Watson, S., Luck, G.W., Spooner, P.G., & Watson, D.M. (2014). Land-use change: Incorporating the frequency, sequence, time span, and magnitude of changes into ecological research. Frontiers in Ecology and the Environment, 12(4), 241–249. https://doi.org/10.1890/130097
- West, K.K., Robinson, J.G., & Bentley, M. (2005). Did proxy respondents cause age heaping in the census 2000? ASA Section on Survey Research Methods.
- Young, O.R., Berkhout, F., Gallopin, G.C., Janssen, M.A., Ostrom, E., & van der Leeuw, S. (2006). The globalization of socio-ecological systems: an agenda for scientific research. Global Environmental Change, 16(3), 304–316. https://doi.org/10.1016/j.gloenvcha.2006.03.004