
ABSTRACT
The objectives of the study are to identify LULC types that have undergone changes due to quality coffee production and assess smallholders’ perceptions of the LULC changes associated with their coffee production practices in Yirgacheffe coffee area, southern Ethiopia. The study used Landsat satellite images of 1988, 2003, and 2018 to examine the LULC change. In addition, household surveys and focus group discussions were carried out to assess land management practices in the study area. The findings show that forest coffee (FC) cover decreased at a rate of 1.02% per year in the 30-year time, which was mostly changed to semi-forest and semi-plantation coffee cover. The study area has also experienced an increase in semi-plantation cover (0.07% per year), semi-forest coffee (0.9% per year) over the study period, showing a gradual decrease in vegetation cover. This also suggests that a major driving force for the local LULC change is the increasing demand for coffee in the global and national market, as evident from the increasing trend of coffee export from Ethiopia. Survey data show that quality coffee production drives coffee agroforest conversion while it has potitive effects on land management practices by smallholders. Reducing the current heavy dependence of livelihoods on coffee as the single most important commodity is likely to enhance sustainability of the coffee agroforests in the area.
1. Introduction
Land use and land cover change broadly refers to modifications of the terrestrial surface of the Earth. It is driven by complex and interacting biophysical and socioeconomic factors operating at different scales of space and time (Lambin et al., Citation2001; Rahn et al., Citation2018). This is shown by many studies (e.g. Hailu et al., Citation2018; Hettig et al., Citation2016; Woldu et al., Citation2015). For example, Hettig et al. (Citation2016) found that a combination of factors including soil suitability, terrain and distance to market significantly affected land use decisions in tropical coffee production areas . Other studies noticed upward shift of coffee production over time due to climate change in Ethiopia (Bunn et al., Citation2015). In addition to local biophysical and human factors, farmers’ land use decisions are also influenced by decisions and actions of other actors along the value chain of a coffee as a commodity. For some land users, such as quality coffee producers, choices and decisions of global actors can influence local-scale land use decisions.
Ethiopia is one of the major coffee producing countries (Baker, Citation2014), and coffee plays a pivotal role in Ethiopian economy; it is the livelihood of more than 20% of the economically active population and contributes more than 25% of the country’s foreign exchange earnings (Meskela & Teshome, Citation2014). In particular, as Ethiopia’s role in the global coffee market lies mainly on the fine quality of its coffee (Daviron and Ponte, 2007), its specialty coffee enjoys a high global demand in the global market. Haggar et al. (Citation2013) stated that the global demand for quality coffee affects land use decisions on coffee farms and thereby land use patterns and management options in Ethiopia.
Quality coffee refers to a single-origin and highest grade, organically produced coffee, differentiated by its superior flavour and it claims price premiums (Minten et al., Citation2018; Ponte & Gibbon, Citation2005). Its production is a land resource-based activity and hence has different effects on land, forest and biodiversity resources (Daviron & Ponte, Citation2007). It also involves material variables (i.e. tools, cultivars, water, and nutrients), structural variables (i.e. institutions and markets), and subjective factors, such as individual and shared values and beliefs. One such quality coffee producing areas is Yirgacheffee in Ethiopia, which produces specialty coffee (as a variant of quality coffee) that fetches premium prices in the global market (Degefa, Citation2016). For this study, speciality coffee is a type of quality coffee produced mainly for the global market by smallholders in Yirgacheffe.
Studies on effects of quality production on land use and management show mixed results. For example, Pender et al. (Citation2006) reported improvements in land management and land use in the highlands of central Kenya due to coffee production. In Uganda, adoption of organic land management practices and perceived improvements in resource and livelihoods were attributed to coffee and banana production (Nkonya et al., Citation2008). In contrast, there are other studies that found cash crop production to be negatively associated with sustainable land use practices (Hylander et al., Citation2013; Jassogne et al., Citation2013; Woldu et al., Citation2015). Hence, the effects of quality production on land use practices are site specific, despite there are global drivers to quality coffee production and associated land use change (Denu et al., Citation2016; Gole, Citation2015). Rueda and Lambin (Citation2013) also stated that the main driver of LULC change in general is peoples’ response to economic opportunities like demand for commodities facilitated by institutional factors.
There are many studies on LULC change in coffee-producing areas of Ethiopia claiming that LULC change is generally due to proximate causes, such as expansion of agriculture, and underlying drivers like population growth, markets and cultural factors (Denu et al., Citation2016; Kassa et al., Citation2016; Kebede et al., Citation2019; Kebede, Citation2018; Wubie et al., Citation2016). In particular, it is evident that increasing yield and quality by gradually replacing forest coffee systems with intensified coffee plantations affects forest biodiversity in many coffee-producing areas of Ethiopia (Gole & Senbeta, Citation2008; Senbeta & Denich, Citation2006). However, there is no strong research evidence on distant factors for land use change in coffee producing areas (Friis, Citation2017; Friis et al., Citation2016)). Thus, the trade-offs between increasing yield and quality driven by global demand and forest loss are not adequately researched and understood (Hylander et al., Citation2013). Indeed, none of the above-mentioned studies have focused on understanding effects of quality coffee production (as a spearhead of distant factors) on LULC change and hence there is dearth of information on effects of quality coffee production on local scale land use and land cover. Furthermore, the processes motivating land use decisions are very important and they are affected by land users’ values and beliefs (Lambin et al., Citation2006). In Ethiopia, there is no study as far as we know it on the interaction between LULC change and land users’ perceptions, values and belief systems.
The general objective of this paper is to assess LULC change associated with quality coffee production in Yirgacheffe area, Ethiopia. The specific objectives are to: (i) quantify LULC change between 1988 and 2018; (ii) understand effects of quality coffee production on land use and management practices; and (iii) assess perceptions of the smallholder producers about quality coffee production and land use and management practices in the study area. The remainder of the paper is organized as follows: The second section describes materials and methods, and the third section presents results. Section 4 presents discussions. Conclusions and future research needs are presented in Section 5.
2. Materials and methods
2.1. Study area
Yirgachceffe is one of the six rural districts in Gedeo Zone, southern Ethiopia (). Located between 6°09ʹ and 6°32ʹ N and 38°08ʹ and 38°32 E, it is part of the eastern escarpment of the Rift Valley System of Ethiopia with altitudinal range of 1501–2500 masl (Negash, Citation2007). The dominant soil type is dystric nitosols (Umbric), which is known to be well drained and suitable for forests and perennial crops.
Figure 1. Location map of the study area
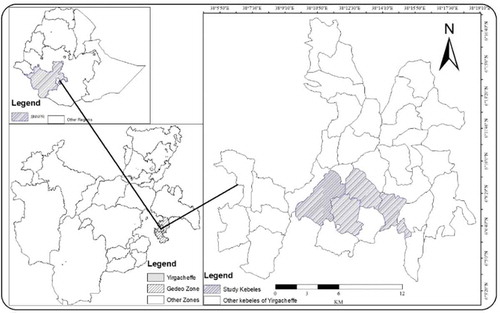
The climate of Yirgacheffe is humid, and measurements at Dilla (6°20ʹ N, 38°20ʹE at altitude of 1579 m asl) show that annual rainfall ranges between 1200 and 1800 mm, with a bimodal distribution. The main rainy season, which is known as Kiremt, lasts from June to November and the second rainy season, which is known as Belg, lasts from March to May. The mean annual temperature varies from 15°C to 20°C. The vegetation cover of the area includes different trees and shrubs, along with perennial crops like coffee and enset (E.ventricosum),Footnote1 The district’s geography supports a widespread practice of agroforestry (Negash, Citation2007).
With a total area of 358.65 km2 and an average population density of 652 persons/km2the study area is one of the most densely populated parts of Ethiopia (its density far exceeds the regional average of 122 persons/km2 and the national average of 72 persons/km2) (Ayele et al, 2014; Ayele et al., Citation2019). Yirgacheffe is a high-quality Arabica coffee producing area (Alambo & Yimam, Citation2019), and it has the largest proportion (52%) of farmers producing coffee in the Gedeo Zone (Degefa, Citation2016). The livelihoods of people are heavily dependent on an indigenous agroforestry system, which involves growing coffee (C. arabica), enset (E. ventricosum), and varieties of fruits, such as mango (M. indica), and avocado (P. americana). The coffee harvest time is from December to March. This agroforestry practice has contributed to a sustained human carrying capacity, and supported biodiversity and ecosystem services for many years (Legesse et al., Citation2013); though the area has come under increasing pressure in the last couple of decades (Negash, Citation2007)
2.2. Methods
The study is based on interpretation of satellite remote sensing images and socioeconomic data generated through household survey and field observation. While remote sensing provides a large spatio-temporal framework for LULC change detection, household survey and field observation provide insights into the more subtle human dimensions related to drivers and processes of LULC change (Jiang, Citation2003). The LULC change can be quantified by analysing satellite images. Surveys and interviews with local residents and stakeholders are crucial for understanding processes of changes that will be missed in satellite images (Ambinakudige & Choi, Citation2009). This affirms that supplementing interpretation of remote sensing images with survey methods can improve understanding of extent of LULC change including its drivers and processes of change (Shrestha, Citation2000).
2.2.1. Remote sensing image analysis
We used Landsat TM images to detect LULC change because of its free accessibility, while it has a good spectral and temporal resolution and moderate spatial resolution (Mihai et al., Citation2007). Three cloud free satellite remote sensing images: Landsat TM image for 1988, Landsat ETM+ for 2003 and Landsat 8 OLI/TIRS for 2018, with path/row 156/68 were downloaded from the USGS at http://www.earthexplorer.usgs.gov. We selected these years based on the following rationale. The 1988 image was taken because it was after 1989 that changes like establishment of market centres in rural areas to make local markets more competitive and promote quality coffee production were undertaken (Daviron & Ponte, Citation2007). The 2003 image was taken because quality coffee production was recognized in 2002 (Minten et al., Citation2018); and the 2018 image was taken to assess the recent status of coffee cover. The images used are of the same season (January and February) to minimize seasonal reflectance variations and hence reduce image misclassification.
The Landsat images were then layer stacked into single image for each year (Sarkar, Citation2018) and six band images (1–5, and 7) were produced. Radiometric calibration was undertaken in ENVI (Environment for Visualizing Images) 5.3 software to convert digital numbers (DNs) into a more meaningful units of reflectance and hence to generate high-quality scenes of the images. Atmospheric correction was also performed to minimize the atmospheric disturbances of signals reaching the sensors, and thereby to obtain accurate ground radiance from the target (Mihai et al., Citation2007). The images were then geo-referenced, and were projected into UTM Zone 37 N and WGS 1984 datum, and image subsets were clipped for the study area, i.e. Yirgacheffe district.
The 1987 large-scale aerial photograph (1:50,000) was obtained from the Ethiopian Mapping Agency (EMA) and scanned in A3 format with resolution of 1200 dpi and radiometrically corrected to 8 bit resolution with grey scale; and, mono registration and orthorectifcation were performed in ERDAS IMAGINE 2014. The aerial photos were overlaid on a topographic map (1:50,000) which were also obtained from the EMA. Ground Control Points (GCPs) were collected based on the scanned and processed aerial photographs, with average 0.47 Root Mean Square Error, and had been used as a reference data for the 1988 and 2003 Landsat image classifications and accuracy assessment. In doing so, 50 samples for each LULC category were collected from aerial photos and Google Earth images; and 1250 reference points were collected, of which 850 and 400 were used for training samples and accuracy assessments, respectively. These samples were stored in Excel (csv format) and then imported into QGIS 3.16 to convert to shape files.
Supervised image classification with random forest algorithm was performed using Quantum Geographic Information system (QGIS 3.16) to prepare each land use class. Compared to the traditional and basic algorithms like maximum likelihood classification, random forest is one of the machine-learning algorithm that provides high accuracy results. The higher accuracy of RF was attributed to its ensemble manner in which several classification trees are trained on subsets of the training data (Abdullah et al., Citation2019). A random forests algorithm creates numerous decision trees for each pixel. Each of these decision trees votes on what the pixel should be classified, and the land cover class that receives the most votes is then assigned as the land use class for that pixel.
Since random forest’s performance significantly depends on the predictor variables and training data quality, we included multiple types of auxiliary data, biophysical and spectral variables, both continuous and categorical, to improve classification performance and discrimination between LC classes. In addition to the six reflective Landsat bands (bands 1–5 and 7), we used Green Vegetation Index (GVI) since they are capable of discerning vegetation from bare features (Kolios & Stylios, Citation2013). In order to further enhance the representation of vegetation, we extracted the Normalized Difference Vegetation Index (NDVI). As multicollinearity affects the coefficients and p-values, but it does not influence the predictions (Hair et al., Citation2019), and we attempted here to make only predictions of distribution of the coffee cover and not to interpret the regression coefficients of variables, while acknowledging the lowered level of overall predictive ability. As such, we may not need to check for it. Assuming that human activity and the artificial environment are linked to the existence of a road network, we derived distance from the road network layer based on the Euclidean distance function for each image (Gounaridis et al., Citation2016).
While the training samples for the 2018-image classification were obtained from a GoogleEarth high-resolution imagery downloaded via the open layers plugin for QGIS version 3.16, the aerial photographs were used for classification of the 1988 and 2003 images. Training points and predictor variable data were collated in a database. A set of predictor variables was extracted for each training polygon. Each training sample contained the information about every potential predictor variable as well as about the LULC classes based on the information from the polygons, and the classification process was implemented using the random Forest in Olfeo toolbox in QGIS 3.16. Frequent field visits, and consultations with farmers and local experts were also performed to augment the image classifications. Finally, five main LULC classes were identified: forest coffee, semi-forest coffee, semi plantation, and grassland and built up areas ().
Table 1. Description of LULC classes identified in Yirgacheffe, southern Ethiopia
Accuracy assessment was performed to evaluate the degree of accuracy of the image classification. The accuracy assessment of 1988 and 2003 classifications were undertaken based on reference data from aerial photographs. The reference data for 2018 image classification were collected from Google Earth images of 2018, and from the field by using a hand-held Global Positioning System (GPS). As it has already been mentioned, 400 reference points were used, and assigned proportionally to the size of each LULC class (FAO, Citation2016). Error matrices were generated for the maps; and the producer’s, user’s, and overall accuracies were computed. While producer’s accuracy is the number of correctly classified pixels in each class divided by the number of pixels classified in that class, the user’s accuracy is a measure of correctly classified pixels in each class divided by the number of training samples in that class (Sarkar, Citation2018). Overall accuracy is the total number of correctly classified pixels divided by the total number of sample points.
LULC changes between the periods considered were then detected from the classified images using the image difference formula (Mihai et al., Citation2007); i.e. I = S2-S1, where I is the change detection, S2 is the second image classification (later year), and S1 is the first image classification (earlier year). Change matrices were generated using cross tabulation in ArcGIS Spatial Analyst tool to assess from-to conversion among the LULC classes. Conversion map that shows gains, losses and persistence of LULC types for each period were computed.
2.2.2. Household survey
From a preliminary field visit, two different groups of coffee farmers were identified: speciality and conventional coffee farmers. Speciality coffee farmers are designated by the district coffee development department as certified organic producers, accredited to export their coffee product directly to roasters, and they possess landholding sizes of 2 ha and above, albeit not much greater than 2 ha as indicated in . Conventional farmers do not have these characteristics, and production not labelled as specialty coffee. The vast majority of coffee producers in the study area are conventional; out of 3425 farmers, only 120 were speciality coffee producers. All of these 120 were included in the household survey sample.
Table 2. Error matrix for the three image classifications
Table 3. LULC change in Yirgacheffe between 1988, 2003 and 2018
Table 4. LULC change matrix between 1988 and 2003
Table 5. LULC change matrix of between 2003 and 2018
Table 6. Average production and Yield of coffee in the study area in the last 5 years
To select a representative sample from the conventional group, we used the list of conventional coffee farmers from the district office. We took 232 samples (which is ~7%) from 3315 farmers, using a systematic random sampling procedure. The overall number of survey participants was therefore 352. The household survey was conducted with household heads using a structured questionnaire and face-to-face interviews that took place from December 2018 to March 2019. The survey captured general information about respondents’ household characteristics and demographics, and views on effects of quality coffee production on land use change, change in land area under coffee, and land management practices associated with coffee production. We also included questions about the global demand for coffee. The quantitative data generated by the household survey were analysed using percentages, cross tabulations and χ2 tests to determine the association between type of coffee production, and farmers’ views on the drivers of LULC change and land management practices.
2.2.3. Qualitative data collection
Focus Group Discussions (FGDs), key informant interviews, and field observation were used to collect qualitative data. Four FGDs were conducted with 7–10 participants of different ages, men/women, speciality, and conventional coffee farmers. The diversity of participants was maintained by consulting local experts. The FGDs were guided by checklists, and topics discussed included issues related to quality coffee production, land use decisions, and land management practices. In-depth interviews were undertaken with extension workers and district experts using a checklist of questions about the effects of coffee production on land use and management practices. Field observation was undertaken on the sites of coffee production. In addition, secondary data from the district office were collected on the role of selected actors in coffee production.
Audio-recorders and digital cameras were used to gather oral and visual data. The audio-records were transcribed, interpreted and analysed. Analysis of the qualitative data involved coding, pinpointing to underlying concepts, building themes, and explaining overarching themes about the settings of coffee production and land management practices.
3. Results
3.1 Image classification
shows results of accuracy assessment of the image classification. The user’s accuracy of individual classes ranges from 86% for semi-forest coffee (SFC), semi-plantation coffee (SPC) in 1988, and built-up area of 2003 to 95% for forest coffee (FC) in 2018. The producer’s accuracy ranges from 88% for semi-plantation coffee (SPC) in 1988 to 95% for built-up areas in 2003 and forest coffee in 2018.
A greater user’s accuracy than producer’s accuracy in most land use classes indicates a significant agreement between the map data and classified data (Sarkar, Citation2018). The overall accuracy was 88%, 89%, and 92% for the 1988, 2003, and 2018 maps, respectively, and further analysis is possible (Rwanga & n.d.ambuki, Citation2017). The classified maps of the three years are shown in and areas of the LULC classes are summarized in . The following section describes these results.
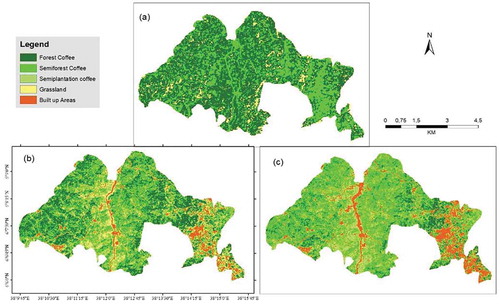
Figure 2. LULC of Yigracheffe in 1988(a), 2003(b), and 2018(c)
3.2 Land use and land cover change
Period 1: 1988–2003
During this period, there was a significant decrease in forest coffee (FC) cover and an increase in semi-forest coffee (SFC) cover and semi-plantation coffee cover. Forest coffee represents the largest share (59.4%) in 1988, but declined with time being converted to semi forest and semi-plantation coffee cover. In particular, there is a decrease of forest coffee from 21,313.4 ha (59.4%) in 1988 to 13,054.3 ha (36.4%) in 2003.
In contrast, semi-forest coffee expanded from 12,063.2 ha (33.6%) in 1988 to 21,199.7 ha (59.1%) in 2003. The increase in semi-forest coffee cover can be attributed to the intensive coffee management practices over the 15-year time. The semi-plantation coffee cover showed a steady increase from 3.6 ha (0.01%) to 250.2 ha (0.7%) in coverage in this period. Consultations with experts and documents also indicated quality coffee production in the form of semi-plantation coffee in Yirgacheffe commenced in 2002. The total coffee cover increased from 33,380.2 ha (93.1%) in 1988 to 34,502.1 ha (96.2%) in 2003. This corresponds to the finding of Bunn et al. (Citation2015) which indicated expansion of coffee cover in Ethiopia, evidently stating that coffee yield decreased while production increased in the last three decade.
Regarding non-coffee land cover, while grassland cover decreased from 2,478.9 ha (6.9%) in 1988 to 1185.2 ha (3.3%) in 2003, built-up areas, that include mainly roads and rural settlements, increased from 6.7 to 175.7 ha over this period. The greater decrease in grassland (1292.9 ha) and a slight increase in built-up areas (169 ha) in this period that indicated the conversion of grassland to coffee coverage. The increase in built-up areas is attributable to the expansion of settlements and roads spurred by population growth, which could in turn contributed to expansion of the semi-plantation coffee in the subsequent decades.
The change matrix () over this period (1988–2003) depicted a remarkable increase in semi-forest coffee coverage (9,136.5 ha), with an annual rate of increase of 609.1 ha over the fifteen-year period. However, part of this was converted to forest coffee (1,882.7 ha), grassland (1,122.2 ha), semi-plantation coffee (179.4 ha) and built-up areas (98.2 ha). Substantial shrinkage in forest coffee cover (8,258.9 ha) was also observed, with rate of 550.6 ha/year over this period. In addition, it gained area from built-up area (0.4 ha), semi forest (1,882.7 ha), and grassland (745.6 ha). Asked about the gain from built-up areas (atypical finding), key informants stated that some coffee processing stations (as built-up areas) have been relocated to other areas due to environmental reasons, and those locations have been reforested since the 1990s.
The semi-plantation coffee gained cover from forest coffee and semi-forest coffee of 69.1 ha and 179.4 ha, respectively, and increased from 3.6 ha to 250.6 ha over this period. While grassland gained cover from forest (20.7 ha) and semi-forest coffee (1,122.2 ha), other parts of it were lost to forest (745.6 ha) and semi-forest coffee (1,660.9 ha). Overall, grassland experienced remarkable loss over this period (decreased by 1,292.9 ha). Similarly, the built-up areas gained cover at the expense of forest coffee (41.2 ha), semi-forest coffee (98.2 ha), and grassland (29.5 ha) and thereby increased from 7.0 to 175.3 ha during this period.
Period 2: 2003-2018
In this period, shows that forest coffee cover further decreased from 13,054.3 ha (36.4%) in 2003 to 10,388.5 ha (28.9%) in 2018, and semi-forest coffee increased from 21,199.6 ha (59.1%) to 21,450.3 ha (59.8%). Semi-plantation increased to 720.9 ha (from 250.2 ha in 2003), mainly at the expense of forest and semi-forest coffee. This is partly due to the increasing demand of differentiated coffee that has stimulated intensification of coffee production since 2002. From the non-coffee covers, grassland and built-up areas increased, i.e. from 1185.2 ha (3.3%) in 2003 to 2985.1 ha (8.3%) in 2018 for grassland and from 175.7 ha (0.5%) in 2003 to 320.4 (0.9%) in 2018 for built-up areas.
The LULC change matrix () during this period indicated that area of semi-forest coffee was converted to forest coffee (2,259.3 ha), semi-plantation (606.7 ha), and grassland (2,221.13 ha) and built-up area (30.8 ha). The most important contributor to the increased semi-plantation coffee cover, which is a quality coffee production, is the semi-forest coffee coverage (606.7 out of the 720.9 ha).
Grassland cover gained area mainly from semi-forest coffee (2,221.3 ha) and simultaneously parts of it were changed into forest coffee (383.7 ha), semi-plantation coffee (17.5 ha) and built-up area (14.2 ha). A significant conversion of semi-forest coffee into grassland (2,221.3 ha) in this period highlights another path of forest degradation. Built-up areas increased from 176.1 ha to 320.2 ha, gaining area from forest coffee (107.5 ha) and semi-forest coffee (30.8 ha) that could be due to the expansion of settlement, roads, and rural schools and health centres. A network of roads may result in the expansion of human activities, such as infrastructural development and urban expansion along with the removal of vegetation cover.
From 1988 to 2018
As it can be seen from , forest coffee decreased at 1.02%/year and semi-forest coffee cover increased at 0.9%/year (). Semi plantation coffee, grassland and built-up area showed only slight increases at rates of 0.07%, 0.1%, and 0.03% per year, respectively. Besides, the semi-forest coffee cover increased remarkably by gaining area mainly from forest coffee, which went down substantially over the study period. The land covers of semi-plantation coffee, grassland and built-up areas increased ().
Figure 3. Annual rate (a) and patterns (b) of LULC change in Yirgacheffe (1988–2018)
also shows that the difference between specialty and conventional coffee production in terms of both yield and production amount is statistically significant. As shown in the table, speciality coffee farmers have higher production amount in the last 5 years than the conventional producers, with significant statistical difference (t = 21.5, p < 0.001). The average coffee yield in the last 5 years was also higher for speciality coffee producers than the conventional producers with statistically significant difference (t = 9.7, p < 0.001), while there is statistically significant difference in landholding size (t = 19.7, p < .000). Theoretically, scarcity of land and commodification is driving factors for intensification indicated by increased yield (Lambin et al., Citation2001). In this vein, the speciality coffee farmers with larger farm size than the conventional producers had higher yield. This implies that commodification of speciality coffee production has been more intensified and resulted in conversion of forest coffee into semi-forest and semi-plantation coffee over the study period.
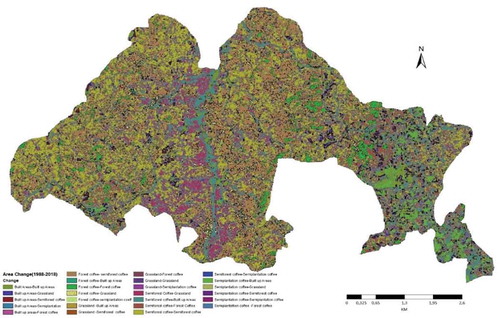
The results of the change detection (1988–2018) are presented for the five classes in . The figure reveals that many of the forest coffee areas in the 1988 have been converted into semi forest and semi plantation cover over the study period. Similarly, linear features on the map also indicated that the road networks including the highway (that largest linear feature traversing the study area from north to south). This implies that the expansion of roads and infrastructures contributed to the intensification of coffee production through the conversion of forest and semi-forest coffee covers into semi-plantation coffee.
Figure 4. Land use/cover Conversion map of the study area (1988–2018)
3.3 Land Users’ Perceptions of LULC change
As shown in , about 37% of all respondents acknowledged that there had been an increase in quality coffee coverage over the last two decades, while a significant proportion (33.2%) of respondents did not recognize any change in quality coffee coverage in the study area. Among the quality coffee producers (n = 120), about 49% perceived an increase in quality coffee coverage, whereas about 40% of conventional coffee producers reported no change in the quality coffee cover in the area. The Chi-square test also indicated significant difference between respondents of the two groups in terms of perception of land area change under quality coffee production (χ2 = 17.5, p < 0.001).
Table 7. Farmers’ perceptions of quality coffee cover change (% of respondents)
About 72% of the quality coffee producers who perceived a change in area under quality coffee mentioned the increase in global demand of the coffee as a driver of LULC change. In contrast, only about 21% of the conventional coffee producers who perceived increases in land cover of quality coffee believed this was the reason for the land use change. The Chi-square test also revealed significant difference between respondents of quality coffee producers and conventional coffee producers in terms of perception on drivers of LULC in Yirgacheffe (χ2 = 89.1, p < .001). Discussions with district experts revealed that the Ethiopian coffee sector felt the collapse of the International Coffee Agreement (ICA) in 1989 since coffee is a global commodity, although smallholders were believed to have a limited relationship to the global coffee market (Pender et al., Citation2006). Therefore, coffee farmers were encouraged to increase coffee yield and quality using different schemes of certification like organic produce.
Other reasons mentioned for the LULC change by the conventional coffee producers include domestic policies (46% of respondents) and national demands (29%).The same reasons were mentioned by only 10% and 17% of quality coffee producers, respectively. The influence of increase in local demand can indeed be significant, and could be a good opportunity for Ethiopian coffee market in case of global price fluctuations, as about 55% of the annual coffee production in the country is consumed domestically (Minten et al., Citation2018).
also indicated that the increasing trend of quality coffee export from Ethiopia over the 30 years of time. This could be the response to the global demand for quality coffee in the global market, and drive the land use change in many coffee producing areas of Ethiopia. This concords the perceptions of smallholder farmers (particularly the specialty coffee producers) on the global demand for quality coffee as a driver for land use decisions and ensuing land use change in coffee producing areas.
Figure 5. Trend of quality coffee export from Ethiopia (1988–2018). Source, FAOSTAT,2019
3.4. Quality coffee production and land management
The main activities related to coffee production were assessed considering their potential to land management. The main benefit of implementing these land management practices is expected to be higher and more stable coffee yields, increased system resilience, therefore, enhanced the coffee livelihoods, and reduced production risk. In this section, we summarize findings from a field survey on specific land management practices undertaken by the conventional and quality coffee producers.
As shown in , about 68% of speciality coffee producers reported that they undertook terracing as a mainland management practice while a smaller proportion of conventional coffee producers (42%) implemented this practice. The Chi-square test also confirmed that there was significant difference between the two groups (χ2 = 21.55, p < .001). The proportion of speciality coffee producers constructing soil bunds on their coffee farms was larger (92%) than the conventional coffee producers (82%), with statistically significant difference (χ2 = 5.99, p = 0.014). About 77% and 75% of speciality coffee and conventional coffee producers practised mulching, respectively. Moreover, some 23% of speciality and 31% of conventional coffee producers applied manure, respectively, with statistically no significant difference (χ2 = 1.66, p = 0.197). The proportion of speciality coffee and conventional coffee producers intercropping coffee with annual crops were 63% and 83%, respectively. The Chi-square test indicated a significant difference existed in application of intercropping coffee with annual crops (χ2 = 14.3, p < .001). This confirms results of the LULC change analysis indicating that quality coffee production is a driver of intensification, shifting from mixed production to single (coffee) production.
Table 8. Land management practices by smallholder coffee producers (% of respondents)
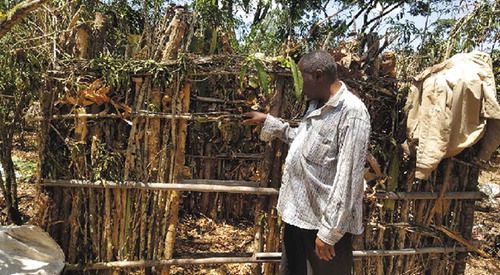
While 69% of the speciality coffee producers reported using compost on their coffee farms, fewer (19%) of the conventional coffee farmers used this land management practice, showing a significant statistical difference (χ2 = 11.43, p < 0.001). This was confirmed by field observation on how farmers prepare compost from mixing cattle urine, dung, ash, coffee husks, and leaves of enset (E. ventricosum) to produce organic coffee (). About 83% and 52% of conventional and speciality coffee producers implemented annual crop rotation, respectively, and the difference was statistically significant (χ2 = 16.30, p < 0.001). The low level of annual crop rotation for speciality producers than for conventional coffee producers may be due to the intensification of production by speciality producers.
Figure 6. Composting (2 × 2 × 1.5 m volume) by a speciality coffee farmer
4. Discussion
The LULC change analysis revealed a general trend of changes from forest coffee to semi-forest coffee as well as from forest and semi-forest to semi-plantation cover. In particular, the semi-plantation coffee cover showed a high increase followed by semi-forest coffee, whereas forest coffee cover showed a significant decline over the study period. These findings corroborate the results of previous studies (Gole & Senbeta, Citation2008; Hylander et al., Citation2013; Senbeta & Denich, Citation2006) which reported that the traditional coffee production and management was replaced by intensive form of management in Ethiopia. This involves an effort to increase coffee productivity through the conversion of forest coffee into semi-forest coffee and then to semi-plantation system by way of removing competing undergrowth and canopy trees, leading to the loss of forest biodiversity. Farmers open up the canopy by thinning shade trees, and clearing the under-storey vegetation to increase coffee yield.
The remarkable increase in semi-plantation coffee cover could be due to the increasing global demand for quality coffee, as coffee is a global commodity, and subsequent increasing trend of quality coffee export over the study period. This highlights that the increasing demand of quality coffee in the global market influences smallholders’ land use decisions and practices of land management. This agrees with several studies (Ambinakudige & Choi, Citation2009; Rueda & Lambin, Citation2013) that mentioned that global coffee markets have influences on land use decisions and practices by smallholders. Furthermore, while smallholders reflected a commonly held view on marked LULC change, variations were noticed between quality/speciality and conventional coffee producers in terms of the drivers for the change. Quality coffee producers attributed the LULC change mainly to global drivers of LULC change, i.e. demand for quality coffee in the global market whereas conventional coffee farmers were more likely to recognize domestic coffee market, as Ethiopia consumes about 50% of its annual production. This difference appears due to a closer linkage of quality coffee producers to the global market than the conventional group. This highlights that quality coffee production links smallholders in the remote south to consumers in the north, whilst smallholders are of limited voice in the global coffee market (Pender et al., Citation2006).
Although there is forest coffee loss due to specialty coffee production, survey results indicated that speciality coffee producers were more likely to perform some land management practices than the conventional producers. For instance, the speciality coffee producers were more likely to uptake terracing, soil binding and compost than the conventional coffee producers. As the speciality coffee producers endeavour to increase quality and yield of their coffee, and thereby meet the growing quality standards (e.g. organic), they undertake different land management practices, indicating that quality coffee production might positively influence coffee farm management. This finding agrees with previous studies (Hylander et al., Citation2013; Schroth et al., 2009), which claimed that quality coffee production contributes to sustainable land management.
5. Conclusions
This study provides evidence of LULC changes in Yirgacheffe district indicating that there were major LULC changes over the study period (1988–2018) showing that forest coffee has largely been converted into semi-forest and semi-plantation coffee cover. Global demand in quality coffee drives LULC changes as quality coffee production in Ethiopia is export oriented, and thereby exacerbates forest degradation with implications on smallholders’ livelihoods and ecosystem services of the area. However, quality coffee producers were more likely to undertake land management practices than the conventional coffee producers, which reveals that quality coffee production might encourage land management practices at farm level while it exacerbates forest degradation through the conversion of forest and semi-forest coffee to semi-plantation coffee cover at larger spatial scales. The increase in grassland cover (2003–2018) potentially has significant impact on forest degradation in the study area. This needs further study to ‘net out’ the trade-offs of quality coffee production vis-a-vis sustainable land management and deforestation. It was also found that global demand of quality coffee influences land users’ decisions and practices by smallholders. Yet, this needs further study to understand to what extent the increasing demands for quality coffee influences such land use decisions. In terms of methods, this study demonstrates that integrated use of remote sensing image analysis and survey methods can better assess processes of land use change and quantify the changes.
Acknowledgments
We would like to thank Karen O’Brien and Milda Nordbø Rosenberg, and two anonymous reviewers for their critical and constructive comments on the earlier version of the paper. We extend our sincere thanks to all data collectors and farmers who took part in the surveys of the study. We would also like to acknowledge the Norwegian Research Council for funding the Project ‘The role of global value chains in transition to sustainability’ (Project number 255664).
Disclosure statement
The authors declare no conflict of interest.
Additional information
Funding
Notes
1. Enset is a staple food in the study area.
References
- Abdullah, A.Y., Masrur, A., Sarfaraz, M., & Adnan, G. (2019). Spatio-temporal patterns of land use/land cover change in the heterogeneous coastal region of Bangladesh between 1990 and 2017. Remote Sensing, 11(7), 1–28. https://doi.org/10.3390/rs11070790
- Alambo, F.I., & Yimam, H.A. (2019). Elderly Care and Social Support Systems among the Gedeo of Southern Ethiopia : Socio-cultural Contexts, Forms, Dynamics and Challenges. African Studies Quarterly, 18(3).
- Ambinakudige, S., & Choi, J. (2009). Global coffee market influence on land-use and land-cover change in the Western Ghats of India. Land Degradation and Development, 20(3), 327–335. https://doi.org/10.1002/ldr.921
- Ayele, G., Hayicho, H., & Alemu, M. (2019). Land Use Land Cover Change Detection and Deforestation Modeling: In Delomena District of Bale Zone, Ethiopia. Journal of Environmental Protection, 10(04), 532-561.
- Ayele,G., Ewnetu, A.Y., & Asfaw, Z. (2014). Economic Evaluation of Coffee-Enset - Based Agroforestry Practice in Yirgachefe Woreda, Ethiopia : Comparative Analysis with Parkland Agroforestry Practice. Journal Sustainable Development, 5(27), 72–82.
- Baker, P. (2014). (2015). Global Coffee Production and Land Use Change Global Coffee Production and Land Use Change. (September 2014) 25th Conference of ASIC(Association Scientifique Internationaionale pour le cafe) at Colombia.
- Bunn, C., Läderach, P., Ovalle Rivera, O., & Kirschke, D. (2015). A bitter cup: Climate change profile of global production of Arabica and Robusta coffee. Climatic Change, 129(1–2), 89–101. https://doi.org/10.1007/s10584-014-1306-x
- Daviron, B., & Ponte, S. (2007). The Coffee Paradox: Global Markets, Commodity Trade and the Elusive Promise of Development -. The World Economy, 30(6), 1031–1032. https://doi.org/10.1111/j.1467-9701.2007.01041_3.x
- Degefa, S. (2016, January). (2016). Home garden agroforestry practices in the Gedeo zone, Ethiopia : A sustainable land management system for socio-ecological benefits. In: Boafo,Y.A. and Ichikawa,K.(eds) Socio-Ecological Production Landscapes and Seascapes in Africa. The United Nations University Institute for Advanced Study of Sustainablity: Tokyo. pp. 28–36.
- Denu, D., Platts, P.J., Kelbessa, E., Gole, T.W., & Marchant, R. (2016). The role of traditional coffee management in forest conservation and carbon storage in the Jimma Highlands, Ethiopia. Forests Trees and Livelihoods, 25(4), 226–238. https://doi.org/10.1080/14728028.2016.1192004
- FAO. (2016). Map accuracy assessment and area estimation : A practical guide. National Forest Monitoring Assessment Working Paper, E(46), 69.
- FAOSTAT. (2019). Accessed on February 2019 www:fao.org/faostat//en/#data/
- Friis, C. and Nielsen, J. (2017). Land-use change in a telecoupled world : The relevance and applicability of the telecoupling framework in the case of banana plantation expansion in Laos. Ecology and Society, 22(4),30. http://doi.org/10.5751/ES-09480-22043
- Gole, T.W. (2015). Environment and coffee forest forum coffee : Ethiopia ’ s gift to the world the traditional production. 2–61. (accessed on 18 April 2015). http://www.naturskyddsforeningen.se/sites/default/files/dokument-media/coffee_-_ethiopias_gift_to_the_world_ecff_2015
- Gole, T.W., & Senbeta, F. (2008). Sustainable management and promotion of forest coffee in bale, Ethiopia. Bale Ecoregion Sustainable management programm, August, 44.
- Gounaridis, D., Apostolou, A., & Koukoulas, S. (2016). Land cover of Greece, 2010: A semi-automated classification using random forests. Journal of Maps, 12(5), 1055–1062. https://doi.org/10.1080/17445647.2015.1123656
- Haggar, J., Medina, B., Aguilar, R.M., & Munoz, C. (2013). Land use change on coffee farms in southern guatemala and its environmental consequences. Environmental Management, 51(4), 811–823. https://doi.org/10.1007/s00267-013-0019-7
- Hailu, Y., Tilahun, B., Kerebeh, H., & Tafese, T. (2018). Agricultural and Resource Economics : International Scientific E-Journal Agricultural and Resource Economics : International Scientific E-Journal. 4(4), 20–30.
- Hair, J.F., Black, W.C., Babin, B.J., & Anderson, R.E. (2019). Multivariate Data Analysis (7th ed.). Cengage learning.
- Hettig, E., Lay, J., & Sipangule, K. (2016). Drivers of households’ land-use decisions: A critical review of micro-level studies in tropical regions. Land, 5(4), 4. https://doi.org/10.3390/land5040032
- Hundera, K., Aerts, R., Fontaine, A., Van Mechelen, M., Gijbels, P., Honnay, O., & Muys, B. (2013). Effects of coffee management intensity on composition, structure, and regeneration status of Ethiopian moist evergreen afromontane forests. Environmental Management, 51(3), 801–809. https://doi.org/10.1007/s00267-012-9976-5
- Hylander, K., Nemomissa, S., Delrue, J., & Enkosa, W. (2013). Effects of coffee management on deforestation rates and forest integrity. Conservation Biology, 27(5), 1031–1040. https://doi.org/10.1111/cobi.12079
- Jassogne, L., Van Asten, P.J.A., Wanyama, I., & Baret, P.V. (2013). Perceptions and outlook on intercropping coffee with banana as an opportunity for smallholder coffee farmers in Uganda. International Journal of Agricultural Sustainability, 11(2), 144–158. https://doi.org/10.1080/14735903.2012.714576
- Jiang, H. (2003). Stories remote sensing images can tell: Integrating remote sensing analysis with ethnographic research in the study of cultural landscapes. Human Ecology, 31(2), 215–232. https://doi.org/10.1023/A:1023980713048
- Kassa, H., Dondeyne, S., Poesen, J., Frankl, A., & Nyssen, J. (2016). transition from forest-based to cereal-based agricultural systems : A review of the drivers of land use change and degradation in southwest ethiopia.Land Degradation and Development, 28(2), 431–449. https://doi.org/10.1002/idr.2575
- Kebede, A.S. (2018). Assessment of Land Use/Land Cover Change Using GIS and Remote Sensing Techniques : A Case Study of Dendi District, Oromiya Regional State, Ethiopia. Journal of Environment and Earth Science, 8(1), 123–128.
- Kebede, Y., Baudron, F., Bianchi, F.J.J.A., & Tittonell, P. (2019). Drivers, farmers ’ responses and landscape consequences of smallholder farming systems changes in southern Ethiopia. International Journal of Agricultural Sustainablity,17(6), 383–400. https://doi.org/10.1080/14735903.2019.1679000
- Kolios, S., & Stylios, C.D. (2013). Identification of land cover/land use changes in the greater area of the Preveza peninsula in Greece using Landsat satellite data. Applied Geography, 40(June 2013), 150–160. https://doi.org/10.1016/j.apgeog.2013.02.005
- Lambin, E.F., Geist, H., & Rindfuss, R.R. (2006). Introduction: Local processes with global impacts. In: Lambin,E.F and Geist,H.(eds)Land-use and Land-cover Change. Global Change- The IGBP Series. Berlin, Heidelberg: Springer. https://doi.org/10.1007/3-540-32202-7_1
- Lambin, E.F., Turner, B.L., Geist, H.J.,Agbola, S.B., Angelsen,A., Folke,C., ...Veldkamp,T.A.(2001). The causes of land-use and land-cover change : Moving beyond the myths.Global Environmental change. 11(4), 261–269. https://doi.org/10.1016/S0959-3780(01)00007-3
- Legesse, A., Teferi, B., & Baudouin, A. (2013). Indigenous agroforestry knowledge transmission and young people ’ s participation in agroforestry prac- tices : The case of Wonago Woreda. Acta Geographica:Trondheim...
- Meskela, T., & Teshome, Y. (2014). From economic vulnerability to sustainable livelihoods: The case of the Oromia coffee farmers cooperatives union (OCFCU) in Ethiopia. International Food and Agribusiness Management Review, 17, 103–108. https://doi.org/10.2139/ssrn.2400132
- Mihai, B., Savulescu, I., & Sandric, I. (2007). Change Detection Analysis (1986–2002) of Vegetation Cover in Romania. Mountain Research and Development, 27(3), 250–258. https://doi.org/10.1659/mred.0645
- Minten, B., Dereje, M., Engida, E., & Tamru, S. (2018). Tracking the Quality Premium of Certified Coffee: Evidence from Ethiopia. World Development, 101(January 2018), 119–132. https://doi.org/10.1016/j.worlddev.2017.08.010
- Negash, M. (2007). Trees management and livelihoods in gedeo’s agroforests, ethiopia. Forests Trees and Livelihoods, 17(2), 157–168. https://doi.org/10.1080/14728028.2007.9752591
- Nielsen, J.Ø., Friis, C., Nielsen, J.Ø., Otero, I., Haberl, H., Hostert, P., & Haberl, H. (2016). In land system science From teleconnection to telecoupling : Taking stock of an emerging framework in land system science. Journal of Land Use Science,11(2), 131–153 (November). https://doi.org/10.1080/1747423X.2015.1096423
- Nkonya, E., Pender, J., Kaizzi, K.C., Kato, E., Mugarura, S., & Ssali, H. (2008). Linkages between land management, land degradation, and poverty in sub-Saharan Africa: The case of Uganda. Research Report of the International Food Policy Research Institute. https://doi.org/10.2499/9780896291683RR159
- Pender, J., Place, F., & Ehui, S. (2006). Strategies for Sustainable Land Management in the East African Highlands: Conclusions and Implications. In:Pender,J., Place,F., Ehui,S.(eds) Strategies for Sustainable Land Management in the East African Highlands. International Food Policy Research Institute(IFPI): Washington D.C pp. 377–415.
- Ponte, S., & Gibbon, P. (2005). Quality standards, conventions and the governance of global value chains. Economy and Society, 34(1), 1–31. https://doi.org/10.1080/0308514042000329315
- Rahn, E., Liebig, T., Ghazoul, J., & Asten, P. (2018). Agriculture, Ecosystems and Environment Opportunities for sustainable intensi fi cation of co ff ee agro-ecosystems along an altitudinal gradient on Mt. Elgon, Uganda, 263 (February), 31–40. https//doi.org/ 10.1016/ j.dgree. 2018. 04.019
- Rueda, X., & Lambin, E.F. (2013). Linking Globalization to Local Land Uses : How Eco-Consumers and Gourmands are Changing the Colombian Coffee Landscapes. World Development, 41(1), 286–301. https://doi.org/10.1016/j.worlddev.2012.05.018
- Rwanga, S.S., & Ndambuki, J.M. (2017). Accuracy Assessment of Land Use/Land Cover Classification Using Remote Sensing and GIS. International Journal of Geosciences,08(04), 611-622.htpps://doi.org/10.4236/ijg.2017.84033
- Sarkar, A. (2018). Accuracy Assessment and Analysis of Land Use Land Cover Change Using Geoinformatics Technique in Raniganj Coalfield Area, India. Environmental Sciences & Natural Resources, 11(1), 555805. https://doi.org/10.19080/IJESNR.2018.10.555805
- Senbeta, F., & Denich, M. (2006). Effects of wild coffee management on species diversity in the Afromontane rainforests of Ethiopia. Forest Ecology and Management, 232(1–3), 68–74. https://doi.org/10.1016/j.foreco.2006.05.064
- Shrestha, M. (2000). Integrating Household and Community Data with Remote Sensing Applications to Detect Land-use and Land-cover Change in Lamjung, Nepal. NASA Earth Sciences System Conference,1619(706), 30602
- Woldu, Z., Belew, D., & Benti, T. (2015). :. The Coffee-Khat Interface in Eastern Ethiopia: A cotroversial land use and Livelihood Change Scenario. Journal of Agricultural Science and Technology, 5(B), 149–169. https://doi.org/10.17265/2161-6264/2015.03.001
- Wubie, M.A., Assen, M., & Nicolau, M.D. (2016). Patterns, causes and consequences of land use/cover dynamics in the Gumara watershed of lake Tana basin, Northwestern Ethiopia. Environmental Systems Research, 5(1), 1–12. https://doi.org/10.1186/s40068-016
- Yilma, T. (2001). Coffee-Ensete-Livestock interaction for sustainable livelihood in the Sidama area of southern Ethiopia. Journal of Agriculture in the Tropics and Subtropics, 102(2), 119–131.