
 ?Mathematical formulae have been encoded as MathML and are displayed in this HTML version using MathJax in order to improve their display. Uncheck the box to turn MathJax off. This feature requires Javascript. Click on a formula to zoom.
ABSTRACT
In China, land-use policy-making relies on spatial planning zoning based on land suitability assessments. Given the complexity of land resources, there is no universally agreed suitability assessment index system. Land-type research, which aims to map interactions among environmental components (e.g. landform, soil type, and land cover, etc.) can identify units with certain homogeneity of land characteristics, providing a unified framework for land suitability assessments. Combining multi-source data and geospatial analysis methods, we identified the agricultural land quality and urban functional areas as proxies for land-use intensities, and proposed a 1:100,000 hierarchical classification system, which integrated landform, soil type, land-use type, and land-use intensity. The land in Changzhou City was classified into 3 classes, 37 subclasses, and 137 land units. Comprehensive knowledge about the characteristics of land units further generated a qualitative land suitability analysis and village-scale spatial planning zones based on expert knowledge without an auxiliary suitability assessment index system.
1. Introduction
Land resources, the results of interactions between environmental components (e.g. climate, landform, soil, and land cover) and human activity (e.g. land use), provide basic energy for human survival (FAO, Citation1976). However, the unprecedented resource utilization during the past decades has caused severe environmental problems, which threaten human life (G. D. Li et al., Citation2018; Lambin et al., Citation2001; Lin et al., Citation2013). To promote sustainable development, land suitability assessment (LSA) research aims to determine the most appropriate land-use policy and avoid environmental conflicts, laying the basis for resource management (G. Li et al., Citation2017; X. Li et al., Citation2021; Mcdowell et al., Citation2018; Rossiter, Citation1996; Ullah & Mansourian, Citation2015; Vasu et al., Citation2018).
The division of the varied and continuous land surface into spatial units with different morphologies and functions (e.g. landform units and soil units) can provide a better understanding of resource characteristics and further support LSA and land management (Bailey et al., Citation1978; Sauer, Citation1921; Simensen et al., Citation2018). In the past few decades, land-cover/land-use classification has provided basic data for global environment change research (Lambin et al., Citation2001; Verburg et al., Citation2011), as well as a key parameter of land suitability assessment models (e.g. Mcdowell et al., Citation2018; Rodriguez-Gallego et al., Citation2012). However, land-cover has emphasized the physical environments (e.g. forest and open water), whereas land-use has focused on the utilization of land resources, thus simplifying land characteristics and failing to reveal the interactions between environmental components, such as relief, biotic community, and human activity (Ellis & Ramankutty, Citation2008). LSA research based on land-cover/land-use data needs auxiliary indices to represent land characteristics comprehensively, which increases the uncertainty of the study results (Baroudy, Citation2016; Xu & Zhang, Citation2013). Providing a system that comprehensively classifies and maps land characteristics is still a challenging task for effective land management (Demers, Citation2014; Verburg et al., Citation2011).
The multidisciplinary problem of land management is one of the major concerns of sustainable development research. As a result, international programs such as the Global Land Programme (GLP) have encouraged the integrated study of land sciences (Foley et al., Citation2005; Verburg et al., Citation2015). Integrated land research provides a new tool for land management by highlighting comprehensive knowledge of land characteristics, which embodies the complexity of the mutual impact of human activity and the physical environment (Fu & Pan, Citation2016; Fürst et al., Citation2013; Reed et al., Citation2017). To fill the gap between the highly generalized concept of zones and the detailed array of classes, such as soil series and land-use/land-cover types, integrated land research has proposed different terms, such as land-type (Lacate, Citation1961; Zhao, Citation1989), landscape (Mücher et al., Citation2010; Van Eetvelde & Antrop, Citation2009), and land system (Ornetsmüller et al., Citation2018; Van Asselen & Verburg, Citation2012). In particular, land-type research conducted by geographers divides the land surface into different spatial units with homogeneous physical components (e.g. landform, soil, and land cover) and related economic elements (e.g. agricultural production) (Lacate, Citation1961; Pienkowski et al., Citation1996; Wang et al., Citation2010). Compared with land-type research that focuses on geographic knowledge, land system research highlights the human use of land (Verburg et al., Citation2013), whereas landscape research focuses on geo-ecological characteristics (Simensen et al., Citation2018). Despite the subtle differences between land-type, landscape, and land system research, comprehensive knowledge on homogeneous land characteristics, provided by integrated land research, which represents land suitability to some degree, can further support land-use policy-making. In China, LSA and land-use planning research conducted by geographers have established the importance of land-type research, which emphasizes geographic knowledge, for land management and sustainable development (H. Liu et al., Citation2019).
To date, researchers have proposed land classification systems, focusing on different components such as soil characteristics in the United Kingdom and Australia (as cited in Lacate, Citation1961), morphologies of the land surface in the USSR (e.g. Prokayev, Citation1962) and Germany (as cited in Simensen et al., Citation2018), as well as current land-use intensity (Erb et al., Citation2013; Verburg et al., Citation2013). It is generally acknowledged that the interactions between physical components and human activity shape the appearances and characteristics of land at all scales (Mücher et al., Citation2010; Rowe & Sheard, Citation1981). Thus, hierarchical classification systems have been generalized using the following propositions: (1) Level 1 units represent the most generalized knowledge with similar climatic conditions, including rainfall and temperature, and are suitable for macroscale research; (2) Level 2 units further classify Level 1 units according to large and medium landforms and soils, because these factors redistribute rainfall and temperature conditions in a smaller region; and (3) Level 3 units are basic units with relatively consistent micro-landforms, soil varieties, and land-use potentials (Ni, Citation2009). Levels in hierarchical classification systems indicate the importance of classification factors in determining land characteristics at different scales (e.g. landforms are often used as land mapping units in 1:25,000 to 1:500,000 scales, whereas soil types are better for a smaller region) (Rowe, Citation1961; Van Niekerk, Citation2010). In addition to physical components, increasing input (e.g. labor and technology) in resource utilization negatively impacts the environment quality (Erb et al., Citation2013). Therefore, identifying the differences in land-use potential and intensity at the same level is another component of classification research relevant for understanding the human–land relationship (Ni, Citation2009; Rega et al., Citation2020). Great efforts have been devoted recently to developing indicators of land-use intensity as proxies for human activity (e.g. nitrogen input, Levers et al., Citation2018; livestock density, Van Asselen & Verburg, Citation2012; crop yield; Tieskens et al., Citation2017). Although disputes still exist in the land classification system construction, land-type research that represents land characteristics in a more integrated manner shows great potential in land suitability assessment.
Integrated land research has supported land surveys and planning in Europe (Mücher et al., Citation2010; Smiraglia et al., Citation2013), Australia (Mabbutt, Citation1988), and North America (as cited in Lacate, Citation1961) to promote sustainable development. In China, mesoscale research needs to be conducted because it can be directly used in land-use practice (Cai et al., Citation2009). One basic tool for mesoscale land management is spatial planning zoning, which divides the land surface into different zones (generalized based on spatial units) and further stipulates land-use policy according to land suitability (Rossi, Citation2004). In practice, the spatial planning zone forms the blueprint of regional resources protection and utilization. Although the Chinese national standard of land-type research constructed a classification system by combining climate type, landform type, soil type, and land cover (Zhao, Citation1989), it weakened the understanding of the effects of human activity on the environment. Therefore, the existing land-type research results are not suitable for current land-use planning research in China. As the differences between classification systems are rooted in different theories and heterogeneity of land resources, it is difficult to apply the existing classification systems to China. Considering that subtle changes in land-use practices have important consequences on the environment (Verburg et al., Citation2011), a classification system that combines the national standard of China’s land-type research and land-use intensity, which can be represented by the output of land resource utilization, is necessary.
To determine the most appropriate land use and identify spatial planning zones with different land-use policies at the mesoscale, the objectives of this study are the following. First, constructing a 1:100,000 classification system integrating physical components (landform type and soil type) and human-related components (land-use type and land-use intensity), which could be applied to agricultural and urban management in China’s humid climate zone. Second, conducting a land suitability assessment and a spatial planning zoning map at the village-scale in Changzhou by combining land-type and expert knowledge, which can be applied to land-use policy-making in China. This study is an attempt to develop land-type research in China by focusing on both physical environmental components and human activity, and to explore the potential use of the land-type theory on land management.
2. Study area and data processing
2.1 Overview of the study area
Changzhou City (hereafter ‘Changzhou’; 31°09–32°04 N, 119°08–120°12E) is located in East China and has a northern subtropical monsoon climate. Most of Changzhou’s area is located in Taihu Plain, with a relatively low elevation, whereas few areas of high elevation are in the south and west. Various soil types such as paddy soil, yellow-brown soil, and medium loam were formed from different parent materials (). Superior water and heat conditions and good soil fertility allow Changzhou to have a variety of land-use types. According to the land-use data acquired from the Changzhou Bureau of Land and Resources ( and )), Changzhou has a total area of 4372 km2. In 2015, agricultural land (farmland, gardens, land used for transportation, and water conservation facilities providing auxiliary agricultural production) covered an area of 2542 km2, accounting for 58% of the city’ total area. Built-up land has an area of 1141 km2, accounting for 26% of the total area. Forestry has an area of 189 km2, and the Natural Reserve (unutilized land) covers an area of 18 km2. Various land-use types in Changzhou have formed various and interacted urban, agricultural, and ecological systems.
Table 1. Sources and main uses of data used in this study
Figure 1. Study area and spatial distribution of different types of data used in this research: (a) land use, (b) spatial location, (c) elevation, (d) soil type, (e) farmland quality, and (f) point of interest (POI). Note. PSO: paddy soil; BLPSO: bleached paddy soil; PPSO: percogenic paddy soil; DPSO: degleyed paddy soil; ML: medium loam; BRRSO: brown-red soil; RSO: red soil; ALLSO: alluvial soil; YCSO: yellow-cinnamon soil; CLPYCSO: clay pan yellow-cinnamon soil; FLAGUSO: fluvo-aquic soil; BSO: bog soil; YBOSO: yellow-brown soil; ACSKSO: acid skeletal soil; SKSO: skeletal soil; TF: terra fusca.
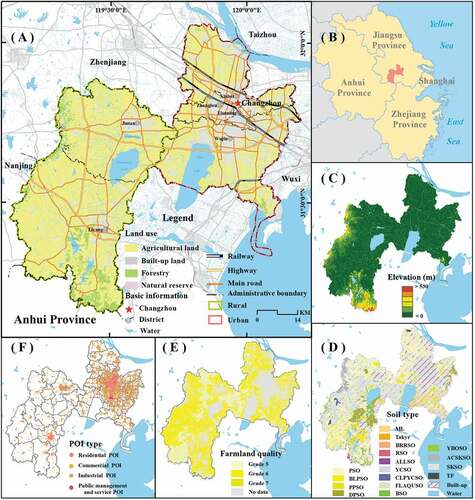
Located in the Yangtze River Delta – one of the most developed areas of China – the labor, technology, and transportation conditions in Changzhou are excellent for the economic development. Owing to the different land-use policies, Changzhou can be divided into two parts, namely, a concentrated urban landscape (urban) and a predominantly agricultural landscape (rural) (). The conflict between urban development and farmland protection in Changzhou is prominent, as is the case with most cities in China. Cities like Changzhou must conduct integrated land research to determine a reasonable land-use policy and further alleviate the negative effects of human activity on agriculture and the ecosystem. Therefore, land-type research in Changzhou provides a good opportunity to develop China’s national standard of land-type research from macroscale to mesoscale and promote the land-type theory research to be applied to land management.
2.2 Data sources and preprocessing
This study used two datasets. One dataset consisted of the data used for classification and included digital line graphic, soil, land-use type, and points of interest (POI) data. The other dataset comprised verification data for accuracy analyses. All data used in this study are listed in ().
3. Methods
Land classification is a generalization process that simplifies land characteristics to make them suitable for communication in management research (Bunce et al., Citation1996b; Simensen et al., Citation2018). Different land classification methods have been developed, such as prior knowledge (Rowe & Sheard, Citation1981), index-based (Bunce et al., Citation1996a), and image recognition methods (Wang et al., Citation2010). In general, the index-based method uses multiple indices (e.g. elevation, aspect, and number of separate buildings) to describe environmental components, and the image recognition method is based on remote sensing classification algorithms. However, there is no consensus on the algorithms to be utilized for the construction of indicator systems and thresholds of classification. The prior knowledge method, which always constructs a decision tree using expert knowledge or field measurements, can reveal land characteristics properly (Sicat et al., Citation2005; Van der Zanden et al., Citation2016). According to the prior knowledge of land classification theories, the homogeneity of land varies depending on the research scale (Ni, Citation2009; Van Niekerk, Citation2010). Therefore, hierarchical classification systems need to be constructed to highlight the role of dominant factors at different levels based on local conditions (Zhao, Citation1989).
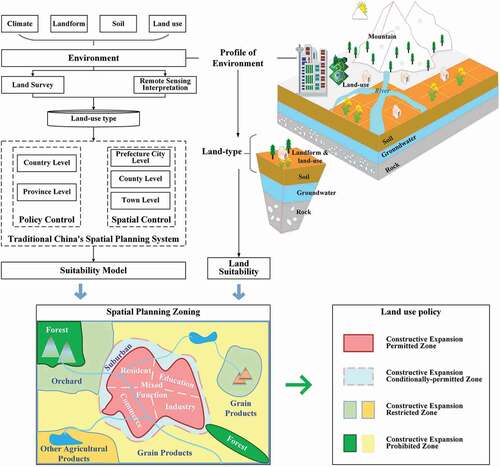
In this study, factors in the hierarchical classification system were chosen according to their influence on the differentiation of land characteristics at different scales (). In general, physical components such as climate type and landform affect the basic conditions of life at the macroscale. Human activity has a relatively subtle impact on physical components on a small scale. To reveal the human–land relationship, this study updated the classification system of the national standard of China by incorporating the categories of land-use type and land-use intensity, which were used as proxies for human activity. Because climate conditions are relatively consistent in Changzhou, the hierarchical classification system in this study included landform type, soil type, land-use type, and land-use intensity (). Similar to the national standard of China, the hierarchical classification system in this study has three levels. Landform and soil emerged as relatively stable and independent factors, whereas land-use and land-use intensity were relatively dependent in nature. Changes in independent components inevitably evoke reactions in dependent ones (Mücher et al., Citation2010). Therefore, landform and soil types determined the first two levels of classification units, whereas land-use types and land-use intensity determined the third level. Units at different levels were all called land-types.
Figure 2. Technological flow of land-type classifications and spatial planning zoning.
The factor in the classification system was represented by separate datasets. The landform type, soil type, and land-use type classification references are consistent with the national standards of China (). Urban functional areas and agricultural land quality (in terms of the ‘Regulation for Gradation on Agriculture Land Quality,’ which consists of 15 grades, with Grade 1 denoting the highest quality) were used as proxies for land-use intensity ().
3.1 Hierarchy of classification system
3.1.1 Land class (level 1)
A step-by-step division strategy was adopted, and the land class was identified based on landforms. The landform is often the main physical factor responsible for differences in soil, vegetation, and land-use types (Macmillan & Shary, Citation2009). Therefore, level 1 units were classified according to landforms named land class.
3.1.2 Land subclass (level 2)
Soil types and the landform types jointly generated the level 2 units. Soil is an important resource formed by the interplay between biological, climatic, geological, terrain-related, and temporal factors (Rowe, Citation1962). Soil supports the growth of plants and animals, thereby directly affecting land use. Therefore, this study further classified land classes into different subclasses based on soil types. A land subclass comprised areas within which predictable combinations of landforms and associated soils occurred.
3.1.3 Land unit (Level 3)
Land-use types, intensities, and subclasses were integrated to classify land units. Land units vary even within the same land subclass, owing to differences in vegetation cover and the intensity of human activity, which affect the environmental evolution (Van Asselen & Verburg, Citation2012). To ensure that land units adequately reflect the human–land relationship, land-use types, and land-use intensity were used as proxies for human activity. A land unit was defined as the areas in which the physical characteristics of land and human activity patterns were similar. Research on patterns of land units is the basis for land suitability (Smiraglia et al., Citation2013; Zonneveld, Citation1989).
3.2 Factors in the classification system
3.2.1 Landform
The national standard of landform classification in China has been widely used; it is based on terrain factors derived from digital elevation models (W. Cheng et al., Citation2011). According to the standard classification system, this study also used a multi-scale segmentation algorithm (Laliberte & Rango, Citation2009) and terrain factors to classify the land classes in Changzhou (W. Cheng et al., Citation2011). The multi-scale segmentation algorithm is a bottom-up regional fusion process starting at the pixel level. Pixels are gradually merged into large image objects (polygons) to generate segmented results at different scales based on homogeneity. Areas with abrupt changes in slope mostly indicate the boundaries of different landforms (Van Niekerk, Citation2010). This study combined the multi-scale segmentation algorithm and the rate of change in slopes to segment the whole area into polygons. Based on the spatial relationship, each polygon obtained values of terrain factors. The basic landforms in Changzhou were classified by comparing the relationship of the relief and elevation extremes in each segmented polygon with the thresholds in W. Cheng et al. (Citation2011). The terrain factors () were calculated using ArcGIS 10.1. In addition, the eCognition 9.0 software was used to perform multi-scale segmentation.
Table 2. Terrain factors and their mathematical expressions
The ability of terrain factors to describe landform types is significantly affected by analytical scales which represent the size of the neighborhood in raster statistics (Drăguţ & Eisank, Citation2011). To explore the optimal scales for terrain factors analysis, the mean change-point method was used (Wang & Lv, Citation2009). The mean relief values of different neighborhoods were calculated based on raster statistics, and an ordered sequence was formed, where k= 1, 2 … N; N was the number of samples (total number of different neighborhoods in raster statistics). For each k value, where k ≥ 2, which was related to the size of neighborhoods, the sequence was divided into two parts: x1,x2, …xk-1, and xk,xk+1, … xn. The arithmetic means
and
of each part of the sample and the arithmetic mean
of all the samples were then calculated:
where Sk is the difference in the squared deviations of the mean between the two sample parts, and S is the squared deviation of the mean of all samples. Given the existence of change points in the dataset, the difference between S and Sk increased gradually. The maximum difference was the optimal scale for the calculation (Wang & Lv, Citation2009).
3.2.2 Soil type
A vector layer of soil subtype in Changzhou was acquired (). Chinese soil taxonomy, which is a national standard classification system, was applied to the soil classification of the data (Shi et al., Citation2006).
3.2.3 Land-use type and intensity
Land-use data () were acquired following the national standard for land use classification in China (China’s national standard, Citation2007). Moreover, this study classified the utilization intensity of agricultural land and built-up land, as human activity directly influences land-use types.
3.2.3.1 Agricultural land quality
Land productivity research is the basis of land resource management (L. Liu et al., Citation2015). Classification data on agricultural land used in this study were obtained through the differential assessment of the natural production potential of the land (under natural light and temperature conditions) and the production capacity after anthropogenic effects, under the ‘Regulation for Gradation on Agriculture Land Quality’ (Ministry of Land and Resources of the People’s Republic of China (MLRPRC), Citation2012). This system scored nine factors (soil texture, thickness of plowed layer, soil organic matter, pH, irrigation rate, drainage conditions, soil salinization degree, depth of soil barrier layer, and degree of soil erosion) based on the analytic hierarchy process method to evaluate the farmland quality (Vaidya & Kumar, Citation2006). The scores are proportional to land productivity (Ministry of Land and Resources of the People’s Republic of China (MLRPRC), Citation2012). In this study, agricultural land included farmland and gardens, among others; however, the database only contained farmland quality evaluation results. Thus, the quality grades of agricultural land were obtained by extracting the gravity centers of farmland patches and constructing a Voronoi diagram that covered the entire area (). Using the overlay function, every unit of agricultural land obtained an attribute of farmland quality.
3.2.3.2 Urban functional area
The expansion of built-up land is considered a cause of environmental damage (Weng, Citation2012). Thus, the classification of urban functional areas is critical to ensure that classification results can be used for research on human activity. Based on POI data, studies have identified functional areas at the block scale, thereby improving the scientific soundness of urban planning (Niu et al., Citation2017). Therefore, this study used a POI dataset to delineate the functional areas of built-up land in Changzhou at the block scale to distinguish differences in the intensity of human activity. However, different types of POI have different influence ranges. Point pattern analyses were used to weaken the effect of parameter setting on the analysis results (Zhang et al., Citation2016).
This study used Ripley’s K-function to explore the distribution patterns of POIs at different search radii; further, to determine whether each type of POI had a cluster feature, significant clustering distances were acquired. These distances represented the influence ranges of different POIs. The Kernel density estimation was used to convert different types of POI into spatially continuous density data based on the significant clustering distances calculated by Ripley’s K-function. Given the different numbers of POIs, the continuous density data were converted into rating data based on a K-means clustering function to render the results comparable (). Ripley’s K-function and kernel density estimation were implemented using ArcGIS 10.1, and K-means clustering was performed in MATLAB R2010b.
Ripley’s K-function was used to investigate the spatial distribution patterns of given elements under multiple distance thresholds and analyze changes in spatial aggregation or diffusion patterns of the gravity centers with changing neighborhood size. Thus, the problems of (1) statistical methods being less sensitive to distribution models; and (2) statistical models of spatial autocorrelation indices being dependent on scales, could be avoided. In particular, using Ripley’s K-function to explore the spatial distance that resulted in the most significant clustering of POIs with different functions could be avoided (Zhang et al., Citation2016):
where D is the search radius; n is the total number of elements; A is the total area of the elements; and k is the weight. When the distance between i and j is smaller than D, k is equal to 1; otherwise, k is equal to 0. Using the most significant clustering distance as the threshold, a distance matrix was generated for the sample points, and the average of the matrix elements was used as the diameter for kernel density estimation to weaken the effects of the maximum and minimum distances on subsequent calculations.
Kernel density estimation was conducted by analyzing the spatial distribution of the objects, which required calculating the sample density in the study region. The kernel density Pi, at any point in space, was described by a function whose value decreased as its distance from the center point increased and was defined as 0 when the distance exceeded the search radius. The volume between the kernel function (in the analysis window) and the coordinate axis was defined as the kernel density of the center point. The density of the resulting grid was the sum of the surface values of all functions superimposed at that point. Pi was calculated as follows (Sheather & Jones, Citation1991)
where Kj is the weight of the research object j; Dij is the distance between spatial points i and j; R is the search radius (Dij<R); and n is the number of research objects j within the search radius R.
K-means clustering was performed based on the following principles. If X was the expected number of classes, cluster centers that represented the different categories were randomly selected in the dataset. The distances between cluster centers and each object in the dataset were calculated, and the object was assigned to the nearest cluster center. Repeating this procedure, cluster centers were adjusted to ensure that the distance between the cluster center and objects in a certain category was minimized, and results were generated until the cluster centers discontinued changing (Hartigan & Wong, Citation1979). This study used the K-means clustering algorithm based on the results of kernel density estimates and differences in the densities of different types of POI to divide industrial, commercial, and residential areas into regions with different degrees of aggregation (high-, medium-, and low-density). These results represent differences in land-use intensity within the same land-use type.
Road networks in Changzhou divide the city into different street blocks. This study adhered to the following principles when dividing urban functional areas in each street block: (1) checking for public management and service POIs in each block (e.g. university campuses, government buildings, or transport infrastructure) and categorizing the street blocks with such POIs as public management and service areas (since the number of such POIs differed from that of others, the spatial density of this type was not analyzed); (2) defining areas with a high combined aggregation of residential, commercial, and industrial activities (medium- and high-density areas in the clustering analysis results) as mixed-function areas; (3) classifying the remaining areas as functional areas with the highest level of clustering; (4) classifying areas combined with low-density clusters of commercial, industrial, and residential activity as functional areas with the highest number of POIs; and (5) classifying areas not included in any of the abovementioned areas as rural built-up land. Using the overlay function, every unit of built-up land received an attribute of urban function.
3.3 Validation analyses
3.3.1 Reference layer verification
Considering that a factor in the classification system was represented by separate datasets, each factor could be verified with a reference layer which was an available online dataset (). Each factor and its reference layer were generated using different methods, but they were positively correlated, or even represented the same environmental component. Soil and land-use types were obtained from field measurements and thus did not need to be verified. Although the Digital Line Graph (DLG) () data were generated using field measurements, the conversion between DLG and the Digital Elevation Model (DEM) might still increase the likelihood of errors. Therefore, the landform classification verification was based on the contour developed by a 30 × 30 m GDEM (). Similarly, land-use intensity classification results were also verified based on reference layers in this study.
3.3.1.1 Landform
Contours generated from GDEM in Changzhou divided the city into different parts with different elevations according to W. Cheng et al. (Citation2011). Using overlay analyses, the degree of similarity between the classification results and areas divided by contours was generated.
3.3.1.2 Agricultural land quality
The quality of the agricultural land classified in this study was a vector unit. Based on the spatial relationship, each vector unit was assigned a potential crop yield value to verify whether high-quality agricultural land corresponded to high potential yield ().
3.3.1.3 Urban functional area
Based on the Open Street Map (OSM) data (), the classification result was correct if a certain urban function in OSM was the same as the classification results, or whether the data in OSM corresponded to the mixed-function area in the classification results.
3.3.2 Typical land-type point verification
A typical land-type point contained landform, soil, land use, and land-use intensity attributes based on field surveys. Land value points provided precise urban function data (). Therefore, typical urban land-type points were collected by supplementing the land value points with landform, soil, and land-use type. Moreover, typical agricultural land-type points based on grain yield surveys were collected (). The accuracy of the classification results was verified by comparing each attribute in land units and typical land-type points.
3.4 Spatial planning zoning
Spatial planning zones are determined by the dominant land suitability, which indicates that they cover a much larger area than the land evaluation unit (level 3). In China, urban planning and land-use planning are the main ways for municipal governments to implement land-use policies, which provide a blueprint of regional resources protection and utilization. Existing urban planning (2010–2020) defined three spatial planning zones: suitable construction zones (areas dominated by built-up land, with urban development being the major land-use policy in the future), constructive expansion restricted zones (areas dominated by agriculture activity, with agricultural development being the major land-use policy in the future), and constructive expansion prohibited zones (areas where human activity is strictly prohibited, thus ensuring grain and ecological security). Land-use planning (2006–2020) defined four spatial planning zones: constructive expansion permitted zones (similar to suitable construction zones), constructive expansion conditionally permitted zones (areas dominated by agriculture activity, with moderate urban development being permitted in the future), constructive expansion restricted zones, and constructive expansion prohibited zones (). The two systems both require land surveys and land suitability assessments to provide reliable knowledge of land characteristics and support land-use policy-making.
Figure 3. Differences between land zoning based on land-types and spatial planning systems.
Although land suitability assessment research always needs an auxiliary system to score the resource quality and its potential use, land units which include the basic types of landforms, soil, and land use, can reflect land suitability to some degree. Moreover, the landform, soil, and agricultural quality classification systems in this study have integrated different indicators which can be used as proxies for land suitability assessment (W. Cheng et al., Citation2011; Ministry of Land and Resources of the People’s Republic of China (MLRPRC), Citation2012; Shi et al., Citation2006). Based on the comprehensive knowledge provided by the land unit, this study generated spatial planning zones based on a qualitative analysis (), which has been used in research of the Jiangsu province (Gao et al., Citation2020). To ensure that spatial planning zones can assist in land management, the boundaries of the zones were consistent with the village boundaries of Changzhou. In each village, the spatial planning zone was first determined by the dominant land suitability. If the zones were defined as ‘urban-town,’ but the proportion of urban land-type area was less than 60% of the total village area, these zones were modified to be ‘rural-town.’ Combining the existed spatial planning zone system and land-types, this study elaborates on the main function of land resources in spatial planning zones ().
Table 3. Generalization rules of land suitability based on land-types
4. Results
4.1 Land-types in Changzhou
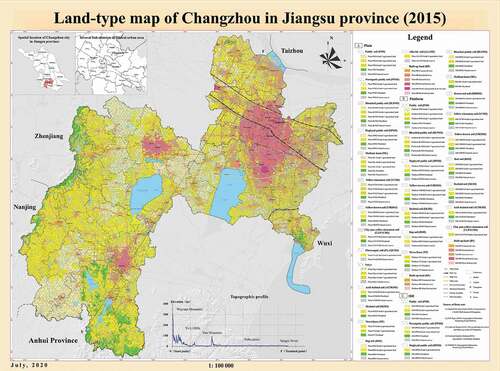
This study used a landform–soil–land-use intensity–land-use type approach to name classification results (). In particular, the terms ‘land-use intensity’ and ‘land-use type’ jointly connote land units (level 3). The naming scheme highlights the hierarchical structure of the classification system. The results showed that Changzhou had a variety of land-types consisting of three land classes, namely plains, platforms, and hills, which were all considered level 1 units consisting of level 2 units. These, in turn, comprised 37 land subclasses, such as plain paddy, plain fluvo-aquic, and plain skeletal soils. The subclasses were further divided into 137 land units (level 3) (). Plains were the main landform type and were distributed mainly in northern and central Changzhou. Platforms and hills were scattered in western and southeastern Changzhou (the Appendix reports detailed landform classification results). Moreover, mixed-function built-up land was located in the city center, whereas commercial and residential built-up lands were distributed around them (please see Appendix for detailed urban functional area classification results). Industrial built-up land was distributed on the urban periphery, and rural built-up land was sporadically distributed ().
Figure 4. Land-type map of Changzhou City (detailed information of legend is showed in the Appendix).
4.2 Comprehensive knowledge about land resources
4.2.1 The landform is an important factor in the formation of human-related geographic patterns
Plains are the dominant landform, and human activity is concentrated on these plains in Changzhou ()). In particular, built-up land is aggregated in the plains ()). Moreover, most of the agricultural land dominated by human activity is concentrated in the plains. The hills restricted human activity owing to their high elevation, thereby forming a physical geographic landscape dominated by forestry (). Hilly forestry accounted for more than 90% of all forestry in the region. In contrast, human activity in the form of built-up land in hilly areas was relatively small ()).
Figure 5. Proportions of land-types in Changzhou City. (a) Proportion of Level 2 land-types. (b) Proportion of land-use types. (c) Agricultural land quality of different soil types. (d) Proportion of urban functional areas in different buffer areas.
4.2.2 Combined landforms and soil types determine the spatial pattern of agricultural production
The spatial distribution of agricultural land-types was highly consistent with that of landforms (). In addition, soil conditions affected the intensity of agricultural development. High-quality agricultural land was generally located in fertile soils, such as paddy and yellow-brown soils (). For example, agricultural land with paddy soil is the dominant agricultural land-types in Changzhou, almost all of them are Grade 5 and Grade 6 agricultural land, which indicates a good agricultural land quality ()). Therefore, good landform and soil conditions made Changzhou suitable for crop farming. As such, agricultural land was the dominant land-type in Changzhou ().
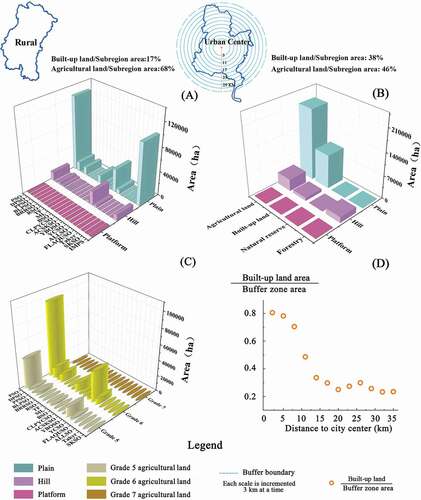
4.2.3 Good natural conditions were conducive to human economic and domestic life. However, different land-use policies resulted in different land units
Urban development intensity (defined as the proportion of built-up to total land area) in the urban sub-region was as high as 38%, and agricultural land accounted for 46% of this sub-region. In contrast, agricultural land was the most significant land-types in the rural sub-region, accounting for more than 68% of the sub-region area (). In the urban sub-region, the agricultural land-types were fragmented by built-up land. However, in the rural sub-region, the urban land-types had a scattered distribution, whereas agricultural land units had a greater aggregation degree ().
4.2.4 Built-up land in the urban sub-region exhibited a stratified structure ()
Based on the buffer analyses, the urban area of Changzhou was classified into different ring areas according to their distance from the geometric urban center (). Built-up land was concentrated in the city center and the relative area of built-up land decreased outward from the urban center, from 80% in the city center, to 23% at a distance of 35 km ()). This indicated that urban development in Changzhou has a concentric circle pattern (). Moreover, the decreasing tendency is disrupted in areas 29 km away from the city center, which indicates that these areas form the subcenter of Changzhou. According to (), the urban function of areas 29 km away from the city center is industrial production. Therefore, industrial production is an important driving force for the urban development of Changzhou.
4.3 Spatial planning zones
Spatial planning zones based on the analysis of comprehensive knowledge about land resources in Changzhou provide a guideline for future resources utilization policy. Low topographic relief and good soil conditions demonstrated that Changzhou’s land resource is suitable for cultivation (). These areas constitute grain product zones, which should be strictly protected to ensure the city’s food security. Although a small amount of land with high topographic relief in the west and south is not conducive to grain products, the altitude is not high. Furthermore, the high-density river network contributes to other agricultural activities such as cash crops and orchards. It is important to avoid soil erosion in these areas during agricultural activities.
Figure 6. Spatial planning zoning map of Changzhou City.
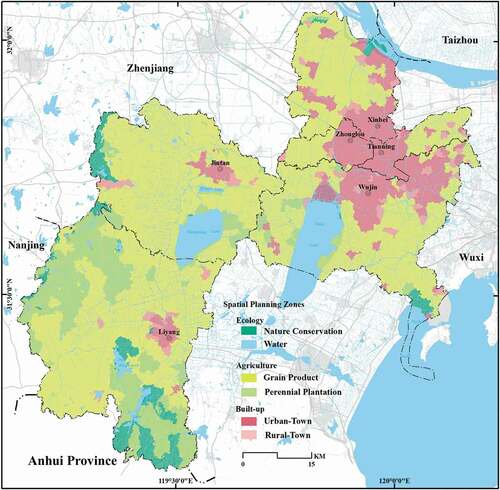
Good agricultural conditions attracted a large number of residents and have formed one city center and two secondary centers in the western and southern areas (). These areas require systematic urban planning to improve the resource utilization efficiency. Moreover, rural-town villages near urban-towns are core areas in which the disorderly expansion of built-up land frequently occurs (). Therefore, much attention should be paid to relieving human–land conflicts. Rural-town villages that are far from city centers are small towns, in which the number of residents is larger than the neighborhood. It is important to promote fair resource allocation by improving transportation, education, and other infrastructures.
The relatively high altitude and barren soil are suitable for forestry, which is the dominant landscape, and it is less affected by human activity. Ecological zones in Changzhou are located in hills in the western and southern parts (). Although the area of ecological land units in Changzhou is relatively small, the high density of rivers and green corridors along the river connect forestry and lake ecosystems. These areas ensure ecological safety and, thus, human activity is not allowed.
4.4 Validation analyses
Using reference layers, the landform and land-use intensity classification results proposed in this study were verified ( and ). Compared with the reference layer of contours, the overall accuracy of the landform classification results exceeded 90% (the data with the green shadow in () was considered to be correct results). According to (), the flat areas near high-altitude areas were misclassified, which lowered the classification accuracy. Moreover, Grade 5 agricultural land units, which had high production, corresponded to the highest potential crop yield, whereas Grade 7 agricultural land corresponded to the lowest values ()). As to urban functional areas ()), the agreement between the classification results and OSM was relatively high (the lowest classification accuracy near 70%, whereas the agreement of most classification results was 80%). Although the area of different urban functional areas in OSM data was relatively small, it covered areas where human activity clustered ()).
Figure 7. Accuracy of land-types. (a) Accuracy of landform classification. (b) Accuracy of agricultural land quality. (c) Accuracy of urban functional areas. (d) Accuracy assessment based on typical land-type points.
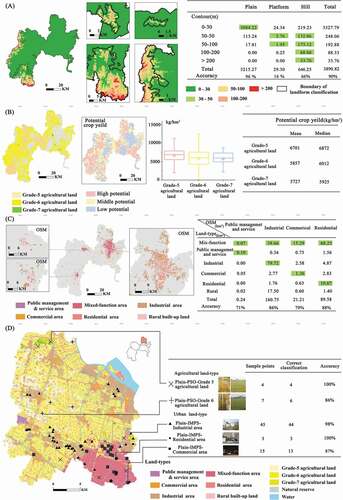
Another alternative to validate the classification results was to use place-based case studies to verify the classification results with typical land-type points containing detailed information on landform, soil, land-use, and land production potential (or urban functional areas). ()) indicates that the classification results were highly accurate, which could fulfill the study’s objective in demonstrating that land-types provide comprehensive knowledge about land resources.
5. Discussion
By identifying the interactions between the environment and human activity, integrated land research provides a framework to simultaneously simulate the modifications of land-cover/land-use as well as land-use intensity (Ellis & Ramankutty, Citation2008; Ramos et al., Citation2016; Van Asselen & Verburg, Citation2012). In Europe, the research shows advantages in land evaluation and management (Mücher et al., Citation2010). In China, the national standard focuses on physical components (e.g. landform, soil, and land cover) (Zhao, Citation1989), which underestimates the effect of human activity on the environment. Therefore, constructing a classification system suitable for China’s land resources management is still a challenging task. Moreover, promoting the application of land classification results to land-use planning is also the core content of land research in China.
5.1 Advantages of the land classification system
One objective of this paper is to propose a classification system by integrating landform, soil type, land-use type, and land-use intensity at the mesoscale. Compared with current landscape research focusing on ecological characteristics (e.g. Mücher et al., Citation2010) and land system research highlighting human-related factors (e.g. Van Asselen & Verburg, Citation2012), this study emphasizes geographic knowledge, which is the basis of sustainable development in China (H. Liu et al., Citation2019). Compared with the national standard of China (Zhao, Citation1989), this classification system involved land-use type and land-use intensity to provide a framework for analyses of interactions between the environment and human activity (). Factors, such as landform, soil type, and land-use intensity (agricultural land quality and urban functional areas) are stable. For example, agricultural land quality, which indicates the production of land, is a general characteristic based on many years’ statistics rather than a transient state (e.g. nitrogen input). Therefore, classification results reveal general land suitability, rather than suitability for one specific objective. These characteristics ensure that land-type research is more suitable for multidisciplinary problem research.
5.2 Advantages of the classification method based on prior knowledge
The proposed classification system was based on prior knowledge about the impact of environmental components on shaping different appearances and functions of land at different scales (Mabbutt, Citation1988; Van der Zanden et al., Citation2016; Zhao, Citation1989). Compared with the index-based method (e.g. Ellis & Ramankutty, Citation2008; Ornetsmüller et al., Citation2018), the knowledge-based method has the advantage of a transparent classification system with clearly interpretable emerging classes (Van der Zanden et al., Citation2016). Moreover, the proposed classification system included one factor at each level rather than multiple factors as in previous studies (e.g. Bunce et al., Citation1996b). This ensures the scalability of the classification system because level 1 units always control level 2 units. For example, land units (level 3) could be generalized into subclasses (level 2) based on the attributes of soil type. Therefore, the classification results could be compared with those of other studies (e.g. soil classification). Although results based on prior knowledge were affected by the subjectivity of the researchers, the results cannot be worse than those based on index-based methods (Rega et al., Citation2020). The index-based method can exclude personal judgment in the classification process to some degree, but the selection of factors in the classification system is still based on prior knowledge (Rowe & Sheard, Citation1981). Therefore, a classification system based on prior knowledge does not need to limit the potential use.
An advantage of integrating different components based on the overlay function is that the label of a land unit indicates the land suitability to some degree. For example, a land unit named ‘Plain-Paddy soil-Grade 7 agricultural land’ has a flat terrain with good soil conditions. These two land characteristics indicate good agricultural quality. However, Grade 7, which is the lowest quality agricultural land in Changzhou, indicates that human activity has a negative effect on the physical environment of this unit.
5.3 Uncertainty of the land classification results
The quality of input data limits the accuracy of the results (Verburg et al., Citation2011). Unfortunately, it is difficult to conduct accuracy analyses of vector land units similar to pixel-based research (Demers, Citation2014). Heterogeneity in the environment, study scales, and data availability have resulted in different classification systems (Ornetsmüller et al., Citation2018), and it is difficult to compare the classification results with those of other studies. In light of these difficulties, this study provides an alternative method of validating the analysis of classification results. According to (), the lowest accuracy lies in the platforms and hill classification. This is caused by the mean-change point analysis, which is a raster-based method. The results of the landform classification were calculated by considering a nine-raster neighborhood such that the flat areas near the platforms and hills were merged into these two parts. It did not influence the overall accuracy of the classification results, as the validation analyses indicated that the classification correctly reveals the land characteristics (). Therefore, the classification results fulfilled the study’s objective.
Although the input data in this study is of high quality, integrating data from different dates may lead to uncertainty in the classification results. Owing to the evolution of landform, soil type, urban functional area, and agricultural land quality requires a longer time than land-use type, land-use types need to be updated annually to ensure land-types provide latest land characteristics. Land units in this study can reveal comprehensive knowledge about land characteristics in 2015, which is consistent with the timeliness of the land-use dataset (). Unfortunately, further validation could not be conducted due to the lack of detailed data. This study is only a preliminary exploration of the classification of mesoscale land-types, and the applicability of the classification system in this study has not yet been verified at other scales. No single correct method or classification can be applied to all conditions (Simensen et al., Citation2018). Therefore, the classification system in this study could not replace any existing research results but provides a framework for analyzing land-use suitability.
5.4 Spatial planning zoning based on land-types
The current spatial planning in China aims to establish a unified system to promote sustainable development by combining existing planning, such as the regional development planning, land-use planning, urban planning, and eco-environmental protection planning. Three zones are the basis of spatial planning in China: ecological conservation redline, permanently prime farmland, and urban growth boundary. These zones need to integrate accurate spatial position, land suitability, and strict protection policies to ensure ecological and food safety and improve the development quality. However, land suitability, which is the basis of spatial planning zoning in existing planning systems, is only performed as non-mandatory knowledge. These characteristics challenge the scientific nature of planning. Although strict protection policies have been applied to farmland, high-quality farmland with good physical conditions has been moved to areas with high topographic relief over the past decades in China (L. Cheng et al., Citation2015). The mismatch between the quantity and quality of resources has caused great difficulties for China’s land management.
The land-types proposed in this study were similar in terms of land resource utilization potential, thus enabling the creation of a land suitability assessment () and a spatial planning zoning map (), which are important for land management in China (Cai et al., Citation2009). Compared with existing land suitability assessment research that evaluates the quality of each physical component separately (e.g. Baroudy, Citation2016; Ullah & Mansourian, Citation2015), land units (level 3) provide a unified framework for LSA research. Land units are clear boundaries of landform, soil, or land use, which can relieve the mixed-pixel problem research caused by regular grid statistics in existing LSA (X. Li et al., Citation2021). Moreover, comprehensive knowledge provided by land units supports prior knowledge-based generalization rules of spatial planning zoning (Gao et al., Citation2020). This characteristic lowers the uncertainty caused by using different factors in LSA research (Xu & Zhang, Citation2013). Therefore, land-type research, which integrates different land characteristics, such as spatial location and land suitability, provides a unified framework for alleviating conflicts between various types of spatial planning. Thus, it provides a good opportunity to promote integrated resource protection of quantity and quality to achieve sustainable development in China.
The general analysis of land-use suitability is the basis of all-round resource management. Detailed resource protection and utilization measures need to be explicated in large-scale research. Moreover, combining land-type research and land-use modelling is another core topic for future research. Other cities in China can construct such a classification system since basic types of environmental components have been measured all over the country. However, the classification system proposed in this study is more suitable for agricultural and urban land research in humid climate zones in China, as the factors in the classification system could determine the land-use suitability in these areas.
6. Conclusion
In this study, we developed the classification system in the Chinese national standard of land-type research into a 1:100,000 scale by integrating landform type, soil type, land-use type, and land-use intensity as proxies for the environment. Using multi-data, the land-use intensity was represented by the agricultural land quality and urban functional areas. The land of Changzhou was mapped using this system and found to include 3 classes (level 1), 37 land subclasses (level 2), and 137 land units (level 3). Including land-use intensity in the classification system could further reveal the interactions between the environment and human activity. Providing more comprehensive and detailed knowledge about land resources, spatial planning zoning maps with different land-use policies were further conducted based on a land-type map and prior knowledge at the mesoscale, which ensured the applicability of land-type research.
This study provides a framework for regional land classification based on the integrated land theory. The core mission of integrated land research in China is to promote mesoscale land-type research nationwide in the future, which is conducive to building a unified spatial planning system to alleviate the contradiction between human activity and resource protection.
Supplemental Material
Download MS Word (10.2 MB)Acknowledgement
This work was supported by National Natural Science Foundation of China (41801298), the Research on Intelligent Supervision of Territorial Space Planning (BRA2020003), Natural Science Foundation of Jiangsu Province of China (BK20180348).
Yu Gao, Penghui Jiang and Manchun Li contribute equal to this work.
Disclosure statement
No potential conflict of interest was reported by the author(s).
Supplementary material
Supplemental data for this article can be accessed here.
References
- Bailey, R.G., Pfister, R.D., & Henderson, J.A. (1978). Nature of land and resource classification-review. Journal of Forestry, 76(10), 650–655. https://doi.org/https://doi.org/10.1093/jof/76.10.650
- Baroudy, A.A.E. (2016). Mapping and evaluating land suitability using a GIS-based model. CATENA, 140, 95–104. https://doi.org/https://doi.org/10.1016/j.catena.2015.12.010
- Bunce, R.G., Barr, C.J., Clarke, R.T., Howard, D.C., & Lane, A.M. (1996a). Land classification for strategic ecological survey. Journal of Environmental Management, 47(1), 37–60. https://doi.org/https://doi.org/10.1006/jema.1996.0034
- Bunce, R.G., Barr, C.J., Clarke, R.T., Howard, D.C., & Lane, A.M. (1996b). ITE Merlewood land classification of Great Britain. Journal of Biogeography, 23(5), 625–634. https://doi.org/https://doi.org/10.1111/j.1365-2699.1996.tb00023.x
- Cai, Y., Zhang, W., & Zhao, Y. (2009). Discussion on evolution of land-use planning in China. China City Planning Review, 18(1), 34–39.
- Cheng, L., Jiang, P.H., Chen, W., Li, M.C., Wang, L.Y., Gong, Y., Pian, Y.Z., Xia, N., Duan, Y.W., & Huang, Q.H. (2015). Farmland protection policies and rapid urbanization in China: A case study for Changzhou City. Land Use Policy, 48, 552–566. https://doi.org/https://doi.org/10.1016/j.landusepol.2015.06.014
- Cheng, W., Zhou, C., Chai, H., Zhao, S., Liu, H., & Zhou, Z. (2011). Research and compilation of the geomorphologic Atlas of the People’s Republic of China (1:1,000,000). Journal of Geographical Sciences, 21(1), 89–100. https://doi.org/https://doi.org/10.1007/s11442-011-0831-z
- China’s national standard. (2007). GB/T21010-2007. In Current land use condition classification (pp. 1–10). Standards Press of China. Chinese.
- Demers, M.N. (2014). Land classification research: A retrospective and agenda. International Journal of Applied Geospatial Research, 5(3), 82–92. https://doi.org/https://doi.org/10.4018/ijagr.2014070106
- Drăguţ, L., & Eisank, C. (2011). Object representations at multiple scales from digital elevation models. Geomorphology, 129(3), 183–189. https://doi.org/https://doi.org/10.1016/j.geomorph.2011.03.003
- Ellis, E.C., & Ramankutty, N. (2008). Putting people in the map: Anthropogenic biomes of the world. Frontiers in Ecology and the Environment, 6(8), 439–447. https://doi.org/https://doi.org/10.1890/070062
- Erb, K., Haberl, H., Jepsen, M.R., Kuemmerle, T., Lindner, M., Muller, D., Verburg, P.H., & Reenberg, A. (2013). A conceptual framework for analysing and measuring land-use intensity. Current Opinion in Environmental Sustainability, 5(5), 464–470. https://doi.org/https://doi.org/10.1016/j.cosust.2013.07.010
- FAO. (1976). A framework for land evaluation (Soils Bulletin No. 32). Food and Agriculture Organisation of the United Nations.
- Foley, J.A., Defries, R., Asner, G.P., Barford, C., Bonan, G., Carpenter, S.R., Chapin, F.S., Coe, M.T., Daily, G.C., Gibbs, H.K., Helkowski, J.H., Holloway, T., Howard, E.A., Kucharik, C.J., Monfreda, C., Patz, J., Prentice, C.I., Ramankutty, N., & Snyder, P.K. (2005). Global consequences of land use. Science, 309(5734), 570–574. https://doi.org/https://doi.org/10.1126/science.1111772
- Fu, B.J., & Pan, N.Q. (2016). Integrated studies of physical geography in China: Review and prospects. Journal of Geographical Sciences, 26(7), 771–790. https://doi.org/https://doi.org/10.1007/s11442-016-1298-8
- Fürst, C., Helming, K., Lorz, C., Muller, F., & Verburg, P.H. (2013). Integrated land use and regional resource management–A cross-disciplinary dialogue on future perspectives for a sustainable development of regional resources. Journal of Environmental Management, 127(Suppl), 1–5. https://doi.org/https://doi.org/10.1016/j.jenvman.2012.12.015
- Gao, Y., Li, M., & Jiang, P. (2020). Land-type mapping and its application to land-use zoning: A case study of Jiangsu province, eastern China. Journal of Maps, 16(2), 847–854. https://doi.org/https://doi.org/10.1080/17445647.2020.1838959
- Hartigan, J.A., & Wong, M.A. (1979). Algorithm AS 136: A K-Means Clustering Algorithm. Journal of the Royal Statistical Society. Series C (Applied Statistics), 28(1), 100–108. https://doi.org/https://doi.org/10.2307/2346830
- Lacate, D.S. (1961). A review of landtype classification and mapping. Land Economics, 37(3), 271–278. https://doi.org/https://doi.org/10.2307/3159727
- Laliberte, A.S., & Rango, A. (2009). Texture and scale in object-based analysis of subdecimeter resolution unmanned aerial vehicle (UAV) imagery. IEEE Transactions on Geoscience and Remote Sensing, 47(3), 761–770. https://doi.org/https://doi.org/10.1109/TGRS.2008.2009355
- Lambin, E.F., Turner, B.L., Geist, H.J., Agbola, S.B., Angelsen, A., Bruce, J.W., Coomes, O.T., Dirzo, R., Fischer, G., Folke, C., George, P.S., Homewood, K., Imbernon, J., Leemans, R., Li, X.B., Moran, E.F., Mortimore, M., Ramakrishnan, P.S., Richards, J.F., Xu, J.C., & Xu, J. (2001). The causes of land-use and land-cover change: Moving beyond the myths. Global Environmental Change, 11(4), 261–269. https://doi.org/https://doi.org/10.1016/S0959-3780(01)00007-3
- Levers, C., Muller, D., Erb, K., Haberl, H., Jepsen, M.R., Metzger, M.J., Meyfroidt, P., Plieninger, T., Plutzar, C., Sturck, J., Verburg, P.H., Verkerk, H., & Kuemmerle, T. (2018). Archetypical patterns and trajectories of land systems in Europe. Regional Environmental Change, 18(3), 13–18. https://doi.org/https://doi.org/10.1007/s10113-015-0907-x
- Li, G.D., Sun, S.A., & Fang, C.L. (2018). The varying driving forces of urban expansion in China: Insights from a spatial-temporal analysis. Landscape and Urban Planning, 174, 63–77. https://doi.org/https://doi.org/10.1016/j.landurbplan.2018.03.004
- Li, G., Messina, J.P., Peter, B.G., & Snapp, S.S. (2017). Mapping land suitability for agriculture in Malawi. Land Degradation and Development, 28(7), 2001–2016. https://doi.org/https://doi.org/10.1002/ldr.2723
- Li, X., Yu, X., Wu, K., Feng, Z., Liu, Y., & Li, X. (2021). Land-use zoning management to protecting the regional key ecosystem services: A case study in the city belt along the Chaobai River, China. Science of the Total Environment, 762, 143–167. https://doi.org/https://doi.org/10.1016/j.scitotenv.2020.143167
- Lin, T., Xue, X., Shi, L., & Gao, L. (2013). Urban spatial expansion and its impacts on Island ecosystem services and landscape pattern: A case study of the Island city of Xiamen, Southeast China. Ocean & Coastal Management, 81, 90–96. https://doi.org/https://doi.org/10.1016/j.ocecoaman.2012.06.014
- Liu, H., Leng, S., He, C., Peng, J., Piao, S., & Wang, X. (2019). China’s road towards sustainable development: Geography bridges science and solution. Progress in Physical Geography, 43(2), 030913331985102. https://doi.org/https://doi.org/10.1177/0309133319851026
- Liu, L., Xu, X., & Chen, X. (2015). Assessing the impact of urban expansion on potential crop yield in China during 1990–2010. Food Security, 7(1), 33–43. https://doi.org/https://doi.org/10.1007/s12571-014-0411-z
- Mabbutt, J.A. (1988). Australian desert landscapes. GeoJournal, 16(4), 355–369. https://doi.org/https://doi.org/10.1007/BF00214394
- Macmillan, R.A., & Shary, P.A. (2009). Landforms and landform elements in geomorphometry. Developments in Soil Science, 33, 227–254. https://doi.org/https://doi.org/10.1016/S0166-2481(08)00009-3
- Mcdowell, R.W., Snelder, T., Harris, S., Lilburne, L., Larned, S.T., Scarsbrook, M., Curtis, A., Holgate, B., Phillips, J., & Taylor, K. (2018). The land use suitability concept: Introduction and an application of the concept to inform sustainable productivity within environmental constraints. Ecological Indicators, 91, 212–219. https://doi.org/https://doi.org/10.1016/j.ecolind.2018.03.067
- Ministry of Land and Resources of the People’s Republic of China (MLRPRC). (2012). GB/T28407-2012. In Regulation for gradation on agriculture land quality (pp. 1–27). Standards Press of China. (in Chinese).
- Mücher, C.A., Klijn, J.A., Wascher, D.M., & Schaminee, J.H. (2010). A new European Landscape Classification (LANMAP): A transparent, flexible and user-oriented methodology to distinguish landscapes. Ecological Indicators, 10(1), 87–103. https://doi.org/https://doi.org/10.1016/j.ecolind.2009.03.018
- Ni, S.X. 2009. Outline of land types and land evaluation. High Education Press. in Chinese.
- Niu, N., Liu, X., Jin, H., Ye, X., Liu, Y., Li, X., Chen, Y.M., & Li, S. (2017). Integrating multi-source big data to infer building functions. International Journal of Geographical Information Science, 31(9), 1871–1890. https://doi.org/https://doi.org/10.1080/13658816.2017.1325489
- Ornetsmüller, C., Heinimann, A., & Verburg, P.H. (2018). Operationalizing a land systems classification for Laos. Landscape and Urban Planning, 169, 229–240. https://doi.org/https://doi.org/10.1016/j.landurbplan.2017.09.018
- Pienkowski, M.W., Bignal, E.M., Galbraith, C.A., Mccracken, D.I., Stillman, R.A., Boobyer, M.G., & Curtis, D.J. (1996). A simplified classification of land-type zones to assist the integration of biodiversity objectives in land-use policies. Biological Conservation, 75(1), 11–25. https://doi.org/https://doi.org/10.1016/0006-3207(95)00042-9
- Prokayev, V.I. (1962). The facies as the basic and smallest unit in landscape science. Soviet Geography Review and Translation, 3(6), 21–29. https://doi.org/https://doi.org/10.1080/00385417.1962.10769948
- Ramos, I.L., Bernardo, F., Ribeiro, S.C., & van Eetvelde, V. (2016). Landscape identity: Implications for policy making. Land Use Policy, 53(53), 36–43. https://doi.org/https://doi.org/10.1016/j.landusepol.2015.01.030
- Reed, J., van Vianen, J., Barlow, J., & Sunderland, T. (2017). Have integrated landscape approaches reconciled societal and environmental issues in the tropics? Land Use Policy, 63, 481–492. https://doi.org/https://doi.org/10.1016/j.landusepol.2017.02.021
- Rega, C., Short, C., Perezsoba, M., & Paracchini, M.L. (2020). A classification of European agricultural land using an energy-based intensity indicator and detailed crop description. Landscape and Urban Planning, 198, 103793. https://doi.org/https://doi.org/10.1016/j.landurbplan.2020.103793
- Rodriguez-Gallego, L., Achkar, M., & Conde, D. (2012). Land suitability assessment in the catchment area of four Southwestern Atlantic coastal lagoons: Multicriteria and optimization modeling. Environmental Management, 50(1), 140–152. https://doi.org/https://doi.org/10.1007/s00267-012-9843-4
- Rossi, H.E. (2004). Optimal urban land use and zoning. Review of Economic Dynamics, 7(1), 69–106. https://doi.org/https://doi.org/10.1016/S1094-2025(03)00056-5
- Rossiter, D.G. (1996). A theoretical framework for land evaluation. Geoderma, 72(3–4), 165–190. https://doi.org/https://doi.org/10.1016/0016-7061(96)00031-6
- Rowe, J.S., & Sheard, J.W. (1981). Ecological land classification: A survey approach. Environmental Management, 5(5), 451–464. https://doi.org/https://doi.org/10.1007/BF01866822
- Rowe, J.S. (1961). The level-of-integration concept and ecology. Ecology, 42(2), 420–427. https://doi.org/https://doi.org/10.2307/1932098
- Rowe, J.S. (1962). Soil, site and land classification. Forestry Chronicle, 38(4), 420–432. https://doi.org/https://doi.org/10.5558/tfc38420-4
- Sauer, C.O. (1921). The problem of land classification. Annals of the Association of American Geographers, 11(1), 3–16. https://doi.org/https://doi.org/10.1080/00045602109357019
- Sheather, S.J., & Jones, M.C. (1991). A reliable data-based bandwidth selection method for Kernel density estimation. Journal of the Royal Statistical Society Series B-methodological, 53(3), 683–690. https://doi.org/https://doi.org/10.2307/2345597
- Shi, X., Yu, D., Warner, E.D., Sun, W., Petersen, G.W., Gong, Z.T., & Lin, H. (2006). Cross-reference system for translating between genetic soil classification of China and soil taxonomy. Soil Science Society of America Journal, 70(1), 78–83. https://doi.org/https://doi.org/10.2136/sssaj2004.0318
- Sicat, R.S., Carranza, E.J.M., & Nidumolu, U.B. (2005). Fuzzy modeling of farmers’s knowledge for land suitability classification. Agricultural Systems, 83(1), 49–75. https://doi.org/https://doi.org/10.1016/j.agsy.2004.03.002
- Simensen, T., Halvorsen, R., Erikstad, L., Liang, C., Penghui, J., Wei, C., Manchun, L., Liyan, W., Yuan, G., Yuzhe, P., Nan, X., Yuewei, D., & Qiuhao, H. (2018). Methods for landscape characterisation and mapping: A systematic review. Land Use Policy, 75(75), 557–569. https://doi.org/https://doi.org/10.1016/j.landusepol.2018.04.022
- Smiraglia, D., Capotorti, G., Guida, D., Mollo, B., Siervo, V., & Blasi, C. (2013). Land units map of Italy. Journal of Maps, 9(2), 239–244. https://doi.org/https://doi.org/10.1080/17445647.2013.771290
- Tieskens, K.F., Schulp, C.J., Levers, C., Lieskovský, J., Kuemmerle, T., Plieninger, T., & Verburg, P.H. (2017). Characterizing European cultural landscapes: Accounting for structure, management intensity and value of agricultural and forest landscapes. Land Use Policy, 62(62), 29–39. https://doi.org/https://doi.org/10.1016/j.landusepol.2016.12.001
- Ullah, K.M., & Mansourian, A. (2015). Evaluation of land suitability for urban land-use planning: Case study Dhaka City. Transactions in GIS, 20(1), 20–37. https://doi.org/https://doi.org/10.1111/tgis.12137
- Vaidya, O.S., & Kumar, S. (2006). Analytic hierarchy process: An overview of applications. European Journal of Operational Research, 169(1), 1–29. https://doi.org/https://doi.org/10.1016/j.ejor.2004.04.028
- van Asselen, S., & Verburg, P.H. (2012). A land system representation for global assessments and land-use modeling. Global Change Biology, 18(10), 3125–3148. https://doi.org/https://doi.org/10.1111/j.1365-2486.2012.02759.x
- van der Zanden, E.H., Levers, C., Verburg, P.H., & Kuemmerle, T. (2016). Representing composition, spatial structure and management intensity of European agricultural landscapes: A new typology. Landscape and Urban Planning, 150, 36–49. https://doi.org/https://doi.org/10.1016/j.landurbplan.2016.02.005
- van Eetvelde, V., & Antrop, M. (2009). A stepwise multi-scaled landscape typology and characterisation for trans-regional integration, applied on the federal state of Belgium. Landscape and Urban Planning, 91(3), 160–170. https://doi.org/https://doi.org/10.1016/j.landurbplan.2008.12.008
- van Niekerk, A. (2010). A comparison of land unit delineation techniques for land evaluation in the Western Cape, South Africa. Land Use Policy, 27(3), 937–945. https://doi.org/https://doi.org/10.1016/j.landusepol.2009.12.007
- Vasu, D., Srivastava, R., Patil, N.G., Tiwary, P., Chandran, P., & Singh, S.K. (2018). A comparative assessment of land suitability evaluation methods for agricultural land use planning at village level. Land Use Policy, 79, 146–163. https://doi.org/https://doi.org/10.1016/j.landusepol.2018.08.007
- Verburg, P.H., Crossman, N., Ellis, E.C., Heinimann, A., Hostert, P., Mertz, O., Nagendra, H., Sikor, T., Erb, K.H., Golubiewski, N., Grau, R., Grove, M., Konate, S., Meyfroidt, P., Parker, D.C., Chowdhury, R.R., Shibata, H., Thomson, A., & Zhen, L. (2015). Land system science and sustainable development of the earth system: A global land project perspective. Anthropocene, 12, 29–41. https://doi.org/https://doi.org/10.1016/j.ancene.2015.09.004
- Verburg, P.H., Erb, K., Mertz, O., & De Espindola, G.M. (2013). Land system science: Between global challenges and local realities. Current Opinion in Environmental Sustainability, 5(5), 433–437. https://doi.org/https://doi.org/10.1016/j.cosust.2013.08.001
- Verburg, P.H., Neumann, K., & Nol, L. (2011). Challenges in using land use and land cover data for global change studies. Global Change Biology, 17(2), 974–989. https://doi.org/https://doi.org/10.1111/j.1365-2486.2010.02307.x
- Wang, J., Chen, Y., He, T., Lv, C., & Liu, A. (2010). Application of geographic image cognition approach in land type classification using Hyperion image: A case study in China. International Journal of Applied Earth Observation and Geoinformation, 12(Supplement 2), 212–222. https://doi.org/https://doi.org/10.1016/j.jag.2009.06.003
- Wang, L., & Lv, X. (2009). Analysis of the relief amplitude in Xinjiang based on digital elevation model. Science of Surveying and Mapping, 34(1), 113–116. (in Chinese).
- Weng, Q.H. (2012). Remote sensing of impervious surfaces in the urban areas: Requirements, methods, and trends. Remote Sensing of Environment, 117, 34–49. https://doi.org/https://doi.org/10.1016/j.rse.2011.02.030
- Xu, E., & Zhang, H. (2013). Spatially-explicit sensitivity analysis for land suitability evaluation. Applied Geography, 45, 1–9. https://doi.org/https://doi.org/10.1016/j.apgeog.2013.08.005
- Zhang, G., Huang, Q., Zhu, A., & Keel, J.H. (2016). Enabling point pattern analysis on spatial big data using cloud computing: Optimizing and accelerating Ripley’s K function. International Journal of Geographical Information Science, 30(11), 2230–2252. https://doi.org/https://doi.org/10.1080/13658816.2016.1170836
- Zhao, S.Q. 1989. Mapping specification of 1:1,000,000 land-type maps in China. Surveying and Mapping Press. (in Chinese).
- Zonneveld, I.S. (1989). The land unit - A fundamental concept in landscape ecology, and its applications. Landscape Ecology, 3(2), 67–86. https://doi.org/https://doi.org/10.1007/BF00131171