
ABSTRACT
Constitución County in Chile shows one of the highest landscape transformations in the world due to the expansion of forest plantations. This work describes the land use/cover dynamics over a long period extending over 60 years in Constitución County. The results showed that 60% of the county extent was covered by natural vegetationt in 1955. However, forest plantation increased to 36% by 1975 and reached 72% by 2014. This expansion was mainly achieved by replacing native vegetation revealing evidence of the impact of forest plantations on native vegetation even before decree-law 701 (1974). Forest plantation expansion produced fragmentation and loss of natural habitat, and 50% of the remaining habitats showed low habitat quality by 2014. Finally, in 2017 a wildfire burned 77% and 42% of the remaining native forest and shrubland. These results showed the long-lasting impact of forest plantations, underpinning the need to move towards a new sustainable forest model.
Introduction
Land use/ Land cover (LULC) change is an ongoing process (K.E. Locher-Krause et al., Citation2016) that has produced deforestation and forest fragmentation worldwide (Ramachandran et al., Citation2018; Zahawi et al., Citation2015). Global assessment of land cover change using the ESA land cover CCI product (300 meters resolution) shows continuous deforestation between 1992–2018 in South America, Oceania, and Asia (Radwan et al., Citation2021). Additional efforts using fine-resolution images also report deforestation in tropical areas between 1982–2016 (Peng-Song et al., Citation2018). Both studies associated deforestation in the tropics with agricultural expansion, especially in South America. However, tree cover net change between 1982–2016 had a positive net change value of 7.1% due to the increase of tree cover in extratropical areas (Peng-song et al., Citation2018). This increase has been fostered by climate change, for instance, in mountain areas and the Arctic (Peng-Song et al., Citation2018). However, tree cover expansion has also resulted from policies that have promoted the establishment of forest plantations (Peng-Hua et al., Citation2018; Song et al., Citation2018). Forest plantations have increased worldwide in the last decades (Payn et al., Citation2015) and currently reach 3.12% of the total world forest (FAO, Citation2020). South America has the highest annual increment of planted forest (3.14%), three times higher than the world average (1.1%), and 99% of this planted forest correspond to forest plantation, mainly of exotic species (97%) (FAO, Citation2020). Several studies recently started to warn about the possible negative impacts of exotic forest plantations on ecosystems (Pairo et al., Citation2021). For instance, forest plantation seems to contribute to habitats loss and fragmentation (Acuña & Estades, Citation2011; Hua et al., Citation2018) and generate homogeneous landscapes that produce conflict between wildlife and humans, increasing the susceptibility to invasive species, predators, and parasites (Hasan et al., Citation2020). In addition, forest plantations modify biogeochemical cycles, vegetational composition, and soil degradation, which affects the local hydrology and temperature patterns (K. E. Locher-Krause et al., Citation2017).
Consequently, it is essential to understand which ecosystems have been replaced by forest plantations. Thus, it is necessary to go back to earlier periods, which allows characterization of the changes that occurred (Heilmayr et al., Citation2016). LULC change mapping is considered an essential and widely used technique to study the changes that occur in ecosystems (K.E. Locher-Krause et al., Citation2016). It allows an understanding of how species relate to the climate and their habitats (Ramachandran et al., Citation2018), facilitating the identification of conservation priorities and the generation of strategies and policies based on the different territorial conditions (Lira et al., Citation2012; Miranda et al., Citation2015). LULC change mapping is highly relevant to developed countries because they continue to expand and consume more natural resources (K.E. Locher-Krause et al., Citation2016). In developing countries, the general trends that coincide in the increase of land devoted to crops, frequently associated with the concept of arable land, and grasslands and the extreme decrease in forest area can be seen (Song & Deng, Citation2017). Land-use intensification refers to practices that increase land productivity (i) by increasing inputs per unit of land (for example, labour and information based on capital or technology) or the temporal frequency of land (Meyfroidt et al., Citation2018).
Chile is one of the countries that stands out for its forestry development. Mass afforestation began in Chile in 1974 with the enactment of D.L. 701 on forest promotion. This decree-law came to modify the forestry law N ° 4363, written in 1931. Starting in 1974 and by the end of that decade, the state transferred the six forestry companies to the private sector (Cornejo, Citation2003). Simultaneously, with the privatization of state companies and assets and then with the 1982 crisis, the economic groups that survived progressively controlled the number of hectares planted and industries associated with the economic transformation of plantations such as sawmills, paper mills, and mills cellulose (Camus, Citation2001). Currently, according to the data provided by Instituto Forestal [INFOR] (Citation2020), the country’s forest plantations reached 2303 million hectares as of December 2018, which implies an increase in standing plantations of 14,361 ha compared with the previous year. In 2017, the Forestry sector represented 1.9% of the national GDP, reaching 3373 billion pesos (US$ 5 196 million).
In Chile, forestry land cover change studies have been based on historical evidence. This evidence indicates that by the middle of the twentieth century, there were already areas of degraded land resulting from the intensive agricultural use, especially on the coast of southern-central Chile ‘Cordillera de la Costa’. These lands would have suffered a depletion and erosion process and reduced the available water resources, all of which would have led to a progressive reduction in crops (Camus, Citation2006). The Chilean state began to guide different actions to reverse the problem of soil degradation. The first legal step was the creation of the ‘Forest Law’ (1931), which fundamentally aimed to regulate the use of fire, to provide incentives for reforestation, and to avoid the projected deficit in the future availability of wood (Frêne & Núñez, Citation2010). Ten years later, forest plantation promotion began with Corporación de Fomento (CORFO), which initiated the forestry industry with the first forestation plan at the country scale (1943).
Several studies have shown the radical changes that Chile’s native forests have experienced in recent decades (Aguayo et al., Citation2009; Altamirano et al., Citation2013; Miranda et al., Citation2015; Nahuelhual et al., Citation2012). Between 1995 and 2011, exotic tree plantations increased approximately eight times in southern Central Chile (from 12,836 to 103,540 ha), leading to a significant loss of connectivity between forest patches (K.E. Locher-Krause et al., Citation2016).
One of the negative consequences in natural ecosystems related to the expansion of forest plantations is habitat fragmentation and biodiversity loss (Heilmayr et al., Citation2020). Chile forestry zone overlap with one of the biodiversity hotspots (Myers et al., Citation2000) identified for the country, characterized as regions with world priority for conservation due to their high degree of endemism and strong anthropic impact. The ‘Chilean winter rainfall-Valdivian forests’ hotspot extends throughout central Chile, from the Mediterranean climate zone to the temperate zone of northern Patagonia. The Constitución county is located within the Mediterranean climate zone, which is the one that concentrates the highest diversity of flora species as well as the greatest number of endemic species (Bannister et al., Citation2011).
In the five Mediterranean-type climate zones of the world (Mediterranean Europe, California, South-West Australia, South Africa, and Central Chile), the forestry industry has thrived due to the unique climatic conditions present. The seasonality of rainfall and mid-range temperatures favour the growth of forest species (Vizinho et al., Citation2021). Therefore, the USA (26.4 Mha), Chile (3.0 Mha), Spain (2.9 Mha), and Australia (2.0 Mha) are among the 20 countries with the highest surface of planted forest, and production of roundwood – the USA 141.5 (Mm3), Chile 38.4 (Mm3), Australia 19.2 (Mm3), and Spain 11.6 (Mm3) – (Payn et al., Citation2015). The Mediterranean climate zones share the same species that have transformed the landscape. For example, in central Chile, the two species that dominate the forestry industry come from California and Australia. The transformation of natural ecosystems has also had a differentiated impact, with areas of higher transformation as Portugal and Spain in the European Mediterranean, and zone with fewer impacts as Australia (Underwood et al., Citation2009).
This article aims to analyse the LULC change dynamics and effects on the spatial structure and habitat quality in the biodiversity hotspots of Central Chile for an extensive period of sixty years. To assess this, we applied a set of methods: photointerpretation and satellite image classification, transition analysis (net change, loss/gain), landscape metrics, and the Invest habitat quality model.
Materials and Methods
Study area
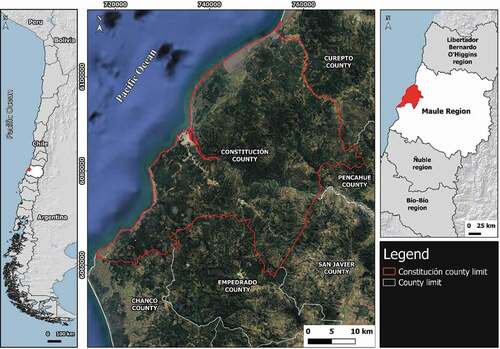
The study area corresponds to Constitución county (35º05’S-72º00ʹW and 35º35’S-72º37ʹW), located in the Maule Region, with a total county area of 1 343 km2 (). The main geomorphological unit is the coastal mountains with an area of fluvial-marine plains in the northern area. Constitución County presents a pluviseasonal Mediterranean bioclimate (Luebert and Pliscoff, Citation2018)). Two vegetation types are present: Coastal Mediterranean sclerophyllous forests of Lithrea caustica and Azara integrifolia and coastal Mediterranean deciduous forests of Nothofagus glauca and Persea lingue (Luebert and Pliscoff, 2018).
Figure 1. Study area.
Photointerpretation and image processing
First, aerial photographs were photointerpreted (Hycon) at a 1:70,000 scale for 1955 based on the LULC classes defined in . Then, images were georeferenced from on-screen control points to generate a mosaic using ArcGis 10.5 (ESRI, Citation2017). The information obtained through the photo interpretation process was digitized, creating a LULC map for 1955. Then, the same process was followed for 1975 using a Landsat-2 MMS false-colour band combination (6–5–4) scene with a spatial resolution of 60 × 60 meters. This image was corrected using aerial photographs for the 1978 CH-30 flight at a 1:30,000 scale. The land-cover for 2014 was digitized using a Landsat-8 OLI with a spatial resolution of 30 × 30 meters; as a secondary source, images from Google Earth were used for corrections. The images were georectified using control points from natural features (rivers, mountain peaks) extracted from the Military Geographic Institute cartography and reclassified according to the land-cover classification matrix (). Finally, the impact in the county due to the mega-fire that occurred in 2017 in Chile was assessed. The polygon of burned areas was downloaded (https://sit.conaf.cl/) and then cropped and rasterized to the county limits. The burned area was determined for each LULC through the crosstab function in Terrset.
Table 1. LULC categories. Categories with an * were considered as natural land covers
LULC change dynamics
We used the ‘Land Change Modeler’ module in the TERRSET v.18.11 environment (IDRISI, Citation2012) to calculate the net change, gain, and loss for each LULC category in both periods. All analyses were performed on raster data with a pixel size of 90 meters.
Characterization of landscape patterns habitat quality
To characterize how land use/change may affect biodiversity in the study area, we used landscape metrics and the habitat quality model of INVEST (Sharp et al., Citation2018). Landscape metrics for 1955, 1975, and 2014 were calculated using FRAGSTATS (McGarigal et al., Citation2012). We chose the following class and landscape level metrics: number of patches (NP), total core area (TCA), mean patch area (MPA), mean nearest-neighbour distance (MNN), and Modified Simpson’s Evenness Index (MDSCI). MDSCI diversity metric was used to assess the homogenization of the landscape in the study area.
Then, the habitat quality model of INVEST was used to assess the changes in habitat quality. The model determines the quality of habitats considering two central concepts 1) the relative impact of several threats on each habitat and 2) the relative sensitivity of each habitat type to each threat. In addition, the model assumes that all threats are additive (Sharp et al., Citation2018). Therefore, impacts of threats on each habitat are calculated by combining a weight value (1 highest impact – 0 lowest impact), the maximum distance at which the threat exerts an effect (km, max distance), and how the impact of a threat behaves as a function of distance (Decay) (Sharp et al., Citation2018). Similarly, susceptibility is calculated by combining a base value of habitat quality (1 high habitat quality, 0 non-habitat quality), with a susceptibility value of each habitat to every threat considering a range between 0 (low susceptibility) and 1 (high susceptibility) (Nelson et al., Citation2009; Xie et al., Citation2018).
Natural land use/cover categories were used to proxy habitat (Native Forest, Shrubland, Wetlands, Grassland). In addition, forest plantations, agricultural and urban areas, pavement roads, and gravel roads were considered threats due to the documented impacts of these anthropogenic activities on natural habitats (Wilson et al., Citation2005). Spatial data for threats was obtained from the classification results, and roads were downloaded from the national spatial database of Chile (www.ide.cl). The values assigned in this model (Supplementary material) were defined through in-depth knowledge of the study area’s ecosystems, and complemented with data from previous studies (Nelson et al., Citation2009; Xie et al., Citation2018).
Results
LULC change dynamics in Constitución County
The land-use and land-cover change dynamics result from 1955–2014 showed an increase of 1250% in the forest plantation area (net change of 88,649 ha) (Supplementary material). In opposition, native forest showed the highest loss (), decreasing by −44,881 ha, followed by shrubland, with a negative net change of −23,777 ha. In addition, the results also highlight the rise in urban areas in 2,446 ha, and grassland and agriculture loss in −13,121.19 ha, −1,922.13 ha, respectively.
Figure 2. Land use/cover change at the county level between 1955 and 2014. (a) 1955, (b) 1975 (c) 2014, (d) burned areas in 2017.
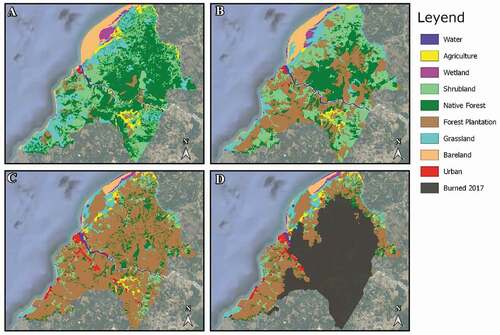
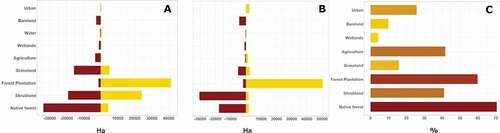
The analyses in the two periods (1955–1975 and 1975–2014) () showed that forest plantation increased slightly more in the second period, and urban areas increased mainly in the second period. In the first period (1955 to 1975), forest plantations increased by 40,031 ha; in contrast, native forest decreased by −29,248 ha, and shrublands by −10,503 ha. Similarly, from 1975 to 2014, forest plantations increased by 48,617 ha (22% higher than in the first period), and urban areas increased by 2246 ha (1028% higher than in the first period). In opposition, native forest and shrubland decreased in −15,633 ha and −28,739 ha, respectively (Supplementary data). The fire of 2017 affected 55% of the total area of the Constitución County and burned 48% of the remaining natural cover, especially native forest (71% of its remaining surface in 2014 was burned ().
Figure 3. (a) Gain and loss 1955–1975 (ha) (b) gain and loss 1975–2014 (ha) (c) burned of remaining cover in 2014 (%) by category.
Analyzing the transition among land covers over the two periods (), the substitution of native vegetation (native forest and shrublands) by forest plantation represents the major transition. Therefore, forest plantation directly replaced 18,553 ha of native forest and 15,025 ha of shrublands between 1955–1975. Follow by 27,191 ha of native forest and 17,081 ha of shrublands between 1975–2014.
Figure 4. Major transition between 1955–1975, and 1975–2014 (% of the total study area, 1% = 1340 ha).
Characterization of landscape patterns and biodiversity loss
The results of landscape metrics reveal habitat loss and fragmentation of native vegetation and grasslands and homogenization of the landscape due to the expansion of forest plantations (). In the first period (1955 to 1975), the number of patches and total core area of native forest decreased (−55% and −53%, respectively), while shrubland reduced the number of patches (−33%) but increased the total core area slightly (4%). Fragmentation took place mainly between 1975–2014, where the number of patches increased for native forest (128%), shrubland (80%), and grassland (65%), while the mean patch area decreased (−80%, −87%, −57% respectively). Considering the period between 1955–2014 mean ENN increased for native forest (9%), shrubland (25%), and grassland (110%). In opposition, forest plantations in the first period (1955–1975) increased the number of patches (20%) and mean patch area (415%), and in the second period (1975–2014) showed an aggregation pattern, characterized by reducing the number of patches (−44%), increasing the mean patch area (264%), and declining the mean ENN (−45%). The study area decreased the diversity of land covers between 1955 and 2014 due to the massive expansion of forest plantations. Despite the slight increase in the diversity value showed from 1955 to 1975 (MSIEI = 0.5919, MSIEI = 0.6214), in 2014, diversity decreased strongly (MSIEI = 0.2868), indicating the dominance of forest plantations on the landscape, and the lack of evenness among land covers (Supplementary data).
Table 2. Landscape metrics for constitution 1955–1975–2014. NP (Number of patches), ENN (Euclidean Nearest-Neighbor), TCA (Total Core Area)
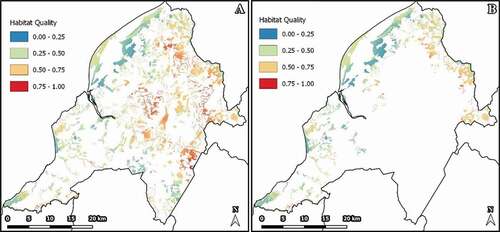
The remaining habitat by 2014, considering Grassland, Wetlands, Shrublands, and Native Forest, encompasses 21% of the study area. Almost half of this habitat showed low habitat quality (< 0.5 habitat score) due to the additive impacts of urban areas, roads, plantations, and agriculture. In opposition, 38% showed regular habitat quality (0.50–0.75 score) and 9% a good habitat quality (0.75–1.00 score). The lowest habitat quality areas are located in the western part of the county, close to the coast, cities, and main roads. In opposition, small patches of native forest and shrublands located in the north part of the county showed the highest habitat quality (). The fire of 2017 reduced the total habitat to 11% of the study area, 73% of this habitat showed low quality, 26% medium quality, and only 1% high quality ().
Figure 5. Habitat quality Constitución County (a) 2014 (b) after fire of 2017.
Discussion
Our results showed a decrease in the extent of native forest (−78%), shrublands (−74%), and grasslands (−67%) from 1955 to 2014. These land use/cover categories were dominant in 1955, covering 81% of the county area. However, they were replaced by forest plantations in approximately 77% by 2014. These changes have produced habitat loss and fragmentation, reducing the mean patch size for native forests, and shrubland between 1955 and 2014. Moreover, 71% of the remaining native forest and 42% of shrubland were lost due to the wildfire of summer 2017. The INVEST habitat quality model, indicated that 50% of the remaining habitat in 2014 showed low habitat quality due to impacts produced by threats as roads, agriculture, forest plantations, and agricultural areas, increasing to 73% after the wildfire of 2017.
Several authors have previously described similar tendencies of land-use and land-cover change in Chile. Echeverria et al. (Citation2006) presented the first study showing the substantial increase in the exotic plantation area over the native forest from 1975 to 2000. The most recent studies (Heilmayr et al., Citation2016; Miranda et al., Citation2017; Zamorano-Elgueta et al., Citation2015) have corroborated the increase in exotic plantations, which has led to the modification of the land use/cover matrix in southern central Chile. This landscape modification caused a decrease in native forest and shrubland, agriculture area (Miranda et al., Citation2015), and produced negative effects on water yield (Little et al., Citation2009), and provision of ecosystem services (Lara et al., Citation2009).
Our study extended the analysis to 1955, enabling us to show that in 1955, forest plantations were already present in Constitution County; however, they covered only 7% of the total area. In opposition, native forest and shrubland encompassed approximately 60% of the county area. Then, forest plantation increased massively between 1955 and 1975 (619%); few studies have accounted for changes in this period (before 1975), and therefore this increase has been hardly documented. Hence, most of the studies identify the decree-law 701 (1974) and modifications (Law 19,651, 1998) as the main driver of the expansion of forest plantation (Heilmayr et al., Citation2020; Peña-Cortés et al., Citation2021). However, our results show that a massive increase of forest plantations also occurred between 1955–1975 in Constitution due to the effects of the forest law of 1931.
In this respect, Chile has become one of the countries with the largest area of forest plantations; however, this process undertook decades. Therefore, for a better understanding of the process, it is essential to contextualize the economic and social stages of economic development in Chile during this time. From 1939 the agency for development (CORFO) financed the establishment of essential forestry enterprises in Chile (e.g. the Sociedad Forestal Colicheu (1941) and the Sociedad Forestal). All were based on pine and eucalyptus plantations (Camus, Citation2006). Afterward, during President Eduardo Frei Montalva (1964–1970) government, forest policy acquired a new dynamic by incorporating the state in the afforestation effort. As a result, state companies were created to boost the forestry business (Otero, Citation2006). Then, the military dictatorship, with its new neoliberal model, recognized in 1974 the forestry sector as strategic for the country’s economic development (Cabaña, Citation2011). Consequently, Decree-Law No. 701 of 1974 was enacted to promote afforestation and promoted the development of the forestry sector by private companies (Niklitschek, Citation2007).
As mentioned earlier, the forest law of 1931 established that degraded areas were destined to be reforested. According to our results, this did not happen. On the contrary, the whole process replaced far more native forest and scrubland than the degraded grasslands that should have been afforested. This tendency did not change afterward. The period between 1975 to 2014 showed a higher amount of native vegetation substitution by forest plantation (32% higher). At the same time, the forestry sector in this period expanded at an unprecedented rate. In 1974, 1,398,500 tons of wood were produced compared with 2,680,000 tons produced in 1989, and more than eight million tons made nationwide in 2007, 96% of which was radiata pine (INFOR, 2017). The entire boom benefited from existing public policies, the extension of D.L. 701 until 2012, and the free trade agreements signed from 1990s onwards (Heilmayr et al., Citation2020; Niklitschek, Citation2007).
Habitat loss and fragmentation are among the main threats to biodiversity conservation, especially megafauna (Haddad et al., Citation2015; Newbold et al., Citation2015). In Constitution County, land use/cover change produced a continuous habitat loss and fragmentation of the landscape, decreasing the mean patch area and the total core area of native forest, shrubland, and grassland. These patterns have also been reported in other regions of south-central Chile (Echeverria et al., 2008, Heilmayr et al., Citation2016). Fragmentation and habitat loss have considerable impacts on wildlife, contributing to a loss of species richness and ecosystem functions (Haddad et al., Citation2015). In Chile, studies showed that habitat loss and fragmentations have implications over the reproductionand dispersal of vegetation e.g. Gomortega keule (Lander et al., Citation2019), impacts on forest specialist birds (Carvajal et al., Citation2018), and effect in prey selection of mesocarnivores (Moreira-Arce et al., 2015).
In addition, half of the remaining habitats in the study area showed low habitat quality in 2014, increasing to 73% after the wildfire of 2017 (Braun et al., Citation2021). The effect of plantations, agriculture, roads, urban areas decreased habitat quality. Habitat quality is a proxy for biodiversity, and habitat availability has proven crucial for delivering ecosystem services such as fishing, pollination, water purification, and pest regulation (Harrison et al., Citation2014). Biodiversity and the ecosystem are influenced by the different interactions that occur, and these depend directly on the availability of habitat (Liquete et al., Citation2016). This study showed the importance of the surrounding area for habitat quality (Baral et al., Citation2014), especially when only a few small habitats remain to maintain wildlife. In these conditions, the protection of small fragments needs to be combined with promoting wildlife-friendly management practices inside the plantation areas (McFadden & Dirzo, Citation2018).
Constitution county is in the region of Chile with the highest loss of natural vegetation and the greatest number of threatened ecosystems (Pliscoff, Citation2015). This study showed how this process began in 1955 in this county. However, these local changes can be understood as part of a major global change process occurring over the past 50 years, where the driver with the highest global impact has been LULC change (Plieninger et al., Citation2016). As a result, the average abundance of indigenous species in most of the major terrestrial biomes has been reduced by at least 20%, affecting ecosystem processes and thus nature’s contributions to people (IPBES et al., Citation2019). According to what has been analyzed, it is clear that it is impossible to make policies without modifying the economic system. The current extractivist model is not sustainable. It is relevant to ensure the conservation of natural ecosystems, considering that nature is essential for human existence and good quality of life. That is why new perspectives of management and order of the territories must be taken, considering not only the economic benefits but also giving importance to nature and society, thinking about socio-ecological systems.
Conclusions
This research allowed us to observe that LULC change has produced native forest replacement over sixty years in the county of Constitution. Most of the studies related to LULC dynamics started in the seventies, which aligned with establishing the forestry model of the dictatorship. Our study showed that natural vegetation covers were relevant in 1955 (covering almost 81% of the total study area). The forestation rate was 22% higher during the last step of analysis (1975–2014). however, 45% of forest plantation expansion occurred during the first period, results that are hardly documented in other studies due to the difficulties of working with old images. Interestingly, 84% of the expansion of forest plantation produced deforestation in the first period (38% over shrubland, 46% over native forest), and 91% in the second period (56% over shrubland, 35% over native forest), revealing evidence of the impacts of forest plantations on native vegetation even before the establishment of decree-law 701 (1974). Overall, this study shows the impacts of forestry plantations on natural vegetation in Chile, underpinning the need for a forestry model based on sustainability standards and conservation actions focused on restoring natural vegetation cover to stop ongoing biodiversity loss.
Supplemental Material
Download Zip (10.5 KB)Acknowledgments
This work was supported by the ANID PIA-Anillo (Soc 1404 project), and National Doctorate Scholarship N ° 21170923 - ANID (National Research and Development Agency). We thank Lorena Sanchez for the translation and editing of the original manuscript.
Disclosure statement
No potential conflict of interest was reported by the author(s).
Supplementary material
Supplemental data for this article can be accessed here
Additional information
Funding
References
- Acuña, M.P., & Estades, C.F. (2011). Plantation clearcut size and the persistence of early-successional wildlife populations. Biological Conservation, 144(5), 1577–1584. https://doi.org/https://doi.org/10.1016/j.biocon.2011.02.003
- Aguayo, M., Pauchard, A., Azócar, G., & Parra, O. (2009). Cambio del uso del suelo en el centro sur de Chile a fines del siglo XX. Entendiendo la dinámica espacial y temporal del paisaje. Revista Chilena de Historia Natural, 82(3), 361–364. https://doi.org/https://doi.org/10.4067/S0716-078X2009000300004
- Altamirano, A., Aplin, P., Miranda, A., Cayuela, L., Algar, A.C., & Field, R. (2013). High rates of forest loss and turnover obscured by classical landscape measures. Applied Geography, 40, 199–211. https://doi.org/https://doi.org/10.1016/j.apgeog.2013.03.003
- Bannister, J.R., Vidal, O., Teneb, E., & Sandoval, V. (2011). Latitudinal patterns and regionalization of plant diversity along a 4270-km gradient in continental Chile. Austral Ecology, 37(4), 500–509. https://doi.org/https://doi.org/10.1111/j.1442-9993.2011.02312.x
- Baral, H., Keenan, R. J., Sharma, S. K., Stork, N. E., & Kasel, S. (2014). Spatial assessment and mapping of biodiversity and conservation priorities in a heavily modified and fragmented production landscape in north-central Victoria, Australia. Ecological Indicators, 36, 552–562 doi:https://doi.org/https://doi.org/10.1016/j.ecolind.2013.09.022.
- Braun, A.C., Faßnacht, F., Valencia, D., & Sepulveda, M. (2021). Consequences of land-use change and the wildfire disaster of 2017 for the central Chilean biodiversity hotspot. Regional Environmental Change, 21(2), 1–22. https://doi.org/https://doi.org/10.1007/s10113-021-01756-4
- Brondizio, E.S., Settele, J., Díaz, S., Ngo, H.T. . (2019). Global Assessment Report on Biodiversity and Ecosystem Services of the Intergovernmental Science- Policy Platform on Biodiversity and Ecosystem Services. Ed. , et.al. (IPBES Secretariat).
- Cabaña, C. (2011). Reseña histórica de la aplicación del DL 701, de 1974, sobre Fomento Forestal. Corporación Nacional Forestal. Santiago. [http://www.corma.cl/wp-content/uploads/2020/03/resena-historica-de-la-aplicacion-del-dl-701-de-1974-sobre-fomento-forestal.pdf]
- Camus, P. (2001). Innovación agroproductiva y ordenamiento del territorio: El caso del desarrollo forestal en Chile. Scripta Nova, 69(85), http://www.ub.edu/geocrit/sn-69-85.htm
- Camus, P. (2006). Ambiente, bosques y gestión forestal en Chile: 1541–2005 ( pp. 374). DIBAM.
- Carvajal, M.A., Alaniz, A.J., Smith‐Ramírez, C., & Sieving, K.E. (2018). Assessing habitat loss and fragmentation and their effects on population viability of forest specialist birds: Linking biogeographical and population approaches. Diversity & Distributions, 24(6), 820–830. https://doi.org/https://doi.org/10.1111/ddi.12730
- Cornejo, J. (2003). Efectos de la actividad forestal en la población indígena mapuche. Documento de trabajo Observatorio Latinoamericano de Conflictos Ambientales (OLCA). [http://www.olca.cl/oca/Chile/plantacion.pdf]
- Echeverria, C., Coomes, D., Salas, J., Rey-Benayas, J.M., Lara, A., & Newton, A. (2006). Rapid deforestation and fragmentation of Chilean Temperate Forests. Biological Conservation, 130(4), 481–494. https://doi.org/https://doi.org/10.1016/j.biocon.2006.01.017
- ESRI. (2017). ArcGIS desktop: Release 10.5. Environmental Systems Systems Research Institute.
- FAO. 2020. Global forest resources assessment 2020: Main report. Rome. https://doi.org/https://doi.org/10.4060/ca9825en
- Frêne, C., & Núñez, M. (2010). Hacia un nuevo modelo forestal en Chile. Revista Bosque Nativo, 47, 25–35.
- Haddad, N.M., Brudvig, L.A., Clobert, J., Davies, K.F., Gonzalez, A., Holt, R.D., Townshend, J.R., Sexton, J.O., Austin, M.P., Collins, C.D., Cook, W.M., Damschen, E.I., Ewers, R.M., Foster, B.L., Jenkins, C.N., King, A.J., Laurance, W.F., Levey, D.J., Margules, C.R., Melbourne, B.A., & Townshend, J.R. (2015). Habitat fragmentation and its lasting impact on earth’s ecosystems. Science Advances, 1(2), 1–9. https://doi.org/https://doi.org/10.1126/sciadv.1500052
- Harrison, P.A., Berry, P.M., Simpson, G., Haslett, J.R., Blicharska, M., Bucur, M., Dunford, R., Egoh, B., Garcia-Llorente, M., Geamana, N., Geertsema, W., Lommelen, E., Meiresonne, L., & Turkelboom, F. (2014). Linkages between biodiversity attributes and ecosystem services: A systematic review. Ecosystem Services, 9, 191–203. https://doi.org/https://doi.org/10.1016/j.ecoser.2014.05.006
- Hasan, S.S., Zhen, L., Miah, M.G., Ahamed, T., & Samie, A. (2020). Impact of land use change on ecosystem services: A review. Environmental Development, 34, 100527. https://doi.org/https://doi.org/10.1016/j.envdev.2020.100527.
- Heilmayr, R., Echeverría, C., Fuentes, R., & Lambin, E.F. (2016). A plantation- dominated forest transition in Chile. Applied Geography, 75, 71–82. https://doi.org/https://doi.org/10.1016/j.apgeog.2016.07.014
- Heilmayr, R., Echeverría, C., & Lambin, E.F. (2020). Impacts of Chilean forest subsidies on forest cover, carbon, and biodiversity. Nature Sustainability, 3(9), 701–709. https://doi.org/https://doi.org/10.1038/s41893-020-0547-0
- Hua, F., Wang, L., Fisher, B., Zheng, X., Wang, X., Douglas, W.Y., Tang, Y., Zhu, J., & Wilcove, D.S. (2018). Tree plantations displacing native forests: The nature and drivers of apparent forest recovery on former croplands in Southwestern China from 2000 to 2015. Biological Conservation, 222, 113–124. https://doi.org/https://doi.org/10.1016/j.biocon.2018.03.034
- IDRISI. (2012). Selva help system. Clark Labs.
- Instituto Forestal. (2020). Anuario forestal 2020, Santiago. https://wef.infor.cl/publicaciones/anuario/2020/Anuario2021.pdf
- Lander, T.A., Harris, S.A., Cremona, P.J., & Boshier, D.H. (2019). Impact of habitat loss and fragmentation on reproduction, dispersal and species persistence for an endangered Chilean tree. Conservation Genetics, 20(5), 973–985. https://doi.org/https://doi.org/10.1007/s10592-019-01187-z
- Lara, A., Little, C., Urrutia, R., McPhee, J., Álvarez-Garretón, C., Oyarzún, C., Arismendi, I., Donoso, P., Nahuelhual, L., Pino, M., & Arismendi, I. (2009). Assessment of ecosystem services as an opportunity for the conservation and management of native forests in Chile. Forest Ecology and Management, 258(4), 415–424. https://doi.org/https://doi.org/10.1016/j.foreco.2009.01.004
- Liquete, C., Cid, N., Lanzanova, D., Grizzetti, B., & Reynaud, A. (2016). Perspectives on the link between ecosystem services and biodiversity: The assessment of the nursery function. Ecological Indicator, 63, 249–257. https://doi.org/https://doi.org/10.1016/j.ecolind.2015.11.058
- Lira, P.K., Ewers, R.M., Banks-Leite, C., Pardini, R., & Metzger, J.P. (2012). Evaluating the legacy of landscape history: Extinction debt and species credit in bird and small mammal assemblages in the Brazilian Atlantic forest. Journal of Applied Ecology, 49, 1325–1333. https://doi.org/https://doi.org/10.1111/j.1365-2664.2012.02214.x
- Little, C., Lara, A., McPhee, J., & Urrutia, R. (2009). Revealing the impact of forest exotic plantations on water yield in large scale watersheds in South-Central Chile. Journal of Hydrology, 374(1–2), 162–170. https://doi.org/https://doi.org/10.1016/j.jhydrol.2009.06.011
- Locher-Krause, K.E., Lautenbach, S., & Volk, M. (2017). Spatio-temporal change of ecosystem services as a key to understand natural resource utilization in Southern Chile. Regional Environmental Change, 8(8), 2477–2493. https://doi.org/https://doi.org/10.1007/s10113-017-1180-y
- Locher-Krause, K.E., Volk, M., Waske, B., Thonfeld, F., & Lautenbach, S. (2016). Influence of temporal scale on landscape transformations: Insights from a landsat-based case study in Southern Chile. Ecological Indicator 75, 132–144. https://doi.org/https://doi.org/10.1016/j.ecolind.2016.12.036
- Luebert, F 2018 Pliscoff, P Sinopsis bioclimática y vegetacional de Chile 2° Edición (Santiago, Chile.: Editorial Universitaria) 384 9789561125759
- McFadden, T.N., & Dirzo, R. (2018). Opening the silvicultural toolbox: A new framework for conserving biodiversity in Chilean timber plantations. Forestry Ecology and Management, 425, 75–84. https://doi.org/https://doi.org/10.1016/j.foreco.2018.05.028
- McGarigal, K., Cushman, S.A., & Ene, E. (2012). FRAGSTATS v4: Spatial pattern analysis program for categorical and continuous maps. University of Massachusetts.
- Meyfroidt, P., Chowdhury, R., de Bremond, A., Ellis, E.C., Erb, K., Filatova, T., Garrett, R.D., Grove, J.M., Heinimann, A., Kuemmerle, T., Kull, C.A., Lambin, E.F., Landon, Y., Le Polain de Waroux, Y., Messerli, P., Müller, D., Nielsen, J., Peterson, G.D., Rodriguez García, V., Schlüter, M., …Verburg, P.H. (2018). Middle-range theories of land system change. Global Environmental Change, 53, 52–67. https://doi.org/https://doi.org/10.1016/j.gloenvcha.2018.08.006
- Miranda, A., Altamirano, A., Cayuela, L., Lara, A., & González, M. (2017). Native forest loss in the Chilean biodiversity hotspot: Revealing the evidence. Regional Environmental Change, 17(1), 285–297. https://doi.org/https://doi.org/10.1007/s10113-016-1010-7
- Miranda, A., Altamirano, A., Cayuela, L., Pincheira, F., & Lara, A. (2015). Different times, same story: Native forest loss and landscape homogenization in three physiographical areas of south-central of Chile. Applied Geography, 60, 20–28. https://doi.org/https://doi.org/10.1016/j.apgeog.2015.02.016
- Myers, N., Mittermeier, R.A., Mittermeier, C.G., Da Fonseca, G.A.B., & Kent, J. (2000). Biodiversity hotspots for conservation priorities. Nature, 403(6772), 853–858. https://doi.org/https://doi.org/10.1038/35002501
- Nahuelhual, L., Carmona, A., Lara, A., Echeverría, C., & González, M.E. (2012). Land- cover change to forest plantations: Proximate causes and implications for the landscape in south-central Chile. Landscape and Urban Planning, 107(1), 12–20. https://doi.org/https://doi.org/10.1016/j.landurbplan.2012.04.006
- Nelson, E., Mendoza, G., Regetz, J., Polasky, S., Tallis, H., Cameron, R., Chan, K., Daily, G., Goldstein, J., Kareiva, P., Lonsdorf, E., Naidoo, R., Ricketts, T., & Shaw, R. (2009). Modeling multiple ecosystem services, biodiversity conservation, commodity production, and tradeoffs at landscape scales. Frontiers in Ecology and Environment, 7(1), 4–11. https://doi.org/https://doi.org/10.1890/080023
- Newbold, T., Hudson, L.N., Hill, S.L., Contu, S., Lysenko, I., Senior, R.A., Purvis, A., Bennett, D.J., Choimes, A., Collen, B., Day, J., De Palma, A., Díaz, S., Echeverria-Londoño, S., Edgar, M.J., Feldman, A., Garon, M., Harrison, M.L.K., Alhusseini, T., Ingram, D.J., & Purvis, A. (2015). Global effects of land use on local terrestrial biodiversity. Nature, 520(7545), 45–50. https://doi.org/https://doi.org/10.1038/nature14324
- Niklitschek, M.E. (2007). Trade liberalization and land use changes: Explaining the expansion of afforested land in Chile. Forestry Science, 53 (3) , 385–394 doi:https://doi.org/https://doi.org/10.1093/forestscience/53.3.385.
- Otero, L. (2006). La Huella del Fuego ( pp. 171). Pehuén Editores.
- Pairo, P.E., Rodriguez, E.E., Bellocq, M.I., & Aceñolaza, P.G. (2021). Changes in taxonomic and functional diversity of plants in a chronosequence of Eucalyptus grandis plantations. Scientific Reports, 11(1), 1–12. https://doi.org/https://doi.org/10.1038/s41598-021-89988-6
- Payn, T., Carnus, J.M., Freer-Smith, P., Kimberley, M., Kollert, W., Liu, S., Wingfield, M.J., Rodriguez, L., Silva, L.N., & Wingfield, M.J. (2015). Changes in planted forests and future global implications. Forest Ecology and Management, 352, 57–67. https://doi.org/https://doi.org/10.1016/j.foreco.2015.06.021
- Peña-Cortés, F., Vergara-Fernández, C., Pincheira-Ulbrich, J., Aguilera-Benavente, F., & Gallardo-Alvarez, N. (2021). Location factors and dynamics of tree plantation expansion in two coastal river basins in south-central Chile: Basis for land use planning. Journal of Land Use Science, 16(2), 159–173. https://doi.org/https://doi.org/10.1080/1747423X.2021.1882597
- Plieninger, T., Draux, H., Fagerholm, N., Bieling, C., Bürgi, M., Kizos, T., Kuemmerle, T., Primdahl, J., & Verburg, P.H. (2016). The driving forces of landscape change in Europe: A systematic review of the evidence. Land Use Policy, 57, 204–214. https://doi.org/https://doi.org/10.1016/j.landusepol.2016.04.040
- Pliscoff, P. (2015 (MMA)). Aplicación de los criterios de la Unión Internacional para la Conservación de la Naturaleza (IUCN) para la evaluación de riesgo de los ecosistemas terrestres de Chile. (pp 63.)
- Radwan, T.M., Blackburn, G.A., Whyatt, J.D., & Atkinson, P.M. (2021). Global land cover trajectories and transitions. Scientific Reports, 11(1), 1–16. https://doi.org/https://doi.org/10.1038/s41598-021-92256-2
- Ramachandran, R.M., Roy, P.S., Chakravarthi, V., Sanjay, J., & Joshi, P.K. (2018). Long-term land use and land cover changes (1920–2015) in Eastern Ghats, India: Pattern of dynamics and challenges in plant species conservation. Ecological Indicator, 85, 21–36. https://doi.org/https://doi.org/10.1016/j.ecolind.2017.10.012
- Sharp, R., Tallis, H.T., Ricketts, T., Guerry, A.D., Wood, S.A., Chaplin-Kramer, R., Nelson, E., Ennaanay, D., Wolny, S., Olwero, N., Vigerstol, K., Pennington, D., Mendoza, G., Aukema, J., Foster, J., Forrest, J., Cameron, D., Arkema, K., Lonsdorf, E., Kennedy, C., … Douglass, J. (2018). InVEST 3.6.0 user’s guide. The natural capital project, Stanford University, University of Minnesota, The Nature Conservancy, and World Wildlife Fund.
- Song, W., & Deng, X. (2017). Land-use/land-cover change and ecosystem service provision in China. Science of the Total Environment, 576, 705–719. https://doi.org/https://doi.org/10.1016/j.scitotenv.2016.07.078
- Song, X.P., Hansen, M.C., Stehman, S.V., Potapov, P.V., Tyukavina, A., Vermote, E.F., & Townshend, J.R. (2018). Global land change from 1982 to 2016. Nature, 560(7720), 639–643. https://doi.org/https://doi.org/10.1038/s41586-018-0411-9
- Underwood, E.C., Klausmeyer, K.R., Cox, R.L., Busby, S.M., Morrison, S., & Shaw, M.R. (2009). Expanding the global network of protected areas to save the imperiled Mediterranean biome. Conservation Biology, 23(1), 43–52. https://doi.org/https://doi.org/10.1111/j.1523-1739.2008.01072.x
- Vizinho, A., Avelar, D., Branquinho, C., Capela Lourenço, T., Carvalho, S., Nunes, A., Sucena-Paiva, L., Oliveira, H., Fonseca, A.L., Duarte Santos, F., Roxo, M.J., & Penha-Lopes, G. (2021). Framework for climate change adaptation of agriculture and forestry in Mediterranean climate regions. Land, 10(2), 161. https://doi.org/https://doi.org/10.3390/land10020161
- Wilson, K., Newton, A., Echeverria, C., Weston, C., & Burgman, M. (2005). A vulnerability analysis of the temperate forests of south-central Chile. Biological Conservation, 122(1), 9–21. https://doi.org/https://doi.org/10.1016/j.biocon.2004.06.015
- Xie, W., Qingxu, H., Chunyang, H., & Zhao, X. (2018). Projecting the impacts of urban expansion on simultaneous losses of ecosystem services: A case study in Beijing, China. Ecological Indicator, 84, 183–193. https://doi.org/https://doi.org/10.1016/j.ecolind.2017.08.055
- Zahawi, R., Duran, G., Kormann, U., & Umapathy, G. (2015). Sixty-seven years of land-use change in southern Costa Rica. PLOS ONE, 10(11) , 014355. https://doi.org/https://doi.org/10.1371/journal.pone.0143554
- Zamorano-Elgueta, C., Rey-Benayas, J.M., Cayuela, L., Hantson, S., & Armenteras, D. (2015). Native forest replacement by exotic plantations in southern Chile (1985–2011) and partial compensation by natural regeneration. Forestry Ecology and Management, 345, 10–20. https://doi.org/https://doi.org/10.1016/j.foreco.2015.02.025