
 ?Mathematical formulae have been encoded as MathML and are displayed in this HTML version using MathJax in order to improve their display. Uncheck the box to turn MathJax off. This feature requires Javascript. Click on a formula to zoom.
ABSTRACT
Rural migration is an integral component of land systems, altering land management both at the origin and destination of migration in regions of Europe and North America. We examine population moving in and out of rural areas in Ohio, U.S.A, between 2008 and 2016 and examine spatiotemporal patterns in land cover. Among families changing residential location, one-third of all household moving events are migration from or to rural areas. A PCA ordination and cluster analysis of rural migration revealed qualitatively distinct patterns. Urban peripheries grew due to in-migration from metro suburban areas, while agricultural and forested areas reflect intra-rural and micropolitan migration. Forested communities have lost population to other rural areas, and rural poverty pockets have gained low-income families from both rural and metro urban areas. Spatial analysis of rural migration patterns and associations with land use helps develop targeted land management strategies and reveals under-represented dynamics in prior studies.
1. Introduction
The rural United States of America, encompassing 97% of the total land area (Nickerson et al., Citation2011), has experienced population ebbs and flows over time, ranging from an era of urban growth in the 1950s accompanied by outmigration from small towns (Johnson and Fuguitt, Citation2000), followed by a back-to-the-land movement during the 1970s (Beale, Citation1975; Vining and Strauss, Citation1977), a shift to retirement havens in the 1990s (Johnson and Beale, Citation1994; Johnson, Citation1999), and the recent rural exodus coupled with city population growth (Johnson & Winkler, Citation2015; Smith et al., Citation2016). Such population dynamics, mediated by socioeconomic and environmental factors, have significant implications for land cover and land use patterns in rural areas (Brown et al., Citation2005; Carr, Citation2009; Munroe et al., Citation2013). Cities have become larger, less dense, and increasingly draw commuters from settlements in outlying areas (Olson & Munroe, Citation2012). Rural has generally lost cropland and forest due to the land abandonment in remote rural as well as exurban growth in urban fringes (Brown et al., Citation2005). Thus, the category ‘rural’ in regions like Europe and North America exhibits more diversity and complexity than in decades past (Irwin et al., Citation2009; Slack & Jensen, Citation2020). The inflow and outflow of particular groups of people represent changes in the quantities of goods, services, and functions of land and transformations in what stakeholders, including rural communities and landowners, value the most, thereby altering land management processes (GLP, Citation2005; McCool & Kruger, Citation2003). In many cases, the general persistence of forest or agricultural land cover (especially in coarse categories) belies an underlying complexity of land management and population dynamics (Drummond et al., Citation2017). Thus, in addition to a focus on the complexity of urban-rural dynamics, we argue that interconnections among rural areas (small towns and villages), including the impacts of smaller-scale population movements on land cover, are an overlooked component of land systems.
Spatially linking migration to land use and land cover (LULC) change, both in and out of rural areas, can support natural resource management (S. S. Bell et al., Citation2010). A better understanding of the diversity of rural population transitions and their varied effects on land cover is necessary for the ongoing management of agricultural and forested landscapes (Munroe et al., Citation2019). Even the same type of land change might require different land management strategies if population dynamics differ (e.g. expanding developed land in suburban affluent vs. depopulated declining communities). Further, identifying bidirectional connections via migration can yield solutions beyond the specific region (Seto et al., Citation2012). A spatially explicit understanding of migration patterns and their association with land could empower agencies to set policy targets for places and people while planning programs more effectively.
In order to understand land cover trajectories in relation to migration dynamics in rural America, this study maps rural migration at a fine-grain level and its potential impacts on land cover. The two primary objectives of this paper are to (1) summarize patterns of rural migration, resolved at the census tract level, and (2) examine migration patterns in tandem with LULC trends. After reviewing prior studies on population and land dynamics in the US context, we analyze residential mobility data. Our analyses describe trends between 2008 and 2016 in Ohio in the United States, using the Data Axle Historical Consumer Database and National Land Cover Database (NLCD). We apply multivariate techniques to extract and summarize similarities within and differences among census tracts in the state, based on migration indices describing different mobility patterns by movers’ socioeconomic status (e.g. age and income level) and area types of origin and destination. We then compare and contrast land cover trends according to the migration patterns.
2. Land dynamics of rural America
Studies of rural migration within North America have most often been the purview of demographers and rural sociologists, who have reported that most rural areas have lost net population, while a few places have grown steadily, at least in the last two decades (Golding & Winkler, Citation2020; Johnson & Lichter, Citation2019; Johnson & Winkler, Citation2015; Smith et al., Citation2016). Generally, the rural areas that are growing are often within 2 hours of cities, but connections can be related to labor markets, land markets, or tourism and recreation, all with distinct resulting community outcomes (Glasmeier, Citation2018; Morzillo et al., Citation2015). Such diverse ways that migrants (and existing residents) interface with the land system potentially create varying extent and direction of LULC changes (S. S. Bell et al., Citation2010; Carr, Citation2009). Although few works explicitly have addressed links of land to migration processes in the US context (c.f., much have been done on tropical forest countries; Radel et al., Citation2019), a substantial number of studies have reported land dynamics around exurban sprawl (i.e. rural in-migration) and rural land abandonment (i.e. rural out-migration). The prior findings on relationships between land and population can be summarized as follows (). First, one dominant trend associated with shrinking rural areas is rural-to-urban migration. Previous research has emphasized the role of young adults who move into cities seeking new income and employment opportunities (Johnson & Winkler, Citation2015; Van Berkel et al., Citation2014). As Johnson and Lichter (Citation2019) noted, persistent out-migration, declining fertility, and rising mortality have resulted in hollowed villages in rural areas. Such out-migration of the population can result in the abandonment of settlements and croplands. While land abandonment presents an opportunity for natural regeneration and rewilding (Law & McSweeney, Citation2013; Rhemtulla et al., Citation2007), according to the Forest Transition Theory, several socioeconomic factors complicate the consequences (Munroe et al., Citation2013). For instance, agricultural land in the Great Plains remains relatively unchanged, despite a decreasing population that reflects a conversion into a capital-intensive farming model (e.g. mechanization; Brown et al., Citation2005; MacDonald et al., Citation2015). Absentee forest landowners left out from or inherited the land pose obstacles for land management due to the different degrees of engagement and interest in the local environment (Gallemore et al., Citation2018). Finally, a diminishing tax base associated with depopulation can continue to reduce the capabilities of a public agency to manage its land.
Table 1. Land-Migration relationships in rural America
Second, net migration gain in some rural regions is associated with recreation and retirement destinations at the peripheries of metropolitan areas (Kondo et al., Citation2012; McCool & Kruger, Citation2003; Plane & Jurjevich, Citation2009). Natural amenities such as waterbodies, wilderness, and outdoor recreation with urban accessibility attract retirees and family ages with the promise of rural idylls (Golding & Winkler, Citation2020; McGranahan, Citation2008). Such migration-destination regions, often located in the urban fringe, are likely to experience a transition of agricultural or forested land into developed land (Brown et al., Citation2008; Robinson et al., Citation2005; White et al., Citation2009), which might require new policies (e.g. zoning) to prevent land fragmentation (Clark et al., Citation2009; Irwin & Bockstael, Citation2007; Radeloff et al., Citation2005). In the case of amenity-induced migration, natural amenities (e.g. forested areas) can be well preserved with a minimal increase in developed areas. Newcomers tend to be more supportive of nature preservation when compared to traditional community interests in resource extraction (Irwin & Bockstael, Citation2007; Kondo et al., Citation2012; McCool & Kruger, Citation2003).
While the impacts of migration between rural and urban have been well documented, other flows that do not fall into either rural-to-urban or urban-to-rural archetypes have been observed in qualitative studies. For instance, the inflow of low-income and the outflow of higher-income residents have created poverty pockets in rural areas (Foulkes & Newbold, Citation2008; Foulkes & Schafft, Citation2010; Lichter & Johnson, Citation2007). Foulkes and Newbold (Citation2008) noted that some impoverished rural communities exhibit high turnover as they became destinations for rural poor, seeking lower costs of living. These dynamics are also entangled with the growing migration of low-income urban minorities and Hispanic/Latino immigrants, often associated with labor needs in agricultural processing industries located in small towns (Kandel et al., Citation2011; Lichter, Citation2012). Interestingly, Foulkes and Newbold (Citation2008) also note that though rural communities as a whole have become more diverse, these migration dynamics have left rural communities more homogenous locally; e.g. with less diverse pockets of poverty on one hand, or high-amenity, tourism, and bedroom communities on the other.
Another possible pattern relevant to the rural-to-rural migration is interaction with micropolitan areas, isolated small cities (Kandel et al., Citation2011; Lichter, Citation2012). Micropolitan areas generally have low turnover compared to large volumes of movers in metro-adjacent places (Golding & Winkler, Citation2020). The internal dynamics likely intersect with rural-to-rural migration because a micropolitan county is remarkably diverse, encompassing rural and urban areas (Mulligan & Vias, Citation2006; Smith et al., Citation2016; Vias, Citation2012). For example, the selected rural communities in Foulkes and Newbold (Citation2008) largely overlap with micropolitan statistical areas defined by the Office of Management and Budget (OMB). However, analysis of intra-rural dynamics in terms of spatial configurations and impacts on LULC have been impeded by coarse-grain data (e.g. data from the Statistics of Income (SOI) office of the IRS and U.S. Census Bureau). Separating rural from small cities in micropolitan areas will allow intra-rural dynamics and land-use change trajectory to be better distinguished. Given the continuous slowdown of inter-county and inter-state migration (Cadwallader, Citation1992; Greenlee, Citation2019; Kaplan & Schulhofer-wohl, Citation2015), a fine-grain analysis of migration will aid our understanding of the differences and similarities of various migration patterns and associated land cover trajectories.
In this paper, we examine migration patterns at the level of the census tract–statistical subdivisions of a county with an average of about 4,000 residents (US Census Bureau, Citation2015) – in order to demonstrate diverse migration patterns including intra-rural movement have shaped the rural landscape. We identify and locate other categories of rural than urbanizing (i.e. urban-to-rural) and declining (i.e. rural-to-urban) dichotomy by considering different motivations of migration and directionality of moves. By doing so, we attempt to discover the complexity underlying land cover trajectories (e.g. expansion of developed land and de/reforestation) despite overall change being fairly stable. Most importantly, rural-to-rural migration unravels different underlying factors shaping land cover trajectories by identifying heterogeneity within urban fringe and remote rural. There is a spatial separation of the places preferred by rural residents and where migrants from cities gather within urban fringes, and some remote rural areas experience more severe population outflow to rural than others. Such heterogeneity suggests different approaches are needed for better land management.
3. Materials and methods
3.1. Study area
Our study covers the entire state of Ohio (), a land area of 106,860 km2. Ohio is a state located in the Midwestern region of the United States, with an estimated 11.7 million residents as of 2019. Among the total population, around 40% live outside the Metropolitan Statistical Area (MSA),Footnote1 which occupies more than 70% of the total land (US Census Bureau, Citation2015). The population density in rural areas is higher near large MSAs, and it gets lower in remote rural areas farther from MSAs (left panel of ).
Figure 1. Map of study areas. The left panel shows the population density of census tracts in 2016. The right panel presents the majority land cover types of census tracts in 2016.
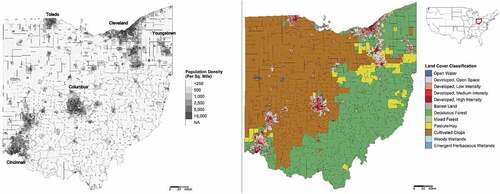
According to 2016 National Land Cover Database (NLCD; Dewitz, Citation2019), Ohio consists of 13.7% developed land (14,690 km2), 32.4% forest (35,048 km2), and 50.0% agricultural land (55,416 km2; , right panel). Developed land is mostly concentrated in three big metropolitans, Columbus, Cleveland, and Cincinnati. The southeastern part of the state is characterized by the western foothills of the Appalachian Mountains, overlapping with forests and scattered pastures, and the northwestern part is largely based on agriculture (United States Department of Agriculture, Citation2005). Ohio and the U.S. Midwest have gained a significant amount of developed land over decades, primarily from the conversion of agricultural land (Auch & Laingen, Citation2015; Janis et al., Citation2015b, Citation2015a). Between 2008 and 2016, Ohio gained 2.45% of developed land while losing forest and agricultural land by 0.14% and 0.66%, respectively.
3.2. Data and methods
Classifying census tracts
We classified Ohio census tracts into the following four categories along the urban-rural continuum: metropolitan urban, metropolitan suburban, micropolitan, and rural. While prior studies have adopted or introduced classification schemes to distinguish core urban and remote rural from suburban and exurban surroundings at a county level (Golding & Winkler, Citation2020; Johnson & Winkler, Citation2015), we adopted a census tract-level classification scheme and modified it. First, we employed Urbanization Perceptions Small Area Index (UPSAI) to classify census tracts into urban, suburban, and rural (HUD, Citation2017). UPSAI was based on the 2017 American Housing Survey, which asked respondents to describe their neighborhood as urban, suburban, or rural at a census tract level. These categories were adjusted using a machine learning technique (Bucholtz et al., Citation2020), which enabled us to identify urbanized census tracts in rural counties and rural census tracts in urban counties as defined by Rural-Urban Continuum Codes (USDA Economic Research Service, Citation2020). Since data reflects 2017 classifications, census tracts that used to be rural in 2008 but turned into urban or suburban are excluded from the analysis. Second, we distinguished micropolitan from metropolitan by overlaying MSA on UPSAI. We defined urban and suburban within the MSA boundary as metropolitan urban and metropolitan suburban, respectively. Urban and suburban areas outside the boundary were defined as micropolitan, while the rest were rural. By doing so, we extract larger rural areas compared to the county-based classification, which will be further classified according to their migration patterns. summarizes the status of each area classification and the relative percentage from the total number of census tracts and households, and the area of the state (Supplementary . for the geographic spread of the area types).
Table 2. Key characteristics of the four area types in Ohio
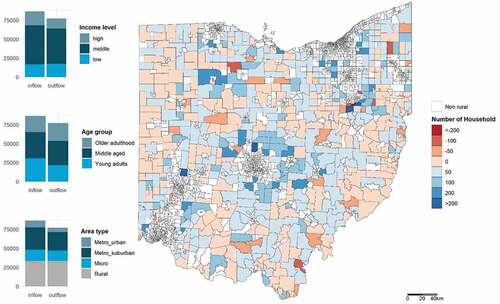
Figure 2. Household migration in rural Ohio, 2008–2016. Left panel: Inflow and outflow by household characteristics and area types of origins and destinations. Right panel: Net migration in rural areas (Inflow-outflow).
Mapping and summarizing rural migration
We relied on census tract-level migration data from the Data Axle Historical Consumer Database. The dataset, constructed for business use (e.g. advertising campaigns), provides households’ addresses with a unique identification number every year (household ID) for 155 million households nationwide (Data Axle, Citation2021). This allows for capturing mobility processes at a finer scale otherwise hard to measure by linking the yearly records of the longitude and latitude of residential addresses into a longitudinal data set. This database also includes household socioeconomic status data points, including annual income, head of household age, marital status, and homeownership. Researchers previously used the data to examine residential mobility in relation to neighborhood change (Greenlee, Citation2019), neighborhood type (Pan et al., Citation2020), and location preferences (Wang et al., Citation2021). It covers a considerably large sample of individual households in the study region and is much less likely to suffer from selection bias (See Supplementary Note 1 for data validation).
We defined migration as the change of residential address between two ‘snapshots’, 2008 and 2016. We limited the data sample only to intra-state moves, where both the origin and the destination are located within the study area. Therefore, we first merged residential location data in Ohio for 2008 and 2016 by household ID, retrieving data for 3,526,448 households (76.6% of the total number of households in the state). We then identified 566,608 households (16.1% of the matched households) that changed addresses from one census tract to another. To capture differential migration patterns by household type, we categorized households according to income level and age group. Following Kochhar (Citation2018), we defined households earning twice the state median household income as high-income and households below two-thirds of the median income as low-income households. The rest were defined as middle-income households. Next, we divided households into age groups according to the head of household’s age that covered young adults (<39 years), middle-aged (40 ~ 59 years), and older adulthood (>60 years). The household-based data does not capture the case of separating from existing households and constructing separate households in different census tracts. Thus, the analysis hardly verifies youth migration with economic motivation.
We then pooled each group’s moves into an origin-destination matrix that described the total number of moves from one census tract to another between 2008 and 2016 within Ohio State. Moves that do not involve rural census tract either as origin or destination were excluded. In the origin-destination matrix, 1,779,384 unique origin-destination pairings connected 605 rural census tracts and every census tract of 2946.
To extract and summarize similarities within and differences among census tracts in terms of migration patterns, we applied two multivariate techniques on 15 migration indices. First, we conducted a principal component analysis (PCA). This method enabled us to reduce the number of variables (dimensions) needed to characterize the dataset and to remove multicollinearity of the data. We chose four components, guided by the screen plot and the principle that components should explain above 70% of the variance (A. R. A. R. Bell et al., Citation2015). The varimax rotation was performed to simplify factor loadings into independent factors, as all the factors are not significantly correlated with one another (Allen, Citation2017). Second, we used the k-means clustering algorithm of the chosen components’ scores to locate discrete sub-categories of rural census tracts. The algorithm divides observations into cluster categories, minimizing the sum of the square distance (within-cluster variances) of each sample with its cluster center (MacQueen, Citation1967). Selecting the number of clusters was guided by optimizing the total intra-cluster variation (within-cluster sum of squares). Finally, the clusters’ key socioeconomic characteristics were analyzed by merging them with the 2012–2016 American Community Survey (ACS) 5-Estimates (U.S. Census Bureau, Citation2016).
Fifteen migration indices were included as variables in our multivariate analyses (Supplementary . for descriptive statistics of variables, Supplementary . for the spatial distribution of the variables). The indices capture critical dimensions of migration events by households’ characteristics and the area types between which households move. We calculated the share of inflow of a particular class (e.g. from micropolitan, of high-income) among the total inflow into the census tract. This process enabled us to standardize them, account for relative differences in size across census tracts, and consider the directionality of migration across the area type. The same was done for outflow as follows:
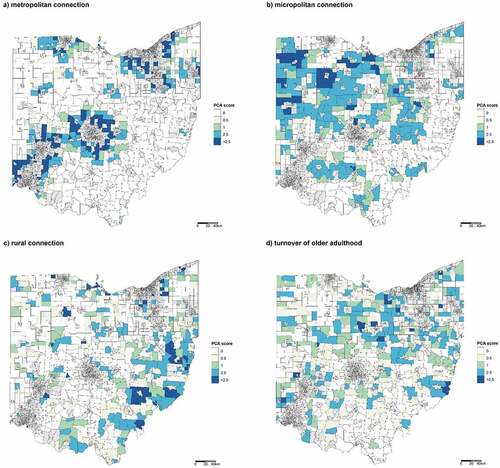
Figure 3. Maps of component scores for a) PC1: metropolitan connection, b) PC2: micropolitan connection, c) PC3: rural connection, d) PC4: turnover of older adulthood. The maps present only census tracts with positive values for visual clarity.
where is census tract, and
is household type or area type. Net migration (
) was included to account for net gain or loss.
Linking migration to land cover change
We used NLCD land cover data constructed in 2008 and 2016 to identify land cover change during the same migration period.Footnote2 The data, raster data with a spatial resolution of is derived from remotely sensed Landsat Thematic Mapper satellite imagery. Among the total of fifteen categories of land cover in the state, we selected nineFootnote3 which take up more than 95% of the total land in the state and aggregated them into three. These categories are as follows: developed land (open space, low density, medium intensity, and high intensity), forested land (deciduous, evergreen, and mixed), and agricultural land (pasture/hay and cultivated crops). We quantified the percentage of each land cover type among the total area of a census tract in 2016 and calculated the increase rate of the area by type between 2008 and 2016. We also calculated the share of land cover type in 2008 that had converted to the respective type in 2016, to examine different patterns of type-to-type conversions by cluster. We conducted an ANOVA test and Tukey multiple pairwise comparisons to compare the means of land cover change in identified clusters. R 4.1.1. was used for data processing and analysis.
4. Results
4.1. Net migration – Rural gained population
Aggregating household moves within the state made between 2008 and 2016, rural census tracts as a whole experienced a positive net migration of about 1.2% of the total number of households in 2008, while metropolitan urban and micropolitan areas lost households (). The net in-migration well corresponds to the national trend of the recent upturn in the rural population in the 2010s due to migration (United States Department of Agriculture, Citation2018).
Rural migration either from or to rural areas accounts for 27.4% among the total migration within the state (Supplementary ). The share of rural-to-rural migration was the highest (7.1%), followed by metropolitan suburban-to-rural (6.2%), rural-to-metropolitan suburban (5.1%), micropolitan-to-rural (3.1%), rural-to-micropolitan (2.9%), metropolitan urban-to-rural (1.9%), and rural-to-metropolitan urban (1.2%). The right panel of reveals that census tracts close to large metro areas had overwhelmingly accrued in-migrants; other remote rural experienced a slight net gain or net losses.
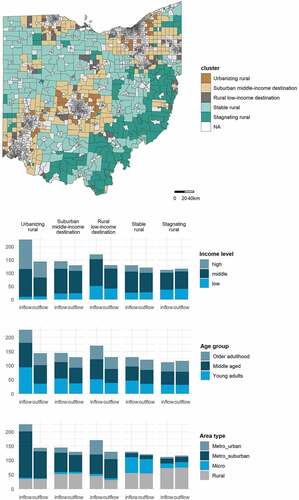
Figure 4. (Top) Map of clusters sharing similar migration patterns and (Bottom) The average number of inflow and outflow by household characteristics and area types in each cluster.
4.2. Heterogeneous rural migration making homogeneous rural places
Multivariate analyses applied to migration indices showed substantial heterogeneity within rural Ohio in terms of population dynamics. Some disproportionately gained higher-income families while others received lower-income movers. Some forest-based remote rural areas have been losing population, whereas others based on agriculture have gained population. Distinct spatial patterns sharing similar socioeconomic traits reveal that there is growing homogeneity within local rural areas.
PCA ordination summarized the rural migration with four principal components (). It should be noted that migrations into and out of a specific area type were positively correlated. The first component (PC1), explaining 28.9% of the variance, captures high net inflow areas in high interactions with metropolitan suburban. High-score census tracts have a higher share of high-income inflows with a low share of low-income inflows. High scores are concentrated in metropolitan adjacencies. The next component, PC2 (explaining 14.3% of variance), relates to the interaction with micropolitan areas. The scores are positively correlated with high in-migration of young adult families and low in-migration of low-income households. Hotspots appear in the northwestern part of the state. PC3 (10.3% of variance), shares common traits regarding intra-rural migration and negative net migration. Census tracts with a higher PC3, which encompass southeastern areas along the Appalachian Mountains, have fewer interactions with metropolitan and micropolitan areas. Finally, PC4 (8.7% of variance) explains the higher turnover of older adulthood and a lower turnover of young adults. The spatial pattern is less obvious, but many high scores are scattered in northeastern Ohio.
The k-means clustering algorithm applied to the reduced variables (four principal component scores) identified five clusters in rural Ohio (, ). Each cluster shares similar migration patterns in terms of household compositions and origins and destinations of area types, exhibiting distinct geographical patterns. The first three clusters – urbanizing rural, suburban middle-income destination, and rural low-income destination – are all clustered near metropolitan areas, and the remaining two–stable rural and stagnating rural–are located in remote rural.
Table 3. Identified five clusters and key characteristics
Urbanizing rural, having the highest net migration gains, received high-income and young adults mostly from metropolitan suburban. The cluster, located closest to the MSAs, is the most affluent with the lowest poverty rate. Suburban middle-income destinations located in the most outer circle of MSAs show net migration gain of middle-income and young adults from metropolitan areas. The cluster exhibits outflow of older adults and more prominent net migration loss against rural. Additionally, it constitutes affluent communities with lower population density. Rural low-income destinations had the highest net migration gains in low-income and older adulthoods. The highest net migration gains from both rural and metropolitan urban were captured. Despite its location in the urban fringe of MSAs, the census tracts are in isolation from nearby affluent urbanizing areas. It exhibits the highest population density, the highest share of the elderlies, and the second-highest poverty rate among clusters. The share of the White population is the lowest. The other two clusters are remote rural. Stable rural, clustered in the northwestern part, significantly interacts with nearby micropolitan areas, with net migration gains, on average. Stagnating rural clustered in the southeastern part of the state had net migration losses. While the losses occurred regardless of household type, older adulthoods and low-income outflows are significant. Out-migration is generally made to other rural areas. It is the poorest cluster with the highest vacancy rate, reflecting the net out-migration.
4.4. Land cover change by cluster
Each cluster accompanied distinct land cover patterns (). Clusters located in the urban fringe have a higher share of developed land while remote rural clusters have more forested or agricultural land in 2016.
Table 4. Land cover composition and land cover change by cluster (%)
The share of developed land increased and that of agricultural land decreased, regardless of the cluster, though the extent varies (). There are significant differences in land cover change between urbanizing rural and other clusters, whereas other clusters share similar trajectories and intensities of land cover change (Supplementary for box plots). Urbanizing rural shows the highest increased rate of developed land while that of forest and agricultural land decreasing. The Southern edge of Columbus experienced a higher level of deforestation. Rural low-income destination has the highest share of developed land, and both forest and agricultural land decreased. Both suburban middle-income destinations and stable rural were agricultural-based regions with a sparse settlement. Nevertheless, the stable rural, especially the communities in the Western edge of the Appalachian Mountains and the Eastern end of Cincinnati, had experienced an increase in forested land with the lowest change in developed and agricultural land. Stagnating rural refers to forest-based communities but developed land had expanded while losing forested land despite net out-migration.
Figure 5. Increase rate of (a) developed land, (b) forested land, and (c) agricultural land in rural census tracts of Ohio, between 2008 and 2016.
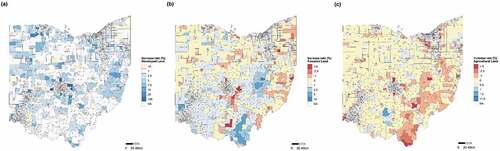
Across clusters, both urbanization (i.e. increase of developed land) and reforestation (i.e. increase of forested land) were most likely accompanied by conversion of agricultural lands. The increase of agricultural land was mostly converted from developed landsFootnote4 (, Supplementary Figure 6). Deviated from the general trends, stagnating rural converted a higher share of forested land into developed and agricultural land. The forest-based communities have the lowest share of developed land for reforestation, which implies a higher degree of land abandonment. On the other hand, Stable rural converted agricultural land into developed land the most and converted forested land into other types the least. The agricultural-based communities have conserved forests compared to other clusters.
Table 5. Land cover change by cluster, showing the share of land cover type in 2008 that changed to the respective land cover type in 2016 (%)
5. Discussion
While net migration gain of rural areas is concentrated closer to metropolitan areas, we discovered distinct clusters of rural census tracts by analyzing migration for different household groups (i.e. income and age), representing distinct motivations for relocation and in the directionality of flow across the area type. Overall, selective migration by income level widens disparities between poverty pockets and affluent pockets in exurban areas (Foulkes & Newbold, Citation2008). In contrast to the agriculture-based remote rural which maintains relatively stable communities, forest-based remote rural is losing population. The findings reveal that there is greater variation among rural regions, echoing a refrain across recent studies that rural America is not monolithic (Slack & Jensen, Citation2020). The ongoing heterogeneous migration patterns are highly likely to result in growing homogeneity at a neighborhood level.
Notably, however, the distinct migration patterns are not necessarily reflected in land cover. Out-migration in the forest-based areas has not been led to reforestation, while the population-gaining agriculture-based communities have maintained forests. Nevertheless, the spatially explicit understanding of the whole migration pattern and its association with land use helps develop targeted land management strategies. Even for the same land cover trajectory of deforestation, the results tell us that different strategies are needed according to the population dynamics: infill development in urban fringes where population influx occurs and natural regeneration of abandoned settlements in the forest-based communities where depopulation takes place. Moreover, within the urban fringes where the same population inflow occurs, the development process should be controlled in different ways, given that the places where higher-incomes gather and lower-incomes flow into are spatially separated.
5.1. Comparisons with previous work
Whereas dynamics in rural America have largely been examined in relation to changes in urban population and land area, our analysis indicates that a significant share of migration internally occurs reshaping the rural landscape. Zooming into the rural-to-rural migration enabled identification of rural low-income destinations in exurban areas and the distinction between stable rural and stagnating rural, complementing the existing literature.
The first two clusters, urbanizing rural and suburban middle-income destinations, are well suited to the previously reported trend of exurbanization – the movement of affluent residents into the open countryside (Johnson & Winkler, Citation2015). It also supports that urban proximity still matters, even in migration associated with lifestyles (e.g. recreation, natural amenities; Golding & Winkler, Citation2020; Johnson & Stewart, Citation2005). However, it might be more appropriate to term the trend ‘suburbanization’ or ‘rural gentrification,’ (Salamon Citation2007; Hammer and Winkler Citation2006; Golding & Winkler, Citation2020) as most of the inflow is from metro suburban, and net outflow to a rural area is observed. Accordingly, the clusters have experienced expanding developed land and loss of agricultural and forested land, representing similarities to cities. Although the intensity of the land change is more prominent in urbanizing rural, suburban middle-income destinations can follow the trajectory if the migration pattern persists.
Dynamics in rural low-income destinations explains how rural poverty pockets are created (Foulkes & Newbold, Citation2008; Lichter & Johnson, Citation2007). Relatively higher inflows of low-income households from both the metropolitan urban and rural areas reveal that the cluster is where urban minorities and mobile rural poor converge. Accordingly, the area shows an exceptionally high share of developed land despite surrounding low-density settlements. The cluster has lost agricultural land, which reflects the conversion of economic base from agriculture to non-agriculture and increasing commuting populations (Kandel et al., Citation2011). This finding complements previous findings by empirically locating the rural poverty pockets within the broader migration patterns and identifying geographical configurations.
Stable rural sustains relatively stable communities with a slight net in-migration. A relatively high share of bidirectional migration with micropolitan partly explains the net migration loss of micropolitan over the last three decades (Golding & Winkler, Citation2020). Generally, a higher median income and a net inflow of young adults indicate that the agricultural-based rural has relatively well sustained its communities. The pattern corresponds to the growth of very small farms and the increasing number of farms (i.e. slowing down of the farm exits and increasing new entry) in Ohio in the last decade (Becot et al., Citation2020; MacDonald et al., Citation2015). Notably, the area has experienced land cover change in the lowest intensity with the preservation of forested land. The tendency possibly reflects that in-migration does not necessarily lead to deforestation and that stable communities are possibly able to effectively manage the land.
Stagnating rural is likely where ‘rural exodus’ takes place (Johnson & Winkler, Citation2015; Smith et al., Citation2016), confirming poverty concentration in Appalachian communities (Burton et al., Citation2013; Lichter & Cimbulak, Citation2010). Land cover dynamics in the cluster show that an aggregate loss in forested land occurred, underscoring that depopulation does not necessarily lead to reforestation but to land abandonment (Brown et al., Citation2005; Munroe et al., Citation2013). When combined with the deprived economic base, residents expanded developed land in searching for new income sources including tourism (Van Berkel et al., Citation2014) and lost forest due to the ongoing reliance on extractive industries. While environmental regulations led coal production to decrease during the 20th century, the traditional extractive industries have been replaced by new energy development (e.g. natural gas) which has not been translated into gains in personal income, jobs, and population (Gragson & Bolstad, Citation2006; Ohio River Valley Institute, Citation2021). Similarly in the agricultural sector, the size of direct sales and agri-tourism has increased (Jackson et al., Citation2015) while employment has not increased (Appalachian Regional Commission, Citation2019). However, its migration patterns do not perfectly correspond to previous findings which established that young migrants head to urban areas for economic opportunities. Our findings suggest that older adults are also likely to leave the area. This is counter to the widespread perception that elderlies are left behind in rural contributing to aging rural (Cromartie & Nelson, Citation2010), suggesting they also move to probably denser settlements that are accessible to social and assistance needs associated with life courses (e.g. medical services, public welfare; Li et al., Citation2021). Most out-migrants head to other rural areas and not necessarily to metropolitan or micropolitan areas. Given that rural, low-income destinations and stable rural areas only two net gaining clusters of migrants from other rural areas, rural residents in declining regions likely move to rural poverty pockets proximate to metropolitan or stable areas nearby micropolitan.
5.2. Policy and management implications
The analysis of land cover dynamics indicates that it is necessary to consider different policy approaches for regions with distinct migration patterns. First, the expansion of developed land across rural requires policy suggestions that consider the best possible transitions. The expansion is prominent at metropolitan peripheries where many new residents enter from suburban areas. Policies leading to denser development seem essential for the peri-urban regions, especially since urban sprawl continues to further its extent. Encouraging housing provision promptly might help limit the effects on forested land and slow the rise of housing prices in affluent rural neighborhoods, which will help alleviate poverty concentration in nearby places.
Second, specific areas might require special attention given their particular vulnerabilities and local conditions. Specifically, our findings indicate that Appalachian communities experience increasing unoccupied houses due to out-migration and rural sprawl (scattered low-density residential development) together in the process of rural exodus. Moreover, rural poverty pockets where diverse groups of people reside also pose challenges in land management. When considering that both processes are entangled with a weak regional economic base, there needs to be appropriate attention and resources so that the local community can find a balance between economic development and natural resource. For the forest-based communities where attention to maintain forest cover is required, in addition to efforts to regenerate the abandoned settlements, various measures such as medical service provision should be taken to prevent out-migration of the elderly to other rural areas.
6. Conclusions
Our results clarify the benefits of fine-grain analysis on rural migration. As people tend to move to locations proximate to where they lived previously (Cadwallader, Citation1992; Greenlee, Citation2019), zooming into migration between census tracts allows capturing rural-to-rural and micropolitan-to-rural patterns that otherwise would be aggregated as an intra-county move. Moreover, recognizing selective migration by household characteristics enables understanding processes. In doing so, we identify solid bidirectional connections between places reconfiguring the rural landscape in a distinct way. For instance, urban peripheries have grown due to in-migration from metro suburban areas, while rural poverty pockets scattered at the urban fringe have gained low-income families from both rural and metro urban areas. Dynamics of agricultural and forest-based remote rural areas have been driven by intra-rural and micropolitan migration. The share of developed land increased, and agricultural land decreased, regardless of the migration pattern, while ecological regeneration according to out-migration was rarely observed. Nevertheless, the heterogeneous population dynamics require different land management strategies for nature preservation.
Quantifying and mapping such dynamics not only gives some broad outlines of rural migration and land cover change but also raises new questions for further research. For example, how the spatially scattered form of poverty pockets has been shaped, what drives the interactions between micropolitan and rural, and what residential preferences rural movers that are differentiated from urban movers need to be further identified.
Supplemental Material
Download MS Word (3.8 MB)Disclosure statement
No potential conflict of interest was reported by the author(s).
Supplementary data
Supplemental data for this article can be accessed here
Notes
1. An MSA, according to the definition of OMB (Office of Management and Budget, Citation2010), comprises at least one urbanized area that has a population of more than 50,000 and adjacent outlying areas having a high degree of integration with the core in terms of commuting patterns. Ohio State intersects with a total of 13 MSAs including Columbus, Cleveland-Elyria, and Cincinnati.
2. NLCD offers land cover for the years 2001, 2003, 2006, 2008, 2011, 2013, and 2016. We selected data for 2008 and 2016 in order to match the period of land cover change with that of the migration data while capturing the long term trend around a decade.
3. Six land cover categories were excluded: open water, barren land, shrub/scrub, grassland/herbaceous, woody wetlands, and emergent herbaceous wetland.
4. It should be noted that excludes intra-type conversions. Given decreasing pastureland and increasing cropland (Supplementary Figure 7) with the overall decrease in agricultural land, conversions from pastureland to cropland take up the highest share (Lark et al., Citation2020). Additionally, more than 60% of the developed-to-agricultural land conversions were from developed, open space.
References
- Allen, M. (2017). Factor analysis: Varimax rotation. The SAGE Encyclopedia of Communication Research Methods, 10(9781483381411),191, 532–533. https://doi.org/10.4135/9781483381411.n191
- Auch, R.F., & Laingen, C. (2015). Having it both ways? Land use change in a U.S. midwestern agricultural ecoregion. The Professional Geographer, 67(1), 84–97. https://doi.org/10.1080/00330124.2014.921015
- Axle, D. (2021). U.S. historical consumer database (archive year 2008 to 2016).
- Beale, C. L., & United States. (1976). The revival of population growth in nonmetropolitan America. Washington: U.S. Dept. of Agriculture, Economic Research Service
- Becot, F., Inwood, S., Jackson-smith, D., & Katchova, A. (2020). The Status and Changing Face of Ohio Agriculture: Summary of Ohio Farm Trends 1997–2017. College of food, agricultural, and environmental sciences, SENR technical report. The Ohio State University.
- Bell, A.R., Caviglia-Harris, J.L., & Cak, A.D. (2015). Characterizing land-use change over space and time: Applying principal components analysis in the Brazilian legal amazon. Journal of Land Use Science, 10(1), 19–37. https://doi.org/10.1080/1747423X.2013.832427
- Bell, S., Alves, S., de Oliveira, E.S., & Zuin, A. (2010). Migration and land use change in Europe: A review. Living Reviews in Landscape Research, 4(1), 1–49. https://doi.org/10.12942/lrlr-2010-2
- Brown, D.G., Johnson, K.M., Loveland, T.R., & Theobald, D.M. (2005). Rural land-use trends in the conterminous United States, 1950-2000. Ecological Applications, 15(6), 1851–1863. https://doi.org/10.1890/03-5220
- Brown, D.G., Robinson, D.T., An, L., Nassauer, J.I., Zellner, M., Rand, W., Riolo, R., Page, S.E., Low, B., & Wang, Z. (2008). Exurbia from the bottom-up: Confronting empirical challenges to characterizing a complex system. Geoforum, 39(2), 805–818. https://doi.org/10.1016/j.geoforum.2007.02.010
- Bucholtz, S., Molfino, E., & Kolko, J. (2020). The Urbanization Perceptions Small Area Index: An Application of Machine Learning and Small Area Estimation to Household Survey Data Washington, DC: U.S. Department of Housing and Urban Development. https://www.huduser.gov/portal/sites/default/files/docs/UPSAI_forWeb.docx
- Burton, L.M., Lichter, D.T., Baker, R.S., & Eason, J.M. (2013). Inequality, family processes, and health in the “new” rural America. American Behavioral Scientist, 57(8), 1128–1151. https://doi.org/10.1177/0002764213487348
- Cadwallader, M. (1992). Migration and residential mobility: macro and micro approached. The University of Wisconsin Press.
- Carr, D. (2009). Population and deforestation: Why rural migration matters. Progress in Human Geography, 33(3), 355–378. https://doi.org/10.1177/0309132508096031
- Census Bureau, U.S. (2016). American Community Survey (ACS) 5-year estimates. https://www.census.gov/programs-surveys/acs/technical-documentation/table-and-geography-changes/2016/5-year.html
- Clark, J.K., McChesney, R., Munroe, D.K., & Irwin, E.G. (2009). Spatial characteristics of exurban settlement pattern in the United States. Landscape and Urban Planning, 90(3–4), 178–188. https://doi.org/10.1016/j.landurbplan.2008.11.002
- Commission, A.R. (2019). Industrial make-up of the Appalachian region: Employment and earnings, 2002-2017. November, 2002–2017.Washington DC: The Appalachian Regional Commission. https://www.arc.gov/research/researchreportdetails.asp?REPORT_ID=161
- Cromartie, J., & Nelson, P. (2010). Baby boom migration and its impact on rural America?Washington, DC: United States Department of Agriculture, Economic Research Service, Rural America: Issues and Developments, 79, 29–58. https://doi.org/10.2139/ssrn.1492884
- Dewitz, J. (2019). National Land Cover Database (NLCD) 2016 products (ver. 2.0, July 2020). U.S. Geological Survey data release. https://doi.org/10.5066/P96HHBIE
- Drummond, M.A., Griffith, G.E., Auch, R.F., Stier, M.P., Taylor, J.L., Hester, D.J., Riegle, J.L., & McBeth, J.L. (2017). Understanding recurrent land use processes and long-term transitions in the dynamic south-central United States, ca. 1800 to 2006. Land Use Policy, 68(May), 345–354. https://doi.org/10.1016/j.landusepol.2017.07.061
- Foulkes, M., & Newbold, K.B. (2008). Poverty catchments: Migration, residential mobility, and population turnover in impoverished rural Illinois communities. Rural Sociology, 73(3), 440–462. https://doi.org/10.1526/003601108785766525
- Foulkes, M., & Schafft, K.A. (2010). The impact of migration on poverty concentrations in the United States, 1995-2000. Rural Sociology, 75(1), 90–110. https://doi.org/10.1111/j.1549-0831.2009.00002.x
- Gallemore, C., Munroe, D., & van Berkel, D. (2018). Rural-to-urban migration and the geography of absentee non-industrial private forest ownership: A case from southeast Ohio. Applied Geography, 96(June2017), 141–152. https://doi.org/10.1016/j.apgeog.2018.05.010
- Glasmeier, A. (2018). High-tech policy, high-tech realities: The spatial distribution of high-tech industry in America 1. In J. Schmandt & R. Wilson (Eds.), Growth policy in the age of high technology (pp. 67–96). Routledge.
- GLP. (2005). Science plan and implementation strategy. IGBP Report No. 53/IHDP Report No. 19, 64. www.glp.colostate.edu
- Golding, S.A., & Winkler, R.L. (2020). Tracking urbanization and exurbs: migration across the rural–urban continuum, 1990–2016. Population Research and Policy Review, 39(5), 835–859. https://doi.org/10.1007/s11113-020-09611-w
- Gragson, T.L., & Bolstad, P.V. (2006). Land use legacies and the future of Southern Appalachia. Society & Natural Resources, 19(2), 175–190. https://doi.org/10.1080/08941920500394857
- Greenlee, A.J. (2019). Assessing the intersection of neighborhood change and residential mobility pathways for the Chicago metropolitan area (2006–2015). Housing Policy Debate, 29(1), 186–212. https://doi.org/10.1080/10511482.2018.1476898
- Hammer, R. B., & Winkler, R. L. (2006). Housing affordability and population chang in the upper midwestern north woods. In Population change and rural society (pp. 293–309). Springer, Dordrecht.
- Irwin, E.G. Bell, K.P., Bockstael, N.E., Newburn, D.A., Partridge, M.D., & Wu, J. (2009). The economics of urban-rural space. Annual Review of Resource Economics, 1(1), 435–459. https://doi.org/10.1146/annurev.resource.050708.144253
- Irwin, E.G. & Bockstael, N.E. (2007). The evolution of urban sprawl: Evidence of spatial heterogeneity and increasing land fragmentation. Proceedings of the National Academy of Sciences of the United States of America, 104(52), 20672–20677. https://doi.org/10.1073/pnas.0705527105
- Jackson, C., Perrett, A., & Descieux, K. (2015). Agriculture and Food System Trends in the Appalachian Region: 2007-2012 (Issue July). Appalachian Regional Commission. https://www.arc.gov/assets/research_reports/FoodSystemTrendsReport2015FINAL3.pdf
- Janis, L., William, A., Roger, F., & Mark, A. (2015a). Status and trends of land change in the Eastern United States-1973 to 2000.Washington: DC, United States Geological Survey Professional Paper 1794-D. https://doi.org/10.3133/pp1794B
- Janis, L., William, A., Roger, F., & Mark, A. (2015b). Status and trends of land change in the great plains of the United States-1973 to 2000. Washington, DC: United States Geological Survey Professional Paper. 1794-C. https://doi.org/10.3133/pp1794B
- Johnson, K. M. 1999. Th e Rural Rebound. PRB Reports on America, 1(3). Washington, D. C.: Population Reference Bureau
- Johnson, K. M., & Beale, C. L. (1994). The Recent Revival of Widespread Population Growth in Nonmetropolitan Areas of the United States 1. Rural Sociology, 59(4), 655–667.
- Johnson, K. M., & Fuguitt, G. V. (2000). Continuity and change in rural migration patterns, 1950–1995. Rural Sociology, 65(1), 27–49
- Johnson, K.M., & Lichter, D.T. (2019). Rural depopulation: growth and decline processes over the past century. Rural Sociology, 84(1), 3–27. https://doi.org/10.1111/ruso.12266
- Johnson, K.M., & Stewart, S.I. (2005). Recreation, amenity migration and urban proximity. In G.P. Green, S.C. Deller, and M. D. D (Eds.), Amenities and rural development. Edward Elgar Publishing, 177–196. https://doi.org/10.4337/9781845428075.00018
- Johnson, K.M., & Winkler, R.L. (2015). Migration signatures across the decades: Net migration by age in U.S. counties, 1950-2010. Demographic Research, 32(3), 1065–1080. https://doi.org/10.4054/DemRes.2015.32.38
- Kandel, W., Henderson, J., Koball, H., & Capps, R. (2011). Moving up in rural America: Economic attainment of nonmetro latino immigrants. Rural Sociology, 76(1), 101–128. https://doi.org/10.1111/j.1549-0831.2011.00047.x
- Kaplan, G., & Schulhofer-wohl, S. (2015). Understanding the long-run decline interstate migration. Federal Reserve Bank of Minneapolis.
- Kochhar, R. (2018). The American middle class is stable in size, but losing ground financially to upper-income families. Pew Research Center2. https://www.pewresearch.org/fact-tank/2018/09/06/the-american-middle-class-is-stable-in-size-but-losing-ground-financially-to-upper-income-families/
- Kondo, M.C., Rivera, R., & Rullman, S. (2012). Protecting the idyll but not the environment: Second homes, amenity migration and rural exclusion in Washington State. Landscape and Urban Planning, 106(2), 174–182. https://doi.org/10.1016/j.landurbplan.2012.03.003
- Lark, T.J., Spawn, S.A., Bougie, M., & Gibbs, H.K. (2020). Cropland expansion in the United States produces marginal yields at high costs to wildlife. Nature Communications, 11(1), 1–11. https://doi.org/10.1038/s41467-020-18045-z
- Law, J., & McSweeney, K. (2013). Looking under the canopy: Rural smallholders and forest recovery in Appalachian Ohio. Geoforum, 44, 182–192. https://doi.org/10.1016/j.geoforum.2012.09.008
- Li, S. (Alex), Hu, W., & Guo, F. (2021). Recent relocation patterns among older adults in the United States. Journal of the American Planning Association. May 20 , 1–15. https://doi.org/10.1080/01944363.2021.1902842
- Lichter, D.T., & Cimbulak, L. (2010). Family change and poverty in appalachia. Lexington, KY: University of Kentucky.University of Kentucky Center for Poverty Research Discussion Paper Series. http://uknowledge.uky.edu/ukcpr_papers/54/
- Lichter, D.T., & Johnson, K.M. (2007). The changing spatial concentration of America’s rural poor population. Rural Sociology, 72(3), 331–358. https://doi.org/10.1526/003601107781799290
- Lichter, D.T. (2012). Immigration and the new racial diversity in Rural America*. Rural Sociology, 77(1), 3–35. https://doi.org/10.1111/j.1549-0831.2012.00070.x
- MacDonald, J.M., Korb, P., & Hoppe, R.A. (2015). Farm size and the organization of U.S. crop farming.Washington, DC: United States Department of Agriculture. USDA Economic Research Report, (152), 1–73 https://www.ers.usda.gov/webdocs/publications/45108/39359_err152.pdf
- MacQueen, J. (1967). Some methods for classification and analysis of multivariate observations. Proceedings of the fifth Berkeley symposium on mathematical statistics and probability, (Los Angeles, CA: University of California Press), 281–297.
- McCool, S.F., & Kruger, L.E. (2003). Human migration and natural resources: Implications for land managers and challenges for researchers. USDA Forest Service - General Technical Report PNW ,(Washington, DC: United States Department of Agriculture), 580, 1–19. https://doi.org/10.2737/PNW-GTR-580
- McGranahan, D.A. (2008). Landscape influence on recent rural migration in the U.S. Landscape and Urban Planning, 85(3–4), 228–240. https://doi.org/10.1016/j.landurbplan.2007.12.001
- Morzillo, A.T., Colocousis, C.R., Munroe, D.K., Bell, K.P., Martinuzzi, S., Van Berkel, D.B., Lechowicz, M.J., Rayfield, B., & McGill, B. (2015). “Communities in the middle”: Interactions between drivers of change and place-based characteristics in rural forest-based communities. Journal of Rural Studies, 42 (December) , 79–90. https://doi.org/10.1016/j.jrurstud.2015.09.007
- Mulligan, G.F., & Vias, A.C. (2006). Growth and change in U.S. micropolitan areas. Annals of Regional Science, 40(2), 203–228. https://doi.org/10.1007/s00168-005-0034-6
- Munroe, D.K., Crandall, M.S., Colocousis, C., Bell, K.P., & Morzillo, A.T. (2019). Reciprocal relationships between forest management and regional landscape structures: Applying concepts from land system science to private forest management. Journal of Land Use Science, 14(2), 155–172. https://doi.org/10.1080/1747423X.2019.1607914
- Munroe, D.K., van Berkel, D.B., Verburg, P.H., & Olson, J.L. (2013). Alternative trajectories of land abandonment: Causes, consequences and research challenges. Current Opinion in Environmental Sustainability, 5(5), 471–476. https://doi.org/10.1016/j.cosust.2013.06.010
- Nickerson, C., Ebel, R., Borchers, A., & Carriazo, F. (2011). Major Uses of Land in the United States, 2007 (Issue Economic Information Bulletin Number 89, p. 67). United States Department of Agriculture.
- Office of Management and Budget. (2010). 2010 standards for delineating metropolitan and micropolitan statistical areas. Federal Register, 75(123), 37246–37252. https://www.federalregister.gov/documents/2010/06/28/2010-15605/2010-standards-for-delineating-metropolitan-and-micropolitan-statistical-areas
- Ohio River Valley Institute. (2021). Appalachia’s natural gas counties: The natural gas fracking boom and appalachia’s lost economic decade. https://ohiorivervalleyinstitute.org/wp-content/uploads/2021/02/Frackalachia-Report-update-2_12_01.pdf
- Olson, J.L., & Munroe, D.K. (2012). Natural amenities and rural development in new urban-rural spaces. Regional Science Policy & Practice, 4(4), 355–371. https://doi.org/10.1111/j.1757-7802.2012.01077.x
- Pan, H., Chen, S., Gao, Y., Deal, B., & Liu, J. (2020). An urban informatics approach to understanding residential mobility in Metro Chicago. Environment and Planning B: Urban Analytics and City Science, 47(8), 1456–1473. https://doi.org/10.1177/2399808320924437
- Plane, D.A., & Jurjevich, J.R. (2009). Ties that no longer bind? The patterns and repercussions of age-articulated migration. The Professional Geographer, 61(1), 4–20. https://doi.org/10.1080/00330120802577558
- Radel, C., Jokisch, B.D., Schmook, B., Carte, L., Aguilar-Støen, M., Hermans, K., Zimmerer, K., & Aldrich, S. (2019). Migration as a feature of land system transitions. Current Opinion in Environmental Sustainability, 38(July), 103–110. https://doi.org/10.1016/j.cosust.2019.05.007
- Radeloff, V.C., Hammer, R.B., & Stewart, S.I. (2005). Rural and suburban sprawl in the U.S. Midwest from 1940 to 2000 and its relation to forest fragmentation. Conservation Biology, 19(3), 793–805. https://doi.org/10.1111/j.1523-1739.2005.00387.x
- Rhemtulla, J.M., Mladenoff, D.J., & Clayton, M.K. (2007). Regional land-cover conversion in the U.S. upper Midwest: Magnitude of change and limited recovery (1850-1935-1993). Landscape Ecology, 22(SUPPL. 1), 57–75. https://doi.org/10.1007/s10980-007-9117-3
- Robinson, L., Newell, J.P., & Marzluff, J.M. (2005). Twenty-five years of sprawl in the Seattle region: Growth management responses and implications for conservation. Landscape and Urban Planning, 71(1), 51–72. https://doi.org/10.1016/j.landurbplan.2004.02.005
- Salamon, Sonya. Newcomers to old towns: Suburbanization of the heartland. University of Chicago Press, 2007.
- Seto, K.C., Reenberg, A., Boone, C.G., Fragkias, M., Haase, D., Langanke, T., Marcotullio, P., Munroe, D.K., Olah, B., & Simon, D. (2012). Urban land teleconnections and sustainability. Proceedings of the National Academy of Sciences of the United States of America, 109(20), 7687–7692. https://doi.org/10.1073/pnas.1117622109
- Slack, T., & Jensen, L. (2020). The changing demography of rural and small-town America. Population Research and Policy Review, 39(5), 775–783. https://doi.org/10.1007/s11113-020-09608-5
- Smith, M.N., Winkler, R.L., & Johnson, K.M. (2016). How migration impacts rural America (issue brief no. 03-16). Population Trends in Post-Recession Rural America, A Publication Series of the W3001 Research Project , Madison, WI: Applied Population Laboratory, University of Wisconsin. http://w3001.apl.wisc.edu/pdfs/b03_16
- U.S. Census Bureau and U.S. Department of Housing and Urban Development (2017). Urban Perceptions Small Area Index. Retrieved 2021 from https://www.huduser.gov/portal/AHS-neighborhood-description-study-2017.html
- United States Department of Agriculture. (2005). Overview of Ohio. Natural Resources Conservation Service. https://www.nrcs.usda.gov/wps/portal/nrcs/oh/about/outreach/nrcs144p2_029664/
- United States Department of Agriculture. (2018). Rural America at a glance: 2018 Edition. In United States Department of Agriculture, Economic Research Service (Issue Economic Information Bulletin 200). https://doi.org/10.2139/ssrn.2367409
- US Census Bureau. (2015). Census tracts. In Geographic products branch US census bureau, (Washington, DC: United States Census Bureau.). https://doi.org/10.4135/9781452225272.n18
- USDA Economic Research Service. (2020). Rural-urban continuum codes. (Washington, DC: United States Department of Agriculture.).
- Van Berkel, D.B., Munroe, D.K., & Gallemore, C. (2014). Spatial analysis of land suitability, hot-tub cabins and forest tourism in Appalachian Ohio. Applied Geography, 54 (October) , 139–148. https://doi.org/10.1016/j.apgeog.2014.07.012
- Vias, A.C. (2012). Micropolitan areas and urbanization processes in the US. Cities, 29(SUPPL. 1), S24–S28. https://doi.org/10.1016/j.cities.2011.12.005
- Vining Jr, D. R., & Strauss, A. (1977). A demonstration that the current deconcentration of population in the United States is a clean break with the past. Environment and planning A, 9(7), 751–758.
- Wang, Y., Lee, B., & Greenlee, A. (2021). The role of smart growth in residential location choice: Heterogeneity of location preferences in the Chicago region. Journal of Planning Education and Research, May, pp. 1-18. https://doi.org/10.1177/0739456X211017652
- White, E.M., Morzillo, A.T., & Alig, R.J. (2009). Past and projected rural land conversion in the US at state, regional, and national levels. Landscape and Urban Planning, 89(1–2), 37–48. https://doi.org/10.1016/j.landurbplan.2008.09.004