
ABSTRACT
Most of the peri-urban areas in European cities are characterized by a mix of rural and urban uses. Despite being sprawled areas, they provide opportunities for improving green connectivity at a multiscale level, between urban-green and natural or agricultural peripheral extensions. Several land monitoring services, both at national and European levels, have become key tools to perform the analysis and diagnosis of its transformation patterns and dynamics. However, the accuracy of available datasets is typically not adequate for approaching the spatial complexity of these areas. This research proposes a methodology to improve precision by combining land use datasets and applies it to a specific study case, the peri-urban Spanish Mediterranean Huertas, highly valued agricultural and cultural landscapes under an intense urban pressure. Findings reveal that this method detects and solves inaccuracies, and it is easily replicable in different spatial contexts, becoming an effective tool for decision-making processes.
1. Introduction. LULC in the peri-urban areas
Land use and land cover – LULC – changes are a central issue within environmental land policies regarding sustainability (Banzhaf et al., Citation2017; Lai et al., Citation2017). Literature on the topic is extensive and several authors agreed on highlighting the fact that spatiotemporal transformation processes are difficult to measure because of the different speed and magnitude of those LULC changes (Borgogno-Mondino et al., Citation2015; Lambin & Geist, Citation2006; Salem et al., Citation2020). Specifically, the transition zones between urban tissue and the peri-urban territory are complex areas, generally perceived as a chaotic mixture of land uses distributed in highly fragmented land plots, which are under urban metropolitan pressure (Meeus & Gulinck, Citation2008). Furthermore, there is an increasing process of environmental degradation and abandonment of traditional productive activities, such as agriculture. It has a significant impact on land use and becomes a concerning topic widely approached by academic researchers and administrations (Levers et al., Citation2018).
For decades, the integration of urban and rural areas has been outlined as a relevant issue by European Commission (European Environment Agency, Citation2020c), driving several initiatives and projects such as RURBAN (Partnership for sustainable urban-rural development; European Union, Citation2012) or the H2020 project REPAiR (REsource Management in Peri-urban Areas: Going Beyond Urban Metabolism; TU Delft (coord), Citation2020), among others. These examples give evidence of the interest and relevance of creating a place-based development strategy in the interface of peri-urban areas (De Falco et al., Citation2019). Additionally, they show the advantage of further enhancing the connectivity between urban green infrastructure and peripheral areas, providing new opportunities for these peri-urban areas acting as ecosystem services.
It is argued that land cover datasets are one of the basic sources of information for land use change research, including multidisciplinary and multiscale studies. The analysis of LULC changes provides both quantitative and qualitative description of the spatiotemporal transformation process (Antrop, Citation2004). For example, considering a) the identification of factors and causes of these dynamics of change (Costanza & Ruth, Citation1998; Ruiz-Martinez et al., Citation2020), b) the impact assessment of these transformations from an ecological perspective (Botequilha Leitão & Ahern, Citation2002), and c) the prediction of future use scenarios (Minetos & Polyzos, Citation2009) to better target land use policy formulation (Dwyer, Citation2011; Pickard & Meentemeyer, Citation2019) mainly connected with green infrastructure conceptualization (Benton-Short et al., Citation2019).
Importantly, the existing research is developing different approaches and methods to tackle with these peri-urban fringe unbalances and the determination of local factors. Indeed, in Europe, some of the current researching topics based on LULC dataset analysis are focused on: i) the study of land-use intensity with the definition of new comprehensive analytical framework (Erb et al., Citation2013; Tang et al., Citation2020; Zeng et al., Citation2005), ii) the identification and mapping of high nature value farmland by combining several datasets (Bonato et al., Citation2019), iii) the definition of landscape types using CORINE Land Cover (Vizzari et al., Citation2018), iv) the assessment of total energy input per hectare (Rega et al., Citation2020), or v) the definition of land use indicators based on the neuronal network and self-organizing map approaches (Van der Zanden et al., Citation2016).
However, the existing approaches to peri-urban agricultural – PUA – areas are mostly misrepresented due to the weak accuracy of LULC datasets in these territories, caused by the diverse and small-scale changes. This is a critical limitation because the two last features are key to better understand the spatial configuration, which determine not only the perception but also the possibilities of defining new planning strategies (Tuanmu & Jetz, Citation2014). Although the precise characterization of PUA areas is essential to improve policies and planning objectives based on evidence, current fragmentation indicators have significant weaknesses in the spatial unit of analysis that may explain changes in these areas (Morán Alonso et al., Citation2017).
This research assesses whether the use of different LULC datasets helps to increase their accuracy in PUA areas. If so, it would be possible to provide new data that helped in the definition of urban planning strategies in these areas with more detailed information about the urban and rural dynamics. The method has been specifically tested on three Spanish Mediterranean Huertas as a case study. Huertas are ancestral highly productive agricultural landscapes, and they represent an important environmental, cultural, and productive asset, which is under urban pressure. This innovative method contributes to better identifying and visualizing changes oin the structure of the territory, considering land fragmentation. Moreover, based on a lay-overlapping system, this study provides a working tool, which intertwines the most widely used land-monitoring datasets among those currently available. Therefore, it contributes to data harmonization on different factors of the operational area and, as a result, to reducing significant uncertainties revealed in the analysis of current land cover datasets.
2. Presenting the study cases and selected datasets
Peri-urban Mediterranean Huertas as a PUA benchmark
Huerta is defined as one of the thirteen acknowledged European landscapes, as stated in the Dobris Report developed by the European Environment Agency (Citation1998). Indeed, it is considered as a unique heritage asset and a key component of the cultural identity, together with other traditional Mediterranean agricultural areas (CESE, Citation2005). In the European Mediterranean basin, Huertas are intimately linked to traditional urban settlements' location and growth. Nowadays, these PUA areas conflict with new urban activities, which are often accompanied by an environmental decline due to the loss and fragmentation of agricultural land plots (Font, Citation2004; Garcia-Marin et al., Citation2020; Vallés-Planells et al., Citation2020; Verdú-Vázquez et al., Citation2021).
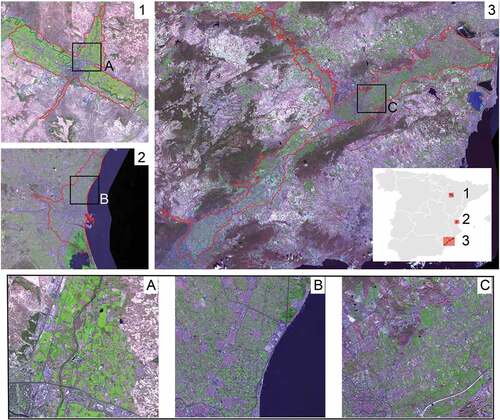
This research explores the peri-urban Spanish Mediterranean Huertas as a case study, which are located in three different areas along the Mediterranean basin (): 1) Huerta de Zaragoza (38,061.6 ha) in the metropolitan area of the homonymous city (Zazo, Citation2010); 2) L’ Horta de Valencia (23,129.1 ha), located in the metropolitan area of Valencia city (Romero & Melo, Citation2016); and 3) Huerta de Murcia-Alicante (83,491.9 ha), which extends over the metropolitan area of Murcia city (Cánovas-Molina et al., Citation2021) and the polynuclear area of southern Alicante province (García-Mayor, Citation2017). To date, Huerta areas have been comprehensively studied as separate cases (Temes & Moya, Citation2016), but there is still little research addressing these areas from an intertwined and multiscale approach (Martí & García-Mayor, Citation2020).
Figure 1. Case study locations. PUA Huertas: 1. Huerta de Zaragoza; 2. L’ Horta de Valencia; and 3. Huerta de Murcia-Alicante. Base map source from Sentinel-2 (L2A) data-Copernicus program, 2018 (Instituto Geográfico Nacional, Citation2018). Contains modified data Copernicus Sentinel.
LULC datasets
Three land-monitoring datasets have been selected to evaluate land cover classification and spatiotemporal analysis of the PUA landscape in the Mediterranean:1) CORINE Land Cover – CLC – as a European scale LULC reference map (European Environment Agency, Citation2020a), 2) SIOSE – Information System of Land cover/Land use in Spain – as national level LULC map (Urbana & Ministerio de Transportes, Citation2020), and 3) SIGPAC – Geographic Information System of Agricultural Parcels of Spain – as the Spanish regional level dataset, developed to assist different agents in the application of EU Common Agricultural Policy for land agricultural subsidies (Ministerio de Agricultura, Citation2015).
shows selected datasets' basic features, reflecting substantial differences in scale and mapping accuracy among all three, distinguishing SIGPAC as the more accurate with the larger scale, 1:5,000. Although the SIGPAC dataset provides deeper details about agricultural plots, little is gathered about urban uses. In contrast, SIOSE and CLC compilations include more information about urban uses and dynamics at different scales, 1: 25,000 and 1: 100,000, respectively (Büttner et al., Citation2017; Urbana & Ministerio de Transportes, Citation2020), but little about small-scale LULC changes in the agricultural tissue.
Table 1. CLC, SIOSE, and SIGPAC datasets' basic features (European Environment Agency, Citation2020b; Ministerio de Agricultura, Citation2015; urbana & Ministerio de Transportes, Citation2020). CLC, SIOSE and SIGPAC allow to publish this content.
Each dataset is generated using different methodologies. At the European level, CLC has traditionally been generated from satellite image photointerpretation, but since 2006, some countries have generated the information from generalization techniques using more detailed thematic maps (Hazeu et al., Citation2016). In the Spanish case, since 2012, CLC has been updated by applying generalization techniques from SIOSE and complemented with photointerpretation. The temporal analysis varies depending on each dataset: CLC covers from 1990 to present time, while SIOSE and SIGPAC provide data since 2005. All of them are regularly updated at different time intervals: CLC every six years, SIOSE every three years, and SIGPAC annually.
Additionally, the consideration of each dataset’s classification system is considered an important key point to understand the method definition: CLC has a hierarchical classification system that uses unique codes, organized in different grouping levels; SIOSE has an object-oriented system in which each polygon is defined by an homogeneous land coverage, as a result of different single coverages in the proportions expressed in the dataset (Equipo técnico Nacional SIOSE, Citation2018); and SIGPAC defines a classification of unique codes for agricultural uses per plot that are declared annually by farmers (García, Citation2016). All these differences imply variations in the dataset results’ accuracy and consistency.
reports the comparation of the agricultural and artificial area extensions in PUA Huertas among CLC and SIOSE datasets, using their first level of cover aggregation. The oldest and newest updates of these datasets that match in time are used (2006–2005 and 2018–2015) to explore land cover changes.
Table 2. Comparison of artificial and agricultural areas among CLC and SIOSE by selecting the major percentage of simple coverage in each polygon.
In the PUA Huertas analyzed, the spatial analysis shows a great heterogeneity of farmland, but neither of both datasets – CLC and SIOSE – reflect dwellings’ occupancy, which is one of the specific spatial patterns of these areas. Scattered dwellings are included as a generic ‘artificial surface’, mainly when they are near the consolidated urban tissue, or as ‘agricultural coverage’ when there is a greater discontinuity and crop plots are prevalent (). The lack of accuracy in the CLC dataset for addressing analysis of fallow or abandoned farmland is pointed by some authors (Levers et al., Citation2018), and others highlight the existence of inconsistencies between CLC and SIOSE or show that data provided by CLC and SIOSE datasets are very similar at the national level (García-Álvarez & Camacho Olmedo, Citation2017). Consistent with previous research, this study finds an increased accuracy assessing land use changes when combining multiscale datasets because more nuances and greater differences are possibly determined at the local and regional level (Olazabal & Bellet, Citation2018).
Figure 2. Overlapped datasets from bottom to top: (1) PNOA satellite image, 2007; (2) CLC 2006; (3) SIOSE 2005; (4) SIGPAC 2005; and (5) resulting mapping with fine-grain data for addressing PUA Huertas.
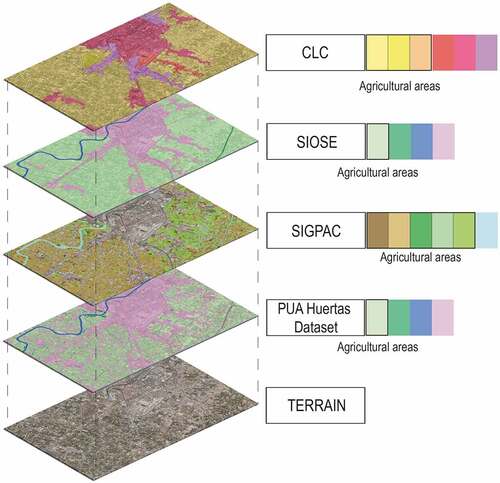
All the above-mentioned justifies the selection of SOISE and SIGPAC as the most suitable datasets to address the harmonization process with the aim of increasing accuracy within the PUAs’ spatial patterns definition ().
3. Harmonization process applied to PUA Huertas
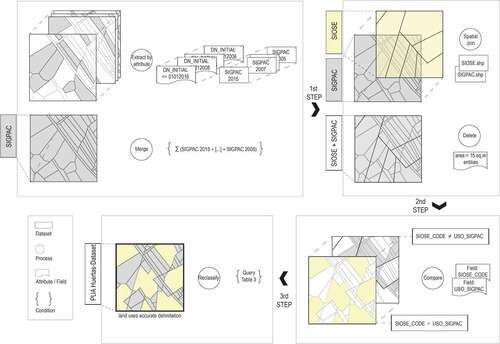
The method proposes a harmonization of the SIOSE and SIGPAC datasets in the PUA Huertas () by exploring the classification provided by both datasets and the coverage correspondence between the attributes of ‘SIOSE_CODE’ from the SIOSE dataset (Instituto Geográfico Nacional, Citation2016) and ‘USO_SIGPAC’ from the SIGPAC dataset. To be specific, this exploration is solved in a three-step process:
First, the spatial transformation among dataset polygons is performed obtaining a new polygon layer as an intersection of both datasets. This new layer comprises the predominant coverage from SIOSE and the use in SIGPAC. Additionally, to refine the data, SIGPAC polygons less than 15 m2 have been removed from the imputation model (Ministerio de Hacienda y Administraciones Públicas, Citation2013).
Second, the two attributes (‘SIOSE_CODE’ and ‘USO_SIGPAC’) are compared and those polygons where the values do not correspond to the same land coverage are identified.
Third, and finally, a reclassification of the coverages is performed, for those polygons previously identified. In this step, a semantic translation is performed based on a visual interpretation of these polygons from orthophotography. As a result, a classification for PUA Huertas is set up according to SIOSE nomenclature.
Figure 3. Conceptual workflow followed in the proposed methodology.
4. Results
This new dataset – PUA Huertas – includes an attribute for the classification coverage that is based on the SIOSE categories. However, this attribute considers the harmonized polygons (those with disparities between SIOSE and SIGPAC datasets) and includes new categories, according to SIGPAC information and visual interpretation. Considering this fact, the results in this section are presented in relation with two aspects: first, the analysis of how the harmonized dataset gives answer of detected discrepancies and second, the results of combining qualitative and quantitative analyses for assessing LULC changes in PUA Huertas from 2005 to 2015.
Dataset category harmonization: the qualitative perspective
The spatial complexity of PUA areas is reflected in the mismatches and aggregation inconsistencies detected in the identification and classification of small areas, mainly within the SIOSE dataset. In this study, discrepancies between land-use dataset classifications have turned into a clue to develop the harmonization (). Although the SIGPAC dataset focuses on the agricultural plots, in this method, it also helps to reclassify some artificial soils, such as ‘road’ (code CA) or ‘building categories’ (code ED) that were included into ‘agricultural land’ by SIOSE. This is because the smaller scale of SIGPAC provides a better accuracy to assess the agricultural land transformation. Other land coverages require a visual analysis, contrasting the SIOSE dataset with orthophotography, such as those reclassified as ‘unbuilt land’ (code 121). These areas were initially considered as ‘agricultural plots’ (code 200) in the SIOSE dataset because the urban transformation was not completed and as ‘urban areas’ (code ZU) in the SIGPAC dataset because the agricultural use was forsaken ().
Table 3. Summary of reclassification criteria applied between SIGPAC and SIOSE land cover categories.
Figure 4. Examples of the more accurate land classification provided by the harmonized PUA Huertas dataset (below) and considering initial datasets (above): (a) new artificial and other land use areas, (b) new agricultural areas, and (c) new plasticulture crops areas.
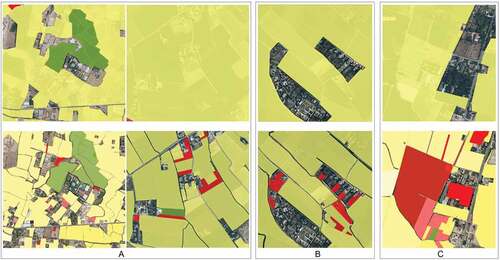
One of the most relevant findings is related to isolated buildings scattered in the agricultural land, which have required greater attention and deeper visual review. Generally, these constructions are classified in SIOSE as ‘artificial covers’ (100), either as ‘unbuilt land’ (121) and ‘other constructions’ (code 111; ). However, this proposed method has made possible the recovery of the agricultural use of some of these specific areas (). Indeed, although the concentration of buildings causes SIOSE to classify them as ‘artificial covers’, the application of this method reveals that some areas remain with their agricultural uses, specifically ‘citrus’ (codes CF and CI), ‘other woody crops’ (codes FS, FV, and FL), and ‘vineyards’ (codes VF and VI).
The SIGPAC ‘unproductive’ category (code IM) has also facilitated the identification of plots with agricultural plastic technologies (). In these cases, a new category, not previously considered by SIOSE, has been generated for ‘greenhouse and plasticulture crops’ (code IV). This category provides a more accurate land classification of those SIGPAC ‘greenhouses’ and SIOSE ‘arable land’ (code TA).
Outcomes of combining qualitative and quantitative analyses for assessing LULC changes in PUA Huertas
summarizes the total harmonized coverages obtained as a result of the application of this GIS-based method. This figure provides an overview of three different criteria: location of the PUA (left column), land coverages that have been reclassified according to SIGPAC codes into artificial and agricultural areas (middle column), and year from the retrieved data source that has been analyzed (right column).
Figure 5. Comparative diagram of the areas that have been amended in the definition of PUA Huertas for the three cases considered in 2005 and 2015.
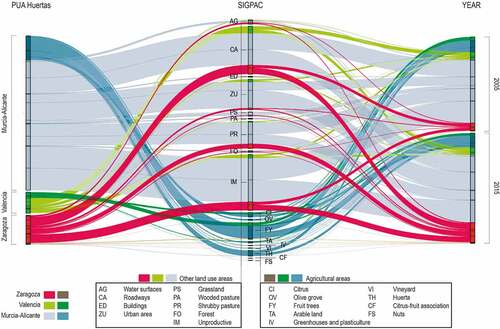
A further look into results, in correspondence with , reveals interesting issues to consider. First, the reclassification of land coverages into ‘artificial and other land uses’ (11,772.20 ha in 2005 and 14,167.70 ha in 2015) is significantly higher than the reclassification of land coverages into ‘agricultural uses’ (2,304.30 ha in 2005 and 2,316.20 ha in 2015). This means that more of the 80% (83.63 in 2005 and 85.95 in 2015) of the harmonization has focused on artificial and other land use areas, and less than 20% (16.37 in 2005 and 14.05 in 2015) has focused on agricultural areas. Second, considering the PUA study cases, the applied methodology has reclassified a percentage close to 10 and 11% of the total studied area in 2005 and 2015, respectively. These changes have been included in the new harmonized PUA Huertas dataset.
With respect to artificial and other land use coverages, ‘unproductive land’ (code IM) and ‘roadways’ (code CA) represent the categories with more inaccuracies detected in land use classification. As reveals, the applied method has allowed the reclassification of up to 8,347.80 ha (3,953.1 and 4,393.6 in 2005 and 2015, respectively) IM category (rating 27.3% of the total harmonized surface) and 7,152.40 ha (3,394.9 and 3,757.4 in 2005 and 2015, respectively) CA category (rating 23.4% of the total harmonized areas). Once again, the fragmentation and small size of these land polygons made them negligible to be identified by the SIOSE dataset. It is important to refer that PUA Huertas harmonized 4,577.6 ha (1,578.5 and 2,999.1 in 2005 and 2015, respectively) of ‘urban areas’ in SIGPAC (code ZU) – reaching 15.0% of the total reclassification – which were initially considered as crops by the SIOSE dataset. However, findings reveal that they constitute unbuilt soils in urbanized areas, also lacking from any agricultural use.
Regarding the agricultural land coverage, the study has detected a large extension of plots with isolated buildings located within them, frequently considered in the SIOSE dataset as artificial coverage without agricultural use. However, the real characterization of these plots corresponds to ‘fruit trees’ (code FY), ‘citrus orchards’ (code CI), and ‘Huerta’ (code TH). These results represent an important key point for performing an accurate landscape characterization.
Additionally, the method introduces greater precision in the measurement of landuse transformations in PUA Huertas territory in the 2005–2015 decade. Results reveal that between 2005 and 2015, the agricultural landuse area was reduced by 2.6% (75,244.3 ha). This amended extension represents 52.0% of the total PUA Huertas. However, the artificial surface increased by 3.4% during the decade 2005–2015, reaching the 34.9% (50,422.70 ha) of the total area in the same period ( and ). If the landcover dataset harmonization that is proposed in this article had not been considered, the artificial surface would have decreased by 6.8%, according to the SIOSE dataset, or increased by less than 1%, according to the CLC dataset (). However, these values do differ from real agricultural land transformation patterns that can be recognized in field work, and the relevance of this proposed GIS-based method and importance of achieved results arise.
Table 4. Comparison of artificial and agricultural areas considering the proposed PUA Huertas dataset.
Figure 6. Agricultural cover changes in PUA Huertas from 2005 to 2015.
Between 2005 and 2015, Huerta de Zaragoza was the one that suffered the greatest loss of agricultural area – 6.5% –, while Huerta de Murcia-Alicante and L’ Horta de Valencia case studies show a loss within a range between 1% and 2% of agricultural coverage, respectively. However, the increase of artificial land has a similar growth ratio in the three case studies, ranging within 3.2% to 4.0% rates.
When exploring the subcategories that integrate the agricultural coverage, results reveal important insights. ‘Tree crops’ (LFN in PUA Huertas categories, based in SIOSE nomenclature) – excluding ‘citrus trees’ (code LFC) –, ‘rice crops, and olive groves’ (code LOL) have increased the number of hectares cultivated, contrasting with ‘citrus trees’ (code LFC) and other arable crops decrease. Land cover changes over 2005–2015 decade are globally represented in . Changes regarding specific categories within agricultural landcover and increments and decrements are represented by solid or dashed lines, respectively.
5. Discussion
In developing this method, several specific issues related to the original LULC datasets and the harmonization process needed to be addressed. Recent literature gives reason for some of these issues, from a general perspective (Nedd et al., Citation2021; Yang et al., Citation2017). However, from a more specific perspective, considering the specificities of the PUA Huerta landscape, this study covers the following three issues.
The first one is related to the inaccuracies of LULC classifications in areas where artificial and agricultural uses coexist. In this PUA Huerta landscape, it is aggravated by the highly mixed and fragmented plot system. The proposed method enables a better exploration of the dynamics of change that the one provided by SIOSE or SIGPAC datasets if they are evaluated individually (Bonato et al., Citation2019; Borgogno-Mondino et al., Citation2015).
A second one focuses on the semantic inconsistency of the original datasets (Baudoux et al., Citation2021). This semantic consistency is revealed in each of the datasets. For instance, a similar mix of agricultural plots and sprawled dwellings is categorized differently if we consider the SIOSE dataset of Huerta de Murcia-Alicante and compare Murcia and Alicante areas (different regional administrative boundaries). Although it is a continuous Huerta, the fact is that the dataset has been developed by different teams and semantic inconsistencies arise (Ros Sempere & García Martín, Citation2016). This fact provides enough evidence to include a visual interpretation as a complementary stage of the harmonization process
The detection of these inconsistencies in categorizations reinforces the need to perform dataset harmonization before developing studies comprising different regional or international geographical areas. Indeed, the current project to update SIOSE is considering the harmonization of different geographics to improve the accuracy and reduce the maintenance costs of LULC datasets (Delgado Hernández et al., Citation2017).
The third and last issues that this study has addressed is related to the spatial transformations of original datasets. As demonstrated, given the ‘micro’ size of land use changes in PUA Huertas, the accuracy of available datasets (SIOSE or CLC) is not effective enough for approaching the spatial complexity of these areas. Consequently, other resources – such as the Geographic Information System of Agricultural Parcels – are needed to evaluate the spatial transformation of these PUA Huertas, as they increase the spatial accuracy of available datasets.
Additionally, the applied methodology has permitted to complement data increasing nuances at multiscale levels. For example, in relation with agricultural uses, SIGPAC database provides specific and updated information about automated irrigation, manual irrigation, and rainfed irrigation agricultural lands. These details are basic to study and assess water resources’ needs and management, determining the potential of agricultural cultivated, which is adjacent to urban land uses, or detecting rural roads that might strategically provide accessibility at the local scale connecting rural with urban tissues.
Considering the abovementioned issues, this proposed method contributes to a better understanding of the current spatial organization of these peri-urban areas and, moreover, it gives support for policy and decision-making in territorial planning and multiscale strategies, such as local – integration of spaces –, urban – strategic network connectivity, service distribution – or metropolitan – ecological connectors, identification of strategic opportunities.
6. Conclusions
Compared to the broadly used CLC in previous works, this study has confirmed that the harmonization of these two databases, SIOSE and SIGPAC, provides a more refined LULC identification. This is even clearer in highly fragmented areas such as the peri-urban fringes where agricultural plots and urban tissues meet, and the harmonization of databases has facilitated a better comprehension of its spatial complexity. The method has also allowed us to identify the oversimplification of the mixture of artificial and agricultural uses in these PUA Huertas. Accordingly, this information could serve as guidelines to review the SIOSE classification criteria and of other land cover datasets.
This methodology is an effective exploration system to support decision-making processes in designing landscape and defining environmental policies. In fact, the potential of this methodological proposal is its consideration as an urban-planning tool to better approach the peri-urban spatial context. Moreover, this is easily applied at the European level considering that SIOSE and SIGPAG datasets have their equivalence at the national level in almost all European countries, such as the German DeCOVER, the Austrian LISA, or the Portuguese COS 2007. This fact also implies the possibility of stablishing cross-country analysis, providing then a European framework for assessing planning challenges at peri-urban fringe, which is one of the next research lines.
As previously explained, the relevance of studying PUA Huertas has been confirmed since they are environmentally strategic spaces located in metropolitan areas under a high urban pressure, similar to other Italian and Greek Huertas’ strongholds identified by the DOBRIS report. Moreover, any agricultural space in a peri-urban location could be studiedby following the proposed method, mainly when looking for intertwining urban expectations and environmental aspirations with accuracy and considering nuances otherwise difficult to detect in these complex peri-urban areas.
These PUA areas emerge as multifunctional places in which the existing conflicts in the interface between the urban fringe and the agriculture plots can be transformed into an opportunity, for example, the development of an urban green infrastructure in connection with peri-urban environments, as recommended by the European Common Environmental policy. Therefore, the development of a spatial analysis tool based on existing databases offers an opportunity for a more effective spatial planning in the peri-urban fringe.
Acknowledgments
The research team sincerely appreciates dataset information provided by Dirección General de la Producción Agraria, Spanish Government, and valuable contribution from Marcos Gimenez and Lucía Martínez.
Disclosure statement
No potential conflict of interest was reported by the author(s).
Correction Statement
This article has been republished with minor changes. These changes do not impact the academic content of the article.
Additional information
Funding
References
- Lambin, E.F., & Geist, H.J. (Ed.). (2006). Land-use and land-cover change: Local processes and global impacts. Springer-Verlag.
- Antrop, M. (2004). Landscape change and the urbanization process in Europe. Landscape and Urban Planning, 67(1–4), 9–26. https://doi.org/10.1016/S0169-2046(03)00026-4
- Banzhaf, E., Kabisch, S., Knapp, S., Rink, D., Wolff, M., & Kindler, A. (2017). Integrated research on land-use changes in the face of urban transformations – An analytic framework for further studies. Land Use Policy, 60, 403–407. https://doi.org/10.1016/j.landusepol.2016.11.012
- Baudoux, L., Inglada, J., & Mallet, C. (2021). Toward a yearly country-scale CORINE land-cover map without using images: A map translation approach. Remote Sensing, 13(6), 1–32. https://doi.org/10.3390/rs13061060
- Benton-Short, L., Keeley, M., & Rowland, J. (2019). Green infrastructure, green space, and sustainable urbanism: Geography’s important role. Urban Geography, 40(3), 330–351. https://doi.org/10.1080/02723638.2017.1360105
- Bonato, M., Cian, F., & Giupponi, C. (2019). Combining LULC data and agricultural statistics for A better identification and mapping of High nature value farmland: A case study in the veneto Plain, Italy. Land Use Policy, 83, 488–504. https://doi.org/10.1016/j.landusepol.2019.02.034
- Borgogno-Mondino, E., Fabietti, G., & Ajmone-Marsan, F. (2015). Soil quality and landscape metrics as driving factors in a multi-criteria GIS procedure for peri-urban land use planning. Urban Forestry and Urban Greening, 14(4), 743–750. https://doi.org/10.1016/j.ufug.2015.07.004
- Botequilha Leitão, A., & Ahern, J. (2002). Applying landscape ecological concepts and metrics in sustainable landscape planning. Landscape and Urban Planning, 59(2), 65–93. https://doi.org/10.1016/S0169-2046(02)00005-1
- Büttner, G., Kosztra, B., Soukup, T., Sousa, A., & Langanke, T. (2017). European Environment Agency. CLC 2018 Technical Guidelines (Issue 3436).
- Cánovas-Molina, A., Cánovas Soler, A., & García-Frapolli, E. (2021). City-traditional agriculture dialogues: The ‘Huerta de Murcia’ case study. Land Use Policy, 111, 105780. https://doi.org/10.1016/j.landusepol.2021.105780
- CESE. (2005). Dictamen del Comité Económico y Social Europeo sobre la agricultura periurbana. Official Journal of the European Union.
- Costanza, R., & Ruth, M. (1998). Using dynamic modeling to scope environmental problems and build consensus. Environmental Management, 22(2), 183–195. https://doi.org/10.1007/s002679900095
- de Falco, S., Angelidou, M., & Addie, J.-P.D. (2019). From the “smart city” to the “smart metropolis”? Building resilience in the urban periphery. European Urban and Regional Studies, 26(2), 205–223. https://doi.org/10.1177/0969776418783813
- Delgado Hernández, J., Valcárcel Sanz, N., Arozarena Villar, A., Caballero García, E., & Porcuna Fernández-Monasterio, A., López Rodríguez, E. (2017). Sistema de Información sobre Ocupación del Suelo en España (SIOSE) de Alta Resolución, metodología de integración automática Nuevas Plataformas y Sensores aplicados a la gesti‘ón del agual, la agricultura y el medio ambiente Murcia Ruiz, L. A., Estornell, J., and Erena, M. (Editorial Universitat Politècnica de València) . , 307–310 https://gdocu.upv.es/alfresco/service/api/node/content/workspace/SpacesStore/0490c4ae-c529-4522-8a5c-17a452b07a59/TOC_6418_01_01.pdf?guest=true.
- Dwyer, J. (2011). UK land use futures: Policy influence and challenges for the coming decades. Land Use Policy, 28(4), 674–683. https://doi.org/10.1016/j.landusepol.2010.12.002
- Equipo técnico Nacional SIOSE. (2018). Documento técnico SIOSE 2014. D.G. Instituto Geográfico Nacional. Ministerio de Fomento.
- Erb, K.-H., Haberl, H., Jepsen, M.R., Kuemmerle, T., Lindner, M., Müller, D., Verburg, P.H., & Reenberg, A. (2013). A conceptual framework for analysing and measuring land-use intensity. Current Opinion in Environmental Sustainability, 5(5), 464–470. https://doi.org/10.1016/j.cosust.2013.07.010
- European Environment Agency. (1998). Medio ambiente en Europa. El informe Dobris. Office for Official Publications of the European Communities.
- European Environment Agency. (2020a). CORINE land cover. Coperniculs land monitoring service. Land Monitoring Service. European Commission.
- European Environment Agency. (2020b). CORINE Land Cover — Copernicus Land Monitoring Service. https://land.copernicus.eu/pan-european/corine-land-cover
- European Environment Agency. (2020c). The European environment -state and outlook 2020 Knowledge for transition to a sustainable Europe. https://doi.org/10.2800/96749
- European Union. (2012). Urban-rural linkages - Regional Policy - European Commission. https://ec.europa.eu/regional_policy/en/policy/what/territorial-cohesion/urban-rural-linkages/
- Font, A. (2004). The explosion of the city: Morphologies, observations and motions within recent territorial transformations in the South Europe Urban Regions. Colegio de Arquitectos de Cataluña. Fórum Universal de les Cultures.
- García-Álvarez, D., & Camacho Olmedo, M.T. (2017). Changes in the methodology used in the production of the Spanish CORINE: Uncertainty analysis of the new maps. International Journal of Applied Earth Observation and Geoinformation, 63, 55–67. https://doi.org/10.1016/j.jag.2017.07.001
- Garcia-Marin, R., Espejo-Marin, C., Giménez-García, R., & Ruiz-Álvarez, V. (2020). Transformations in the agricultural and scenic landscapes in the Northwest of the Region of Murcia. Land. Sustainability, 9(9), 314. https://doi.org/10.3390/land9090314
- García-Mayor, C. (2017). Invariantes en la evolución e identidad territorial del paisaje de huerta tradicional de la Vega Baja del Río Segura: 1929-2010. Boletín de La Asociación de Geógrafos Españoles, 73, 369–388. https://doi.org/10.21138/bage.2422
- García, F. (2016). Compacidad y densidad de las ciudades españolas. EURE (Santiago), 42(127), 5–27. https://doi.org/10.4067/S0250-71612016000300001
- Hazeu, G., Büttner, G., Arozarena, A., Valcárcel, N., Feranec, J., & Smith, G. (2016). Detailed CLC data: Member states with CLC Level 4/Level 5 and (Semi-) automated solutions. In G. Feranec, J. Soukup, T. Hazeu, and G. Jaffrain (Eds.). European Landscape dynamics. CORINE Land Cover data. Boca Raton: Taylor&Francis 28. https://doi.org/10.1201/9781315372860
- Instituto Geográfico Nacional. (2016). Plan Nacional de Ortofotografía Aérea (PNOA). https://pnoa.ign.es/
- Instituto Geográfico Nacional. (2018). Mapa topográfico nacional MTN50 (IGN). http://centrodedescargas.cnig.es/CentroDescargas/catalogo.do?Serie=Mapas
- Lai, S., Leone, F., & Zoppi, C. (2017). Land cover changes and environmental protection: A study based on transition matrices concerning Sardinia (Italy). Land Use Policy, 67, 126–150. https://doi.org/10.1016/j.landusepol.2017.05.030
- Levers, C., Müller, D., Erb, K., Haberl, H., Jepsen, M.R., Metzger, M.J., Meyfroidt, P., Plieninger, T., Plutzar, C., Stürck, J., Verburg, P.H., Verkerk, P.J., & Kuemmerle, T. (2018). Archetypical patterns and trajectories of land systems in Europe. Regional Environmental Change, 18(3), 715–732. https://doi.org/10.1007/s10113-015-0907-x
- Martí, P., & García-Mayor, C. (2020). The huerta agricultural landscape in the spanish Mediterranean arc: One landscape, two perspectives, three specific huertas. Land, 9(11), 1–22. https://doi.org/10.3390/land9110460
- Meeus, S.J., & Gulinck, H. (2008). Semi-urban areas in landscape research: A review. Living Reviews in Landscape Research, 2, 1–45. https://doi.org/10.12942/lrlr-2008-3
- Minetos, D., & Polyzos, S. (2009). Multivariate statistical methodologies for testing hypothesis of land use change at the regional level. A review and evaluation. Journal of Environmental Protection and Ecology, 10(3), 834–866 http://hdl.handle.net/11615/31046
- Ministerio de Agricultura, Fondo Español de Garantía Agraria. (2015). Aplicación SIGPAC | fega.es. https://www.fega.es/es/PwfGcp/es/ayudas_dir_desa_rural/aplicacion_sigpac/index.jsp
- Ministerio de Hacienda y Administraciones Públicas. (2013). Circular 04.01.2013, de 26 de abril, de trabajos catastrales para la incorporación de inmuebles y alteraciones en el marco del procedimiento de regularización catastral 2013-2016.
- Plan Nacional del Observación del Territorio. Instituto Geográfico NacionalMinisterio de Transportes.(2020). Geoportal SIOSE. https://www.siose.es/
- Morán Alonso, N., Obeso Muñiz, Í., Hernández Aja, A., & Fernández García, F. (2017). Challenges for the revitalisation of peri-urban agriculture in Spain: Territorial analysis of the Madrid and Oviedo metropolitan areas. Moravian Geographical Reports, 25(3), 192–207. https://doi.org/10.1515/mgr-2017-0017
- Nedd, R., Light, K., Owens, M., James, N., Johnson, E., & Anandhi, A. (2021). A syntesis of land use/land cover studies: Definitions, classification systems, meta-studies, challenges and knowledge gaps on a global landscapes. Land, 10(9), 1–30. https://doi.org/10.3390/land10090994
- Olazabal, E., & Bellet, C. (2018). Procesos de urbanización y artificialización del suelo en las aglomeraciones urbanas españolas (1987-2011). Cuadernos Geográficos. 57(2), 189–210. https://doi.org/10.30827/cuadgeo.v57i2.5920
- Pickard, B.R., & Meentemeyer, R.K. (2019). Validating land change models based on configuration disagreement. Computers, Environment and Urban Systems, 77, 101366. https://doi.org/10.1016/j.compenvurbsys.2019.101366
- Rega, C., Short, C., Pérez-Soba, M., & Luisa Paracchini, M. (2020). A classification of European agricultural land using an energy-based intensity indicator and detailed crop description. Landscape and Urban Planning, 198(February), 103793. https://doi.org/10.1016/j.landurbplan.2020.103793
- Romero, J., & Melo, C. (2016). The planning and management of Spanish Mediterranean Huertas. The time of policies. Universidad de Alicante. Instituto Interuniversitario de Geografía.
- Ros Sempere, M., & García Martín, F.M. (2016). Cinco palmos, 1929-2015 : Transformación de usos del suelo en la huerta de Murcia. CRAI Biblioteca, Universidad Politécnica de Cartagena.
- Ruiz-Martinez, I., Debolini, M., Sabbatini, T., Bonari, E., Lardon, S., & Marraccini, E. (2020). Agri-urban patterns in Mediterranean urban regions: The case study of Pisa. Journal of Land Use Science, 15(6), 721–739. https://doi.org/10.1080/1747423X.2020.1836054
- Salem, M., Tsurusaki, N., & Divigalpitiya, P. (2020). Land use/land cover change detection and urban sprawl in the peri-urban area of greater Cairo since the Egyptian revolution of 2011. Journal of Land Use Science, 15(5), 592–606. https://doi.org/10.1080/1747423X.2020.1765425
- Tang, Z., Ye, Y., Jiang, Z., Fu, C., Huang, R., & Yao, D. (2020). A data-informed analytical approach to human-scale greenway planning: Integrating multi-sourced urban data with machine learning algorithms. Urban Forestry and Urban Greening, 56(August), 126871. https://doi.org/10.1016/j.ufug.2020.126871
- Temes-Cord, R., & Moya, A. (2016). Typology of the transformations occurred in the peri-urban space of Huerta de Valencia. Evidence from north arch of Valencia (Spain). International Journal of Sustainable Development and Planning, 11(6), 996–1003. https://doi.org/10.2495/SDP-V11-N6-996-1003
- TU Delft (coord). (2020). REPAiR - REsource Management in Peri-urban AReas: Going beyond urban metabolism. https://cordis.europa.eu/project/id/688920/reporting
- Tuanmu, M.-N., & Jetz, W. (2014). A global 1-km consensus land-cover product for biodiversity and ecosystem modelling. Global Ecology and Biogeography, 23(9), 1031–1045. https://doi.org/10.1111/geb.12182
- Vallés-Planells, M., Galiana, F., Díez Torrijos, I., & Torrijos, I.D. (2020). Agricultural abandonment and resilience in a Mediterranean periurban traditional agroecosystem: A landscape approach. Ecology and Society, 25(1). https://doi.org/10.5751/ES-11346-250105
- van der Zanden, E.H., Levers, C., Verburg, P.H., & Kuemmerle, T. (2016). Representing composition, spatial structure and management intensity of European agricultural landscapes: A new typology. Landscape and Urban Planning, 150, 36–49. https://doi.org/10.1016/j.landurbplan.2016.02.005
- Verdú-Vázquez, A., Fernández-Pablos, E., Lozano-Diez, R.V., & López-Zaldívar, Ó. (2021). Green space networks as natural infrastructures in PERI-URBAN areas. Urban Ecosystems 24, 187–204. https://doi.org/10.1007/s11252-020-01019-w
- Vizzari, M., Hilal, M., Sigura, M., Antognelli, S., & Joly, D. (2018). Urban-rural-natural gradient analysis with CORINE data: An application to the metropolitan France. Landscape and Urban Planning, 171, 18–29. https://doi.org/10.1016/j.landurbplan.2017.11.005
- Yang, H., Li, S., Chen, J., Zhang, X., & Xu, S. (2017). The Standardization and harmonization of land cover classification systems towards harmonized datasets: A review. ISPRS International Journal of Geo-Information, 6(5), 154. https://doi.org/10.3390/ijgi6050154
- Zazo, A. (2010). Procesos de urbanización de la huerta de Zaragoza. Incoherencias instrumentales. In C. Vázquez, and M. Verdaguer (Eds.), El espacio agrícola entre la ciudad y el campo. Centro de Estudios Ambientales de Vitoria-Gasteiz & Universidad Politécnica de Madrid 285–296 http://habitat.aq.upm.es/eacc/alibro-print.pdf.
- Zeng, H., Sui, D.Z., & Li, S. (2005). Linking urban field theory with GIS and remote sensing to detect signatures of rapid urbanization on the landscape: Toward a new approach for characterizing urban sprawl. Urban Geography, 26(5), 410–434. https://doi.org/10.2747/0272-3638.26.5.410