ABSTRACT
Local farmers’ engagement and contributions are increasingly underscored in resources restoration policy. Yet, empirical context-situated understanding of the environmental impacts of farmer-led restoration remains scant. Using six Agent-based Modeling (ABM) simulations that integrate multi-type data, we explore the potential spatial-temporal aggregate patterns and outcomes of local restoration actions in Central Malawi. Findings uncover a 10-year positive trend and spatially explicit potential restoration extent and intensity, greenness, and land productivity, all varying by farmer’s participation level. Landscape regreening is modestly promising with fluctuating greenness levels and low, slightly incremental, then steady land-productivity levels. Findings also show appropriate incentives, restoration knowledge, and inspiring local leadership as propitious management options for boosting local restoration. Bundling these enabling management and policy options would maximize local restoration. Findings suggest empowering bottom-up restoration efforts for enhanced environmental impacts. We also demonstrate the potential of using ABM to offer insights for spatially targeted, evidence-based restoration policy implementation and monitoring.
1 Introduction
The undeniable severe environmental degradation occurring globally has sparked calls for restoring degraded and deforested landscapes. It has generated much political will and momentum, including the recently launched United Nations Decade of Ecosystem Restoration that anchors existing restoration narratives and related regional initiatives. In sub-Saharan Africa (SSA), 31 out of 54 countries have committed to restore their degraded lands by 2030, adopting the Forest Landscape Restoration (FLR) paradigm as an approach of ecosystem restoration (Djenontin et al., Citation2018; Djenontin et al., Citation2020a). Malawi has pledged to restore 4.5 million hectares of degraded lands and became a leading country in terms of framing a clear FLR strategy that includes 7.7 million hectares, representing 80% of the country’s land area, as potential degraded areas to be restored ([MNREM]. Ministry of Natural Resources, Energy and Mining, Citation2017a; Citation2018). The narratives promoting and reshaping landscape-scale resources restoration acknowledge the crucial role of local communities, including smallholder farmers and resource users, hereafter ‘farmers’, as local agents of change to drive much restoration processes (Erbaugh et al., Citation2020; Mansourian, Citation2021; Sigman & Elias, Citation2021; Singh et al., Citation2021). Farmers have been shown to make complex socio-cultural-based decisions leading to implementing pro-environmental technologies and practices to manage and restore both their degraded private lands and collective resources in forest-agriscapes (Andersson & D’Souza, Citation2014; Djenontin et al., Citation2020b; Meyfroidt, Citation2013; Schlecht et al., Citation2006). Such complex land-use/management decisions and resulting restoration actions produce aggregate, landscape-level environmental impacts, including improved land health and sustained provision of ecosystem services and functions.
However, empirical assessment of the environmental impacts of local farmers’ restoration decisions and associated activities on forest-agriscapes is lacking. Relatively few studies have documented regreening trends in forest-agriscapes to increase understanding of the potential of existing local restoration efforts and different ways to reinforce them. This gap in scholarship also undermines evidence-based governance and policy implementation and monitoring of FLR and broader restoration interventions. Many endeavors monitor deforestation and resources degradation worldwide, regionally, and at country and local scales. They include, for instance, the global forest resources assessment by the FAO, the Global Forest Watch, the Global Land Analysis and Discovery lab at the University of Maryland, and individual scholarly studies ([FAO]. Food and Agriculture Organization, Citation2020; Curtis et al., Citation2018; Gondwe et al., Citation2019; Hansen et al., Citation2013). Such studies mostly rely on remote sensing and latest artificial intelligence analytical power to assess the drivers, scale, and magnitude of forest loss, degradation, permanent deforestation, and their detrimental social, ecological, and economic impacts. Yet, only few studies have begun to offer some glimpses of locally driven regrowth, including regrowth evidenced in West African Sahara, the Sahel, the sub-humid zone, and in parts of Malawi, which is enhanced by trees outside forests and on-farm (Brandt et al., Citation2020 ; USGS-USAID, Citation2018).
Challenges in integrating social-cultural dimensions and ecological aspects (Le Polain de Waroux et al., Citation2021), with only just emerging attempts regarding restoration issues (see, Hughes et al., Citation2020), make assessing local land-management action-driven aggregate environmental impacts on forest-agriscapes particularly difficult. In the case of forest and tree regrowth, the spatial and temporal patterns and outcomes of resources restoration and their links to the social agents involved in managing and restoring the resources is less understood. Also missing is a proper context-situated understanding of management strategies that can enable and positively influence local restoration efforts. Addressing such lack of evidence is now pressing to inform context-specific, propitious management and policy choices to accelerate restoration.
This study attempts to address these knowledge gaps using a modeling approach of complex socio-ecological system (SES). We develop a bottom-up, data-driven agent-based model (ABM) to explore the potential aggregate patterns and environmental outcomes of farmers’ restoration decisions and activities in Central Malawi. ABMs offer a unique method to explore complex SES by simulating the impacts over space and time of local farmers’ decision to engage and invest in restoration activities, while also identifying the likely effects of locally deployed management/policy options to enhance farmers’ restoration endeavors. The purpose of the model is to shed light into how the dynamics of landscape-scale patterns of restoration are shaped by the decisions of social agents (local farmers) related to the use of land-management practices, and to prospect for policy options to hasten resources restoration in Malawian forest-agriscapes.
Our objective is to evaluate the potential environmental impacts of farmers’ restoration decisions and investments on forest-agriscapes and identify enabling policy options to foster restoration. The space-time dynamics examined include local participation levels, intensification patterns, and biophysical outcomes such as land productivity and vegetation cover. Our findings demonstrate spatially targeted and evidence-based restoration policy making and implementation.
In Section 2, we elaborate on spatial ABM as a social science simulation method of human-environment interactions to explore macro-scale patterns, emphasizing individual micro-decisions and behaviors. In Section 3, we describe the materials and methods including the study area and the multi-source and multi-type data used to inform the model. We then present the conceptual ABM, along with the experiments, and describe the analysis processes. In Section 4, we report the simulation results including both spatial and non-spatial outputs. We discuss the findings in Section 5 and conclude in Section 6. The paper is supplemented with Overview, Design concepts, and Details (ODD) description of the model (Grimm et al., Citation2010; Citation2017; Citation2020), with an additional description of the social agents’ decisions as emphasized by the ODD + Decision protocol (Müller et al., Citation2013).
2 Agent-based modeling: a complex systems approach to human-environment modeling
Modeling complex land-use/land-cover (LULC) change enhances our understanding of the spatial and temporal dynamics of land systems and supports implementation decisions and policies for resources management (Gilbert, Citation2008). Modeling of land use requires a complex systems thinking that integrates socio-economic factors and processes with environmental and biophysical ones. This allows the capturing of feedbacks and emergent features at the system’s level (An, Citation2012; Sayama, Citation2015).
ABMs are increasingly used because of their power to enhance the systematic understanding of problems involving complex SES for several reasons (An, Citation2012; Miller & Page, Citation2007; Parker et al., Citation2003). Advantages include enabling the integration of different disciplinary perspectives (Gilbert, Citation2008) and the ability to present outcomes of socio-ecological processes in a spatially explicit manner (Kelly et al., Citation2013; Matthews et al., Citation2007). ABMs are particularly effective for exploring aggregate macroscale (e.g. landscape level) impacts of micro-scale land-use decisions and actions of farmers, land managers, and other social agents. Using a behavioral modeling approach helps to account for the agency of individual social actors that share a common environment, and to focus on heterogeneity, resource constraints, interconnectedness, interactions, and behavioral patterns (Kelly et al., Citation2013; Miller & Page, Citation2007). Another ABM advantage is the ability to explore and test outcomes of specific policy options for devising natural resource management decisions and policy making without having to wait for long term field-based impact analysis (Matthews et al., Citation2007). Also, using uncertainty and sensitivity analysis of ABMs provides stronger methods to determine the most influential factors driving certain observed emergent behaviors (Ligmann-Zielinska, Citation2018; Ligmann-Zielinska & Jankowski, Citation2014; Ligmann-Zielinska & Sun, Citation2010). These ABM advantages can help to capture the dynamics of the complex system of land-use conversion with restoration practices, which remains a gap to address to support and advance the new FLR paradigm.
This study employs ABM as a comprehensive method to explore the spatial and temporal impacts of the decisions to invest in tree and non-tree-based restoration practices both at the individual farm/household and collective levels in Central Malawi. It simulates the environmental conditions of a forest-agriscape with different policy options over a 10-year period, which is a common timeframe for restoration assessment (Wortley et al., Citation2013). We build on several studies that have employed ABMs to explore different facets of land-use conversion and change (see, Berger, Citation2001; Parker et al., Citation2003; Bakker & van Doorn, Citation2009; Valbuena et al., Citation2010; Bert et al., Citation2011; Schreinemachers & Berger, Citation2011).
3 Materials and methods
3.1 Study area and data
This study is part of a research project that focuses on ongoing restoration efforts in Ntchisi and Dedza Districts in the central region of Malawi (). Compared to the North (high land productivity) and the South (low productivity), Central Malawi displays a mix of high and low land productivity (Peter et al., Citation2018).
Figure 1. Study areas and study sites.
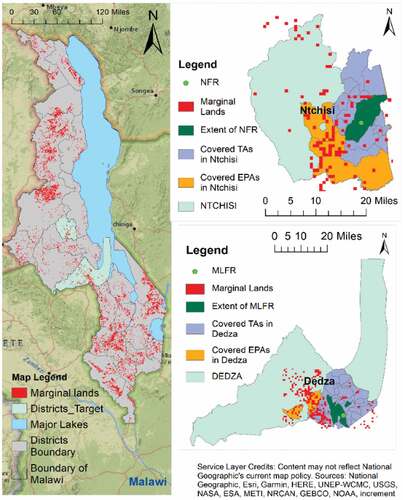
Although, this paper presents only the modeling processes and results for Ntchisi district, mainly for conciseness, we describe the entire research area. The districts were selected based on three criteria that emerged from desktop study and preliminary fieldwork in the summer of 2018. First, we drew on a country-level restoration stocktaking and selected districts with high functional degradation (loss of landscape functionality) within and around forest reserves, relative to other districts in Central Malawi ([MNREM]. Ministry of Natural Resources, Energy and Mining, Citation2017b, pp. 33-34). Since population density affects pressures on resources and can shape restoration dynamics, we further picked two contrasting districts. Dedza is more densely populated than Ntchisi – 221 versus 186 persons per square km in 2018 ([NSO]. National Statistical Office, Citation2019). Second, conversations with forestry officials indicated that both districts had relatively high levels of implementation of pro-environmental practices as potential sources of accelerated restoration. They also have significant restoration opportunities, in terms of percentage of district area, compared to other districts in the region ([MNREM]. Ministry of Natural Resources, Energy and Mining, Citation2017b, pp. 30-32). The specific restoration practices and activities are described in Djenontin et al. (Citation2020b & Citationforthcoming). Third, we considered features of participatory community forest management involving collective-action groups in order to capture variation between districts. Both districts were part of the earliest participatory forest management endeavors spearheaded under the ‘Improved Forest Management for Sustainable Livelihoods Program’ (IFMSLP), but only Ntchisi was part of the recent ‘Protecting Ecosystems and Restoring Forests in Malawi’ project that sought to sustain the legacy of IFMSLP.
The specific research sites in the two districts are forest-agriscapes encompassing a forest reserve – Ntchisi Forest Reserve (NFR – 9,720 ha) in Ntchisi and Mua-Livulezi Forest Reserve (MLFR – 12,147 ha) in Dedza; adjacent communal forests and woodlands; and the adjacent agrarian lands on customary areas. NFR covers three traditional authority (TA) territories representing two extension planning areas (EPAs) while MLFR covers two TAs spanning three EPAs in Dedza district. NFR is relatively well managed and has better and more established institutional arrangements for collective forest and tree management/restoration efforts, while MLFR is relatively poorly managed (Zulu, Citation2013; Senganimalunje et al., Citation2016). Subsistence agriculture is the primary livelihood (80% of households) and is dominated by maize as the staple food and tobacco as the top commercial crop. Forest-based livelihoods in Ntchisi district include timber sales and fuelwood production (Chinangwa et al., Citation2016). Charcoal production and timber harvesting exert much pressure on the vegetation cover in Dedza district (Senganimalunje et al., Citation2016).
The ABM integrates several types of data and variables that we gathered from multiple sources. These include focus group discussions (FGDs) along with role-playing games (RPGs), a household survey (HHS), remote sensing products, and secondary data. First, in summer 2019, we conducted seven FGDs during which we used RPGs as a participatory approach to elicit farmers’ decision-making processes on forest-agriscape restoration. Second, we conducted a HHS of 480 respondents, which provided quantitative data on the restoration decisions and on socio-demographic characteristics, socio-economic activities, farmer assets, and social, financial, and natural capitals. Other information collected was group-level variables that affect restoration activities. Processed and analyzed FGD, RPG, and HHS data offered critical inputs for model parameterization, including informing the model’s decision rules (see the ODD+D documentation). Third, we gathered four types of remote sensing data products – one land-use/cover map, two vegetation and productivity indices, and one land marginality parameter (LMP) spatial dataset. The map product is a 1 km-resolution land-use/cover map of Malawi for 2017 (based on images from April to September) derived from combined Sentinel-2 and Landsat 8 satellite data (USGS-USAID, Citation2018). The two indices are Normalized Difference Vegetation Index (NDVI) that measures greenness, denoting tree and other vegetation cover, and Net Primary Productivity (NPP) that measures land productivity, representing the energy stored as biomass by all plants and other primary producers, but excluding energy lost in respiration (essentially, biomass production measured in kg C m-2). We have retrieved 19-year (2000–2018) 16-day NDVI time series data (MOD13Q1.006–250 meter resolution (see Didan, Citation2015)) and 19-year (2000–2018) NPP time series (MOD17A3HGF.006–500 m resolution from the Terra satellite (see Running & Zhao, Citation2019)) from the NASA MODIS Reverb Web portal (NASA LP DAAC, accessed in August 2020 and February 2021). NPP has a direct relationship with agricultural production and is a reliable indicator of total land productivity (Messina et al., Citation2017; Qi et al., Citation2020). The land marginality parameter (LMP) represents land productivity estimates from a range of geospatial multi-scalar data sources including soil suitability, climate, and interannual variability and other factors. LMP determines the level of land marginality in terms of productivity of the dominant grain cropping system developed for Malawi (Peter et al., Citation2018). Fourth, we draw on secondary data from peer-reviewed literature and existing public national surveys for additional information necessary in the model building, such as farm-household population. These data sources include Malawi’s 2015/16 fourth integrated household survey (IHS4), the 2018 Population and Housing Census ([NSO]. National Statistical Office, Citation2019), and the National Census of Agriculture and Livestock (NACAL 2006/2007).
3.2 Conceptual ABM
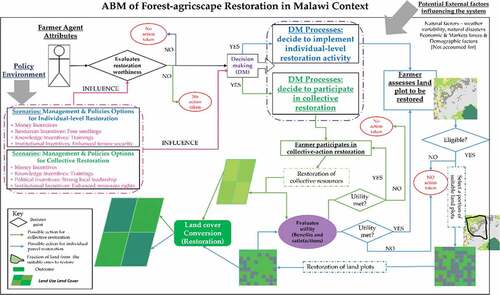
The ABM developed for this research draws insights from previous models in studies informing natural resource governance and policy making for land-use conversion (Castella et al., Citation2005; Ligmann-Zielinska & Jankowski, Citation2014; Mwangi, Citation2017; Wimolsakcharoen et al., Citation2021). Our ABM conceptual diagram is presented in . The ABM is composed of farmer agents whose local land-use decisions and subsequent implementation of restoration practices are considered as the major driving force of land-use conversion (restoration). Agent’s environment is represented by the interlocked agrarian and forested landscapes within which restoration occurs. The agrarian area is made up of individual croplands divided into plots on which farmer agents can decide to implement restoration practices. It also includes some collectively managed areas where farmer agents implement land and water resources conservation (LWRC) practices and infrastructures in organized groups on customary lands. The forested area comprises documented collectively managed community trees and forests (Djenontin et al., Citationforthcoming). These include designated village forest areas (VFAs), community woodlots (CW), and natural forest patches (NF) located on customary lands, and the state-owned forest reserve (FR) sited in the protected areas.
Figure 2. ABM diagram flow.
3.2.1 Agent’s decision process and its implications
The model starts from setting up farmer agents who are assigned to land plots and collective resources. Agents follow different empirically informed decision rules (see Djenontin et al., Citation2020a) that lead to (some level of) restoration of their environment, upon evaluating whether they engage in restoration. Guided by their decision rules, agents implement a certain number of land-management practices and activities (i) on a defined fraction of candidate plots deemed eligible and tagged for restoration and (ii) in selected collectively managed resources also evaluated as suitable for restoration. A combination of farmer-level attributes and resource-level factors determine land-plot eligibility and selection of collective resources. In the modeling process, farmer agents evaluate land utility – the benefits and satisfactions from changes in land condition induced by the applied restoration practices. Land utility further informs farmer agents’ willingness to continue with restoration in the following year. Specifically, farmer agents assess whether their selected plots and collective resources for restoration (i) show an increase in NPP and NDVI values, and (ii) are associated with additional harvest and resource access/use-rights. The assumption is that an increase in NPP, when comparing initial and final values associated with individual land plots, denotes a positive change in land productivity leading to denser vegetation (Qi et al., Citation2020). Similarly, an increase in NDVI, when comparing initial and final values associated with collective resources, denotes a positive change in landscape greenness from collective restoration. Upon updating their willingness to continue with restoration, farmer agents repeat the decision process for the consecutive year. The model is simulated over 10 years. Different management and policy scenarios are later explored as separate simulations.
3.2.2 Agent-environment feedback
The restoration decisions and actions of farmer agents induce changes in the environment. We simulate the likelihood of restoration of land plots and collective resources, offering an overview of the extent of restoration. For each time step (year), we record the number of times a land plot or collective resource is selected for restoration. We also simulate restoration intensity as the number of restoration practices applied on each restored land plot or collective resource. Further, we consider the overall landscape productivity and greenness. Among land plots and collective resource areas selected for restoration, we denote those with increased NPP and NDVI values as more productive or regreened (successfully restored) and we record their number as well as the value of the annual benefits.
3.2.3 Experiments
The experiments, also called scenarios, explore which resource-management options and policy provisions would sustain farmer engagement with restoration and enhance restoration outcomes. Drawing on earlier research insights (Djenontin et al., Citation2020b & Citationforthcoming), our experiments target previously identified underlying decision-making goal frames and critical determinants of restoration investments. The experiment elements are mainly external to farmer agents (often provided by government and NGOs) and are socioeconomic and institutional in nature (). Specifically, we introduce incentives and options addressing some resource constraints. We also include factors denoting increased restoration knowledge and enhanced local leadership. In addition to targeting restoration decisions, the experiments affect the number of farmers engaged in restoration, thereby potentially altering the number of land plots and collective resources to restore.
Table 1. Dimensions and categories of attributes in the experiments.
The following operational questions are used for the experiments:
Experiment 1: What is the effect of providing different forms of incentives (monetary and in-kind) on restoration patterns and outcomes?
Experiment 2: What are the implications of enhancing local leadership on the patterns and outcomes of restoration?
Experiment 3: How does farmer agents’ access to restoration inputs (free tree seedlings and agricultural fertilizers) shape the patterns and outcomes of restoration?
Experiment 4: How does farmer agents’ access to knowledge (via training on restoration practices and reinforcement of extension services) shape the patterns and outcomes of restoration?
Experiment 5: How does enabling all of the above management options and provisions shape the patterns and outcomes of restoration?
It is important to note that some external elements may influence the environment and the larger socio-economic and political system of farmer agents, but, for simplicity, we did not include them in our ABM. We elaborate further detailed specifications of the ABM components, including agents, their environment, decision rules and actions, and the experiments in the ODD+D documentation (Supplemental file).
3.3 Analyses
Our evaluations include six model simulations (base model and five experiments) and analysis of their respective outputs. First, for each model simulation, the number of farmer agents initialized (NF = 18,820) reflects an estimated population of farm households for the region of interest (the extent of the forest-agriscapes). That number is inferred from both the potential number of land plots in the extent of the forest-agriscape (NP = 52,701 plots) and the distribution of average land-plot ownership (number of plots) by household in the study site as informed by the HHS. Further, we maintain the number of land plots (NP) and collective resources (NC = 30 collectives) constant in the models throughout the simulations because the spatial area does not expand, even though land plot fragmentation may occur. More details on these assumptions and other model specifications are described in the ODD+D documentation. Each scenario comprises 10 years (ticks) and is executed 420 times. We estimated this number based on 21 covariates included in the model, each needing 20 observations (see Harrell, Citation2015). We save and store the spatial and scalar output data for each year of simulation. We developed the model in Python programming language (https://www.python.org/). The elapse time per model simulation was 39 hours on average.
Second, outputs processing involves evaluating the aggregate spatial and temporal trends of the extent of restoration; biophysical changes, including the level of productivity and greenness and their value (restoration benefits); restoration intensity; level of participation; and the differential impacts of the experiments. For each year, we compute: (i) the ratio of restored land plots and collective resources to the total available land plots and collective resources, respectively; (ii) the ratio of productive land plots and regreened collective resources over the total available land plots and collective resources; (iii) the sums of productivity and greenness values for all productive plots and regreened collectives; (iv) the number of farmer agents who engage in restoration individually and collectively; and (v) the number of restoration practices applied on land plots and in collective resources. For each year, these statistics are averaged over all 420 simulation runs. We repeat the analyses for each experiment and use one-way ANOVA and selected post hoc tests to compare the respective outputs and detect any statistically significant differences across experiments. This process can guide identification of propitious management and policy choices for restoration. For these analyses, we use Stata 15 and R, in combination with ArcGIS.
4 Results
We present the non-spatial and spatial results of the model simulations, which offer complementary insights.
4.1 Collective resources restoration
4.1.1 Emerging aggregate patterns and outcomes of collective restoration (the base model)
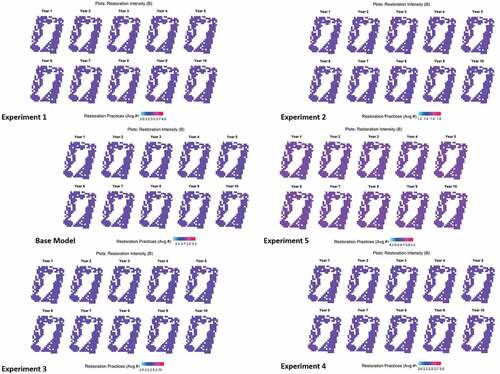
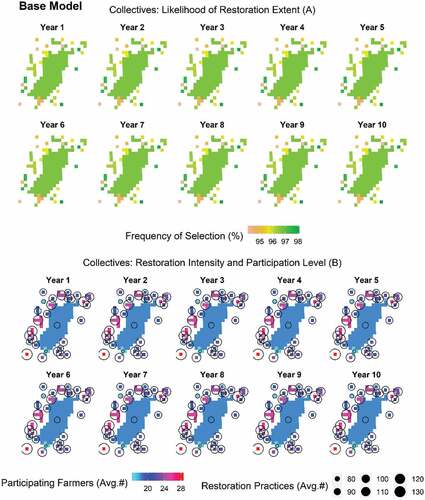
Extent of restoration: In this experiment, less than half of the collective resource areas in the forest-agriscape are selected for restoration. , graph A shows an up and down pattern of approximately 16.6% of collective resources restored in year 1. This increases to 29.6% in year 2, falls to 16.6% in year 3, goes up again to 29.6% for year 4, and so forth. Spatially, findings show which specific collective resources are likely to be restored yearly, indicating their frequency of selection for restoration (, panel A). While there is no clear temporal difference, the spatial patterns illustrate that each year, the NFR in the protected area has a high frequency of selection; thus, is likely restored. However, only a small share of collective resources on customary areas has a high likelihood of being restored given their relatively low selection frequencies (orange and yellow polygons in , panel A). The collective resources on customary areas include village forest areas (VFAs), community woodlots (CW), natural forest patches (NF), and areas devoted to LWRC activities.
Figure 3. Aggregate temporal patterns and outcomes of collective restoration (Base model, graphs A-F).
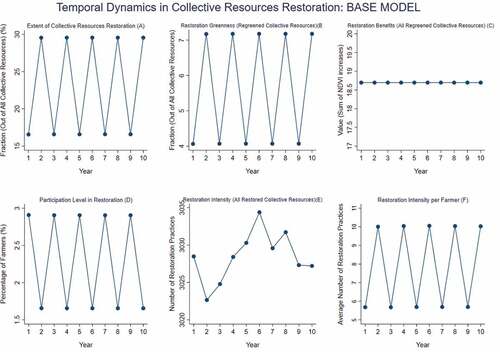
Figure 4. Spatially explicit and temporal trends of collective restoration outcomes (Base model, panels A-B).
Landscape-greenness levels and values: Upon restoration, a reduced number of collective resources are regreened, denoted by an increase in their NDVI values (difference between final and initial values). Similar to the pattern of the extent of restoration, , graph B illustrates an up and down trend of approximately 4.1% of regreened collectives for year 1, changing to about 7.2% for year 2, then coming down to 4.1% for year 3, and up again to 7.2% for year 4, and so forth. Despite such a temporal up and down trend of regreening, the aggregate yearly landscape-level greenness value (sum of all NDVI increases) remains the same and is equal to 18.7 (, graph C). Therefore, years with low numbers of regreened collective resources would still show a denser vegetation cover in those collective resources. When distributed equally on the landscape (and considering all resources), the average NDVI value would correspond to approximately 0.62.
Levels of participation: Farmer agents’ engagement in collective restoration exhibits an inverse relationship with the extent of restoration. , graph D shows a relatively higher number of farmer agents (2.9%) involved in restoring the collective resources in years with low restoration extent, while a smaller number of farmer agents (1.7%) are involved in restoring collective resources in years with high restoration extent. Spatially, findings indicate that farmer agents participate more in collective restoration on customary areas (collective resources in purple to red colors in , panel B), while they engage less in collective restoration in the protected areas as indicated by the dominant blue color of the NFR polygon. We infer that the tenure system drives this pattern of participation level, indicating higher ease of access to and management of community-owned resources on customary areas than state-owned resources in protected areas.
Restoration intensity: Farmer agents apply a high number of restoration practices in restoring the collective resources, demonstrating restoration intensification. , graph E indicates that for all collective resources under restoration, the ten-year average aggregate number of restoration practices applied is 3028, with a narrow variation ranging from 3022 (year 2) to 3034 (year 6). Individually, each farmer agent applies on average 5–6 restoration practices in years with high participation level, which increased to around 10 restoration practices in years with low participation level (, graph F), signaling a hidden maximization rationale to achieve the same aggregate level of greenness. Spatially, findings illustrating the average number of restoration practices applied on each collective resource unit indicate a relatively higher number (big circle sizes) on collective resources on customary areas compared to the ones in protected areas (, panel B).
4.1.2 Differential effects of the experiments on emerging patterns and outcomes of collective restoration
The experiments indicate few differential effects from the comparative analysis (, graphs A-F), with some showing a statistical significance (). First, for the extent of restoration, all five experiments indicate a reduction of the yearly number of collective resources restored compared to the base model (, graph A), with statistically significant differences. However, despite such a relatively low extent of restoration, all five experiments display similar temporal trends as the base model. Spatially, all five experiments show a shift in the frequency of selection of some collective resources. They all indicate an increase in the likelihood of restoring the NFR (protected area) while showing a decrease in the likelihood of restoring some collective resources on customary areas (see Appendix ). Second, regarding biophysical changes, all five experiments share similar fluctuating temporal trends and have the same aggregate levels of greenness, with no obvious difference compared to the base model (, graph B). However, all five experiments indicate increased aggregate greenness value of approximately 25.9 (sum of all NDVI increases) that is consistent for all years (, graph C) but shows no statistically significant difference compared to the base model. This suggests a slightly greener landscape than the base model value indicates. Third, for participation level, all experiments increase the level of participation in a similar fashion compared to the base model (, graph D), but with a marginal statistically significant difference. Spatially, such increases are also observed without changing the featured dynamic supported by the tenure system – more participation for community-owned collective resources compared to state-owned collective resources (see Appendix ). Finally, regarding restoration intensity, while there is no temporal difference within each experiment, they all show differentiated restoration intensification (, graphs E-F) that is statistically very significant. Experiments 1 and 5 increase substantially the number of restoration practices applied both at system (landscape) level and at farmer level, compared to the base model. Experiment 4 shows a lower intensification both at landscape and at farmer levels, compared to the base model and the other experiments. Experiments 2 and 3 also increase the number of restoration practices applied, but only at the aggregate landscape level when compared to the base model. At the farmer level, experiments 2 and 3 show similar and lower restoration intensification, respectively, compared to the base model. Spatially, these landscape-level trends are confirmed, indicating increased ranges of the number of restoration practices applied on the collective resources for all experiments except for experiment 4 compared to the base model (see Appendix ).
Figure 5. Comparison of the aggregate temporal patterns and outcomes of collective restoration among the base and experimental models (Graphs A-F).
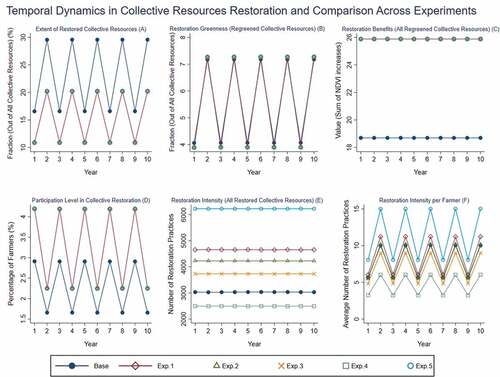
Table 2. Statistical comparison of the aggregate patterns and outcomes of collective resources restoration among the experiments.
4.2 Individual Land-Plot Restoration
4.2.1 Emerging aggregate patterns and outcomes of individual model restoration (the base model)
Extent of restoration: Less than half of the land plots in the forest-agriscape are part of the restoration processes all the way from their eligibility to consideration and selection for restoration. , graph A indicates that while 37.5% are deemed eligible for restoration, 29.7% are actually considered, and finally only 15.3% are restored. Temporally, this trend is linear and remains almost the same, with a slight decline (nearly indistinguishable) from year 2 and onward. Spatially, findings show the yearly frequency of selection of land plots for restoration (over the 420 runs of simulation), which ranges from 60% to 78% in year 1 and declines to about 55–74% in year 2 and onward. The spatial patterns illustrate a random selection of land plots within the forest-agriscape, with no noticeable specific clustering as shown in the mapped plots subset (See Appendix , panel A).
Figure 6. Aggregate temporal patterns and outcomes of individual land-plot restoration (Base model, graphs A-F).
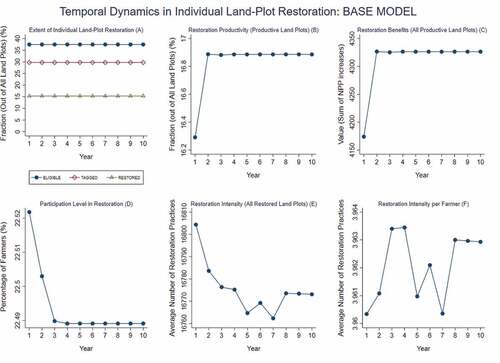
Land-productivity levels and values: Upon restoration, a reduced number of land plots are productive, represented by an increase in their NPP values (difference between final and initial values). , graph B illustrates a cumulative rising trend, with a steep increase in the first 2 years (16. 29% 1 and 16.89%), a slight decrease in year 3 (16.88%), and rebound in year 4 (16.89%) that then plateaued for the remaining years. The aggregate yearly landscape-level productivity value (sum of all NPP increases) follows a similar short rising pattern, starting from 4173.9 and plateauing around 4326.4 (, graph C). When distributed equally across all land plots in the landscape, the average NPP value would be approximately 0.083–0.086 kg C m-2, indicating a positive but low productivity based on the potential 19-year mean values used (ranges of ‘NPP final’ – see ODD documentation).
Levels of participation: Farmer agents’ engagement with individual land-plot restoration features an inverse relationship with the levels and values of land productivity. , graph D shows a reverse j-shape denoted by a very small but noticeable decline in the number of farmer agents restoring land plots (22.52% down to 22.49%) between year 1 and 4, and by a steady trend from year 4 and onward.
Restoration intensity: Farmer agents apply a high number of land-management practices in restoring their land plots, demonstrating a restoration intensification. , graph E indicates that, for all land plots being restored, the aggregate number of restoration practices applied is very high but decreasing notably in the first five years, with a narrow range of variation overall. Also, each time the number of restoration practices reaches its low-end values (year 5 and 7), there is more rebounding effort to a seemingly acceptable aggregate number to maintain land-productivity levels and values (restoration benefits). Individually, each farmer agent applies on average approximately 4 restoration practices on their respective farmlands (total of land plots owned), with a narrow temporal variation (, graph F). Spatially, findings illustrate that the average number of restoration practices applied on each land plot ranges 2–3, with few plots receiving more than 3 practices as shown in the mapped plots subset (See Appendix , panel B). This range corroborates the above farmer-level trends because most farmers own just 2 land plots with few owning more or less, making the total number of restoration practices applied to likely sum up to the average number found over their entire farmlands.
4.2.2 Differential effects of the experiments on emerging patterns and outcomes of individual restoration
For land plots, the experiments also reveal few differential effects from the comparative analysis (, graphs A-F), with some showing a statistical significance (). First, for the extent of restoration, all the experiments show a slight decrease for the yearly number of land plots restored compared to the base model (, graph A) but with no statistically significant difference. Notwithstanding such a low extent of restoration, all of them display similar temporal trends as the base model. Spatially, all five experiments narrow slightly the range of the likelihood of selection of land plots for restoration while shifting the frequency of selection of some land plots (see Appendix ). Second, regarding biophysical changes, all five experiments have the same aggregate levels and values of land productivity. Compared to the base model, the experiments offer some increase that is only prominent for year 1 (, graphs B-C) but shows no statistically significant difference overall. The aggregate yearly landscape-level productivity value (sum of all NPP increases) starts from 4262.1, increases, and becomes steady around 4328.4, slightly above the base model’s values (, graph C). When distributed evenly across all land plots in the landscape, the average NPP value would approximate 0.085–0.086 kg C m-2, indicating a positive but low overall productivity. Third, for participation level, all experiments increase the level of participation in a similar fashion compared to the base model (, graph D), but with no statistically significant differences. Finally, regarding restoration intensity, while there is no temporal difference within each experiment, they all show differentiated restoration intensification (, graphs E-F) which is highly statistically significant. Similar to collective restoration, experiments 1 and 5 increase considerably the number of restoration practices both at landscape and farmer levels compared to the base model. The other experiments show a lower intensification compared to the base model, with experiments 2 and 4 offering the lowest and highest intensification, respectively. The spatial patterns confirm these landscape-level trends, showing that the number of restoration practices applied on land plots for all experiments, except for experiments 1 and 5, are lower than the base model (see Appendix ).
Figure 7. Comparison of the aggregate temporal patterns and outcomes of individual land-plot restoration among the base and experimental models (Graphs A-F).
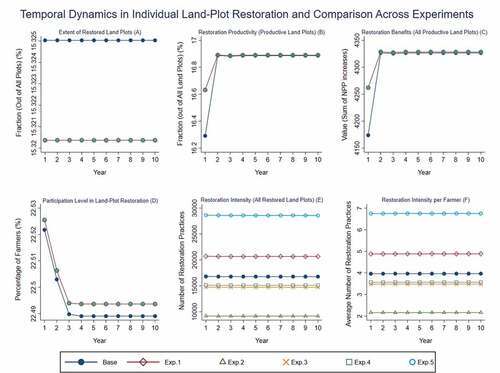
Table 3. Statistical comparison of the aggregate patterns and outcomes of individual land-plot restoration among the experiments.
5 Discussions
We discuss the findings in light of the two research questions, elaborate the contribution of the modeling approach, and articulate some limitations.
Our findings uncover both emerging aggregate spatial and temporal patterns and outcomes of local farmers’ restoration decisions and activities on the studied forest-agriscape. These include the potential extent and intensification patterns of restoration, participation level, and potential environmental outcomes in terms of greenness and land productivity levels and values. First, the findings across the base model and the five experiments suggest that the extents of individual farmland and collective restoration remain a relative small fraction of all resources (land plots and collective resources) in the forest-agriscape. The opposite is true for restoration intensity, with an intensification of the number of land-management practices and activities to maximize restoration benefits (greenness and land productivity). Both findings align with and confirm previous findings of a relatively low areal impact of restoration efforts in the area although restoration intensity is high (Djenontin et al., Citationforthcoming). The additional new information is that within the current context, the landscape is likely to display some high and low restoration extents across the years for collective resources restoration. Therefore, farmers involved in such collective actions are likely to incrementally intensify the adoption and use of restoration practices, with some highs and lows. For individual farmland restoration, no significant change is likely to occur over the next 10 years in terms of increasing the areal extent of farmlands restoration. On the other hand, findings suggest that landscape-level restoration intensity for farmlands is driven by the participation level, suggesting an avenue for encouraging farmer to embrace restoration of their land plots. These findings might also reflect the fragmented nature and small size of land plots as a potential limiting factor to significant spatial gains in farmland restoration even as farmers respond to restoration needs by increasing (intensifying) restoration practices. This unearths existing conundrums over land fragmentation in agrarian landscapes in sub-Saharan Africa in general, including spatial fragmentation and the entangled limiting tenure-related fragmentation (Asiama et al., Citation2019; King & Burton, Citation1982; Ntihinyurwa & de Vries, Citation2021; Asiama et al., Citation2017).
Second, findings suggest that farmers engage less in restoring collective resources in the protected area than in community-owned collective resources. Such insight into the pattern of affiliation to community forestry collective actions reflects relatively easier access to collective resources on customary lands. It also confirms the role of stronger sense of ownership through resource-tenure rights and security for enhancing local participation in restoration as confirmed in previous studies (Lawry et al., Citation2017; Lovo, Citation2016; Nagendra, Citation2007; Sikor et al., Citation2017). Consequently, findings substantiate appeals for a rights-based approach to landscape restoration, particularly secure tenure as a critical incentive to participation in restoration and NRM generically (McLain et al., Citation2018), and for the need to conduct tenure assessments to understand context-situated resource tenure dynamics (Kandel et al., Citation2021). For individual farmland restoration, farmers will likely engage more with restoration in the early years, but the engagement level might drop once they reach a certain steady productivity outcome. The emerging mechanism to highlight here is that individual farmer behavior tends to seek to balance and adjust restoration intensification in order to meet the same aggregate productivity level as participation stagnates. Improved understanding of current and potential future patterns of engagement level in restoration is important to foresee and envisage how to enhance farmer participation and contributions to forest-agriscape restoration and the balance between individual and collective restoration in protected and community areas. An important principle of FLR and other broader nature-based solutions involving restoration is to engage local stakeholders and increase local participation (Besseau et al., Citation2018; Cohen-Shacham et al., Citation2019).
Third, findings suggest overall positive restoration outcomes, measured as changes in landscape environmental condition using NDVI and NPP indicators, although only a reduced fraction of collective resources and land plots would be successfully restored. For collective resources, the extent of greenness is likely to fluctuate following the highs and lows of the extent of restoration, but the same potential positive aggregate greenness value is likely attainable every year across the landscape overall. With the current situation, it is likely that local farmers’ restoration efforts will positively affect landscape condition with an incremental number of more productive land plots, at least for the first two years. Such patterns drive a positive, but low aggregate landscape productivity that would increment to a certain level before becoming steady over time, illustrating the value of considering local farmer contributions to land restoration. Those regreening indicators represent indirect measures of both ecological and social benefits of restoration. Greenness levels and values indicate vegetation cover potential and productivity levels and values reflect agricultural productivity potential, both providing ecosystem services and functions that support livelihoods and food security.
Our findings also offer insights into some propitious enabling management and policy options for enhanced restoration. Overall, two to three experimental management and policy options appear potentially conducive to improving restoration patterns and outcomes. First, experiment 1 targeting incentives stands out for both individual and collective restoration, indicating that granting different types of incentives to local farmers is likely to amplify restoration efforts and outcomes. Different incentive mechanisms may involve either direct cash incentives (including meeting allowances for collective actions), in-kind incentives such as food or other items, or loan-based incentives. Loan schemes can be linked to specified unit-restoration outcomes – e.g. acres of land restored, number of trees planted/survived after 1 year, etc. However, as underscored in previous findings (Djenontin et al., Citation2020b), the nature of incentives should be made appealing to local farmers, with attention to gender and location differences. Also, harmonizing incentive approaches and mechanisms within a targeted landscape or location is critical for congruent and consistent restoration processes as part of necessary cohesive restoration governance (Djenontin & Zulu, Citation2021).
Second, experiment 4 on knowledge and experiment 2 on local leadership are the next that stand out as enabling strategies to enhance individual and collective restoration, respectively. Experiment 4 indicates that investing in training farmers and strengthening extension services to provide some complementary or missing restoration-related knowledge would enhance restoration efforts and outcomes. Our findings align with studies that show a positive effect of training on adoption of environmental technologies in the regreening efforts in Sahel West Africa (Aker & Jack, Citation2021). Similarly, knowledge training is taken as a soft incentive that is much valued by local farmers in the studied area (Djenontin et al., Citation2020b). Experiment 2 suggests that reinforcing local leadership would increase collective restoration efforts, reasserting the significant role of exemplary local leadership in driving farmers’ engagement with collective restoration (Zulu, Citation2013; Djenontin et al., Citation2020b; Zulu, Citation2008).
Third, experiment 5, which is a combination of all the potential enabling options considered, remains the most outstanding in potential positive impact. This implies that operationalizing a management and policy package that incorporates several elements – incentives, ease of technological constraints, knowledge via training, and reinforced local leadership – would maximize restoration efforts in the forest-agriscape. This can inform both government agents and private actors promoting restoration interventions, with potential management options to integrate in implementation and governance processes.
In terms of modeling, this study exemplifies a way to address some recognized challenges of ABMs that limit their application for natural resource governance, including the ability to build a cognitive and behavioral model that effectively captures decision-making underlying socio-ecological processes and assesses their potential system-level outcomes (Ligmann-Zielinska & Sun, Citation2010). Our model operationalizes previously elicited local farmer restoration decision-making processes for both individual and collective restoration (Djenontin et al., Citation2020b) and translates them into decision rules for the model simulations. Our model also integrates diverse empirically sourced social data (qualitative and quantitative) from multiple sources to inform the model building and its calibration, addressing the issue of poor parameterization linked to scarcity of necessary data to meet the known extensive parameterization requirements of ABMs.
Our modeling presents some limitations that we acknowledge here. The built models have reduced some complexities related to external forces that may influence the environment and the larger socio-economic and political system of farmer agents. Specifically, the model has not accounted for or included climate conditions and disaster risks (droughts, floods, fires, etc.), dynamics in resource uses (trees cutting, wood collections, and charcoal production), and economic and market forces. Moreover, we have not (yet) quantified explicitly the uncertainty of the model outcomes, an important modeling step (Kelly et al., Citation2013). There are emerging new advances in handling uncertainty in ABMs, with comprehensive tests between alternatives to prospect plausible ranges and influential drivers. We intend to conduct a coupled uncertainty and sensitivity analysis to quantify the uncertainty of the model outcomes and identify the most influential factors driving each model’s outputs following previous studies (Ligmann-Zielinska, Citation2018; Ligmann-Zielinska & Jankowski, Citation2014; Ligmann-Zielinska & Sun, Citation2010; Ten Broeke et al., Citation2016). This is underway and will be part of another forthcoming paper. Further, running the model simulations for different sites and contexts will help in model refinement and broader applications for more context-informed restoration.
6 Conclusion
This study sets out to prospect for restoration implementation in Central Malawi and to offer evidence-based management and policy options to maximize existing local efforts for enhanced outcomes, using an ABM approach. The purpose was to shed light into how the spatial and temporal patterns and outcomes of landscape-scale restoration could be shaped by micro-scale social agents’ (local farmers’) decisions and consequent use of land-management practices. We further examined potential adequate intervention options to accelerate resources restoration in Malawian forest-agriscapes.
The 10-year trends and spatially explicit potential features of restoration extent and intensification, patterns of participation level, and possible landscape regreening (greenness and productivity levels) that we uncover with both collective resources and individual farmland restoration point to the value and need for empowering local, bottom-up restoration efforts. Overall, in terms of potential aggregate environmental impacts from local farmers’ restoration decisions and actions, our findings indicate that landscape greenness from collective restoration increases modestly but is fluctuating. Land productivity in individually restored farmland also increases (positive) but is much lower with a slight increment in the early year that flattens out to remain steady for most of the remaining years.
While the spatial extent of individual farmland and collective restoration remains a relative small fraction of all available land plots and collective resources in the forest-agriscape studied, there is a tendency to intensify restoration to maximize greenness and productivity. Landscape-level restoration intensity for farmlands is driven mostly by the participation level, showing this as a farmer strategy and potential intervention avenue to enhance farmer-driven restoration of agrarian landscapes. The prevailing resource-tenure system shapes participation level in restoring collective resources, with more involvement of farmers in community-owned collective resources than in state-owned collective resources. This validates appeals for enhanced resource tenure rights (access and use) and security as a key incentive to enhance local community participation in landscape restoration. It also supports the need for local tenure assessments to better understand context-explicit tenure-related obstacles to and opportunities for restoration.
In terms of enabling management and policy options, establishing appropriate incentive schemes would enhance both local collective and individual farmland restoration efforts. Harmonizing incentive mechanisms within a targeted landscape is important for cohesive restoration governance. In addition, providing necessary restoration-related knowledge, for instance, through training and improved extension systems, and promoting inspiring local leadership would augment individual farmland and collective restoration, respectively. More importantly, putting in place a management and policy package that incorporates several important elements – incentives, ease of technological constraints, knowledge, and strengthened local leadership – would have the most impact to maximize restoration of forest-agriscapes. The study shows both the potential and limitations of local farmer contributions to FLR and the need for context-specific balancing of the nature and mix of individual and collective restoration efforts across different land tenure types (government, essential private, and communal), and combination of several restoration strategies to maximize ecological and socio-economic restoration outcomes.
Overall, the study offers insights for spatially targeted and evidence-based restoration implementation in Central Malawi and demonstrates the potential of using ABM as a comprehensive approach to inform restoration management and policy with forward looking explorative options.
Acknowledgments
We extend our gratitude to the Department of Geography, Environment, and Spatial Sciences of MSU for its various institutional support. The first author thanks particularly all members of her research team in Malawi for their invaluable support in collecting the data for this research in the framework of her PhD dissertation.
Supplemental Material
Download MS Word (1 MB)Disclosure statement
No potential conflict of interest was reported by the author(s).
Supplementary material
Supplemental data for this article can be accessed online at https://doi.org/10.1080/1747423X.2022.2076948
Additional information
Funding
References
- Aker, J. C., & Jack, K. (2021). Harvesting the rain: The adoption of environmental technologies in the Sahel (No. w29518). National Bureau of Economic Research. Working Paper 29518. http://www.nber.org/papers/w29518
- An, L. (2012). Modeling human decisions in coupled human and natural systems: Review of agent-based models. Ecological Modelling, 229, 25–36. https://doi.org/10.1016/j.ecolmodel.2011.07.010
- Andersson, J.A., & D’Souza, S. (2014). From adoption claims to understanding farmers and contexts: A literature review of Conservation Agriculture (CA) adoption among smallholder farmers in Southern Africa. Agriculture, Ecosystems & Environment, 187, 116–132. https://doi.org/10.1016/j.agee.2013.08.008
- Asiama, K.O., Bennett, R., & Zevenbergen, J. (2017). Land consolidation for sub-Saharan Africa’s customary lands–the need for responsible approaches. American Journal of Rural Development, 5(2), 39–45. https://doi.org/10.12691/ajrd-5-2-2
- Asiama, K., Bennett, R., & Zevenbergen, J. (2019). Towards responsible consolidation of customary lands: A research synthesis. Land, 8(11), 161. https://doi.org/10.3390/land8110161
- Bakker, M.M., & van Doorn, A.M. (2009). Farmer-specific relationships between land use change and landscape factors: Introducing agents in empirical land use modelling. Land Use Policy, 26(3), 809–817. https://doi.org/10.1016/j.landusepol.2008.10.010
- Berger, T. (2001). Agent-based spatial models applied to agriculture: A simulation tool for technology diffusion, resource use changes and policy analysis. Agricultural Economics, 25(2–3), 245–260. https://doi.org/10.1111/j.1574-0862.2001.tb00205.x
- Bert, F.E., Podestá, G.P., Rovere, S.L., Menéndez, Á.N., North, M., Tatara, E., & Toranzo, F.R. (2011). An agent-based model to simulate structural and land use changes in agricultural systems of the Argentine pampas. Ecological Modelling, 222(19), 3486–3499. https://doi.org/10.1016/j.ecolmodel.2011.08.007
- Besseau, P., Graham, S., & Christophersen, T. (2018). Restoring forests and landscapes: The key to a sustainable future Global Partnership on Forest and Landscape Restoration.
- Brandt, M., Tucker, C.J., Kariryaa, A. (2020). An unexpectedly large count of trees in the West African Sahara and Sahel. Nature, 587, 78–82. https://doi.org/10.1038/s41586-020-2824-5
- Castella, J.C., Trung, T.N., & Boissau, S. (2005). Participatory simulation of land-use changes in the northern mountains of Vietnam: The combined use of an agent-based model, a role-playing game, and a geographic information system. Ecology and Society, 10(1), 27. https://doi.org/10.5751/ES-01328-100127
- Chinangwa, L., Sinclair, F., Pullin, A.S., & Hockley, N. (2016). Can co-management of government forest reserves achieve devolution? Evidence from Malawi. Forests, Trees and Livelihoods, 25(1), 41–58. https://doi.org/10.1080/14728028.2015.1087886
- Cohen-Shacham, E., Andrade, A., Dalton, J., Dudley, N., Jones, M., Kumar, C., … Walters, G. (2019). Core principles for successfully implementing and upscaling Nature-based Solutions. Environmental Science & Policy, 98, 20–29. https://doi.org/10.1016/j.envsci.2019.04.014
- Curtis, P.G., Slay, C.M., Harris, N.L., Tyukavina, A., & Hansen, M.C. (2018). Classifying drivers of global forest loss. Science, 361(6407), 1108–1111. https://doi.org/10.1126/science.aau3445
- Didan, K. (2015). MOD13Q1 MODIS/Terra Vegetation Indices 16-Day l3 global 250m sin grid v006 [data set]. NASA EOSDIS Land Processes DAAC. Accessed in February 2021. from. https://doi.org/10.5067/MODIS/MOD13Q1.006
- Djenontin, I.N.S., Foli, S., & Zulu, L.C. (2018). Revisiting the factors shaping outcomes for forest and landscape restoration in sub-Saharan Africa: A way forward for policy, practice and research. Sustainability, 10(4), 906. https://doi.org/10.3390/su10040906
- Djenontin, I.N., Zulu, L.C., & Etongo, D. (2020a). Ultimately, what is forest landscape restoration in practice? Embodiments in sub-Saharan Africa and implications for future design. Environmental Management, 1–23.
- Djenontin, I.N.S., Zulu, L.C., & Ligmann-Zielinska, A. (2020b). Improving representation of decision rules in LUCC-ABM: An example with an elicitation of farmers’ decision making for landscape restoration in central Malawi. Sustainability, 12(13), 5380. https://doi.org/10.3390/su12135380
- Djenontin, I.N.S., & Zulu, L.C. (2021). The quest for context-relevant governance of agro-forest landscape restoration in Central Malawi: Insights from local processes. Forest Policy and Economics, 131, 124–102555. https://doi.org/10.1016/j.forpol.2021.102555
- Djenontin, I.N.S., Zulu, L.C., & Richardson, R. (forthcoming). Farmers’ forest landscape restoration in sub-Saharan Africa. Evidence from Central Malawi.
- Erbaugh, J.T., Pradhan, N., Adams, J., Oldekop, J.A., Agrawal, A., Brockington, D., Chhatre, A. (2020). Global forest restoration and the importance of prioritizing local communities. Nature Ecology & Evolution, 4(11), 1472–1476. https://doi.org/10.1038/s41559-020-01282-2
- [FAO]. Food and Agriculture Organization. (2020). Global forest resources assessment 2020 – key findings. Rome. https://doi.org/10.4060/ca8753en
- Gilbert, N. (2008). Agent-Based Models. Quantitative applications in the social science London, Thousand Oaks.
- Gondwe, M.F., Cho, M.A., Chirwa, P.W., & Geldenhuys, C.J. (2019). Land use land cover change and the comparative impact of co-management and government-management on the forest cover in Malawi (1999-2018). Journal of Land Use Science, 14(4–6), 281–305. https://doi.org/10.1080/1747423X.2019.1706654
- Grimm, V., Berger, U., DeAngelis, D.L., Polhill, J.G., Giske, J., & Railsback, S.F. (2010). The ODD protocol: A review and first update. Ecological Modelling, 221(23), 2760–2768. https://doi.org/10.1016/j.ecolmodel.2010.08.019
- Grimm, V., Polhill, G., & Touza, J. (2017). Documenting social simulation models: the odd protocol as a standard. In B. Edmonds & R. Meyer (Eds.), Simulating social complexity. understanding complex systems. Springer. https://doi.org/10.1007/978-3-319-66948-9_15
- Grimm, V., Railsback, S.F., Vincenot, C.E., Berger, U., Gallagher, C., DeAngelis, D.L., & Ayllón, D. (2020). The ODD protocol for describing agent-based and other simulation models: A second update to improve clarity, replication, and structural realism. Journal of Artificial Societies and Social Simulation, 23(2). https://doi.org/10.18564/jasss.4259
- Hansen, M.C., Potapov, P.V., Moore, R., Hancher, M., Turubanova, S.A., Tyukavina, A., & Townshend, J. (2013). High-resolution global maps of 21st-century forest cover change. Science, 342(6160), 850–853. https://doi.org/10.1126/science.1244693
- Harrell, F.E., Jr. (2015). Regression modeling strategies: With applications to linear models, logistic and ordinal regression, and survival analysis. Springer.
- Hughes, K., Oduol, J., Kegode, H., Ouattara, I., Vagen, T., Winowiecki, L.A., Bourne, M., Neely, C., Ademonla, D.A., Carsan, S., Van Schoubroeck, F., & Chomba, S. (2020). Regreening Africa Consolidated Baseline Survey Report. World Agroforestry.Nairobi, Kenya.
- Kandel, M., Agaba, G., Alare, R.S., Addoah, T., & Schreckenberg, K. (2021). Assessing social equity in farmer-managed natural regeneration (FMNR) interventions: findings from ghana. Ecological Restoration, 39(1), 64–76. https://doi.org/10.3368/er.39.1-2.64
- Kelly, R.A., Jakeman, A.J., Barreteau, O., Borsuk, M.E., ElSawah, S., Hamilton, S.H., van Delden, H. (2013). Selecting among five common modelling approaches for integrated environmental assessment and management. Environmental Modelling and Software, 47, 159–181. https://doi.org/10.1016/j.envsoft.2013.05.005
- King, R., & Burton, S. (1982). Land fragmentation: Notes on a fundamental rural spatial problem. Progress in Human Geography, 6(4), 475–494. https://doi.org/10.1177/030913258200600401
- Lawry, S., Samii, C., Hall, R., Leopold, A., Hornby, D., & Mtero, F. (2017). The impact of land property rights interventions on investment and agricultural productivity in developing countries: A systematic review. Journal of Development Effectiveness, 9(1), 61–81. https://doi.org/10.1080/19439342.2016.1160947
- Le Polain de Waroux, Y., Garrett, R.D., Chapman, M., Friis, C., Hoelle, J., Hodel, L., Hopping, K., & Gwendolin Zaehringer, J. (2021). The role of culture in land system science. Journal of Land Use Science, 16(4), 450–466. https://doi.org/10.1080/1747423X.2021.1950229
- Ligmann-Zielinska, A., & Sun, L. (2010). Applying time dependent variance-based global sensitivity analysis to represent the dynamics of an agent-based model of land use change. International Journal of Geographical Information Science, 24(12), 1829–1850. https://doi.org/10.1080/13658816.2010.490533
- Ligmann-Zielinska, A., & Jankowski, P. (2014). Spatially-explicit integrated uncertainty and sensitivity analysis of criteria weights in multicriteria land suitability evaluation. Environmental Modelling and Software, 57, 235–247. https://doi.org/10.1016/j.envsoft.2014.03.007
- Ligmann-Zielinska, A. (2018). Can you fix it? Using variance-based sensitivity analysis to reduce the input space of an agent-based model of land use change. In Thill, J.-C, Dragicevic, S (eds). GeoComputational analysis and modeling of regional systems, Advances in Geographic Information Science (pp. 77–99). Springer, Cham. doi:10.1007/978-3-319-59511-5_6
- Lovo, S. (2016). Tenure insecurity and investment in soil conservation. Evidence from Malawi. World Development, 78, 219–229. https://doi.org/10.1016/j.worlddev.2015.10.023
- Mansourian, S. (2021). Disciplines, sectors, motivations and power relations in forest landscape restoration. Ecological Restoration, 39(1), 16–26. https://doi.org/10.3368/er.39.1-2.16
- Matthews, R.B., Gilbert, N.G., Roach, A., Polhill, J.G., & Gotts, N.M. (2007). Agent-based land-use models: A review of applications. Landscape Ecology, 22(10), 1447–1459. https://doi.org/10.1007/s10980-007-9135-1
- McLain, R., Lawry, S., Guariguata, M.R., & Reed, J. (2018). Toward a tenure-responsive approach to forest landscape restoration: A proposed tenure diagnostic for assessing restoration opportunities. Land Use Policy, 104, 103748. https://doi.org/10.1016/j.landusepol.2018.11.053
- Messina, J.P., Peter, B.G., & Snapp, S.S. (2017). Re-evaluating the Malawian farm input subsidy programme. Nature Plants, 3(4), 17013. https://doi.org/10.1038/nplants.2017.13
- Meyfroidt, P. (2013). Environmental cognitions, land change, and social–ecological feedbacks: An overview. Journal of Land Use Science, 8(3), 341–367. https://doi.org/10.1080/1747423X.2012.667452
- Miller, J.H., & Page, S.E. (2007). Complex adaptive systems. an introduction to computational models of social life.Princeton, NJ.
- [MNREM]. Ministry of Natural Resources, Energy and Mining. (2017a). National forest landscape restoration strategy. Lilongwe, Malawi; 44pp.
- [MNREM]. Ministry of Natural Resources, Energy and Mining. (2017b). Forest Landscape Restoration Opportunities Assessment for Malawi. NFLRA, IUCN, WRI. xv; Lilongwe, Malawi; 126pp .
- [MNREM]. Ministry of Natural Resources, Energy and Mining. (2018). A framework for monitoring progress on Malawi’s national forest landscape restoration strategy.
- Müller, B., Bohn, F., Dreßler, G., Groeneveld, J., Klassert, C., Martin, R., Schwarz, N. (2013). Describing human decisions in agent-based models–ODD+ D, an extension of the ODD protocol. Environmental Modelling and Software, 48, 37–48.
- Mwangi, M. (2017). Effects of livelihood-diversification on sustainability of natural resources in the rangelands of East Africa: participatory field studies and results of an agent-based model using the knowledge of indigenous maasai pastoralists of Kenya. In S. Gray, M. Paolisso, R. Jordan, & S. Gray (Eds.), Environmental modeling with stakeholders (pp. 189-210). Springer, Cham. https://doi.org/10.1007/978-3-319-25053-3_10
- Nagendra, H. (2007). Drivers of reforestation in human-dominated forests. Proceedings of the National Academy of Sciences, 104( 39), 15218–15223.
- [NSO]. National Statistical Office (2019). 2018 Malawi population and housing census. Main Report. Government of Malawi.
- Ntihinyurwa, P.D., & de Vries, W.T. (2021). Farmland fragmentation concourse: Analysis of scenarios and research gaps. Land Use Policy, 100, 1–21, 104936. https://doi.org/10.1016/j.landusepol.2020.104936
- Parker, D.C., Manson, S.M., Janssen, M.A., Hoffmann, M.J., & Deadman, P. (2003). Multi‐agent systems for the simulation of land‐use and land‐cover change: A review. Annals of the Association of American Geographers, 93(2), 314–337. https://doi.org/10.1111/1467-8306.9302004
- Peter, B.G., Messina, J.P., & Snapp, S.S. (2018). A multiscalar approach to mapping marginal agricultural land: smallholder agriculture in Malawi. Annals of the American Association of Geographers, 1–17.
- Qi, J., Tao, S., Pueppke, S.G., Espolov, T.E., Beksultanov, M., Chen, X., & Cai, X. (2020). Changes in land use/land cover and net primary productivity in the transboundary Ili-Balkhash basin of Central Asia, 1995–2015. Environmental Research Communications, 2(1), 011006. https://doi.org/10.1088/2515-7620/ab5e1f
- Running, S., & Zhao, M. (2019). MOD17A3HGF MODIS/Terra Net Primary Production Gap-Filled Yearly L4 Global 500 m SIN Grid V006 [Data set]. NASA EOSDIS Land Processes DAAC, https://doi.org/10.5067/MODIS/MOD17A3HGF.006
- Sayama, H. (2015). Introduction to the modeling and analysis of complex systems. Open SUNY Textbooks.
- Schlecht, E., Buerkert, A., Tielkes, E., & Bationo, A. (2006). A critical analysis of challenges and opportunities for soil fertility restoration in Sudano-Sahelian West Africa. Nutrient Cycling in Agroecosystems, 76(2–3), 109–136. https://doi.org/10.1007/s10705-005-1670-z
- Schreinemachers, P., & Berger, T. (2011). An agent-based simulation model of human–environment interactions in agricultural systems. Environmental Modelling and Software, 26(7), 845–859. https://doi.org/10.1016/j.envsoft.2011.02.004
- Senganimalunje, T.C., Chirwa, P.W., Babalola, F.D., & Graham, M.A. (2016). Does participatory forest management program lead to efficient forest resource use and improved rural livelihoods? Experiences from mua-livulezi forest reserve. Agroforestry Systems, 90(4), 691–710. https://doi.org/10.1007/s10457-015-9826-6
- Sigman, E., & Elias, M. (2021). Three approaches to restoration and their implications for social inclusion. Ecological Restoration, 39(1), 27–35. https://doi.org/10.3368/er.39.1-2.27
- Sikor, T., He, J., & Lestrelin, G. (2017). Property rights regimes and natural resources: A conceptual analysis revisited. World Development, 93, 337–349. https://doi.org/10.1016/j.worlddev.2016.12.032
- Singh, R., Shelar, K., Duraisami, M., Anderson, W., & Gautam, R.S. (2021). Equitable and inclusive landscape restoration planning: learning from a restoration opportunity assessment in India. Ecological Restoration, 39(1), 108–119. https://doi.org/10.3368/er.39.1-2.108
- Ten Broeke, G., Van Voorn, G., & Ligtenberg, A. (2016). Which sensitivity analysis method should I use for my agent-based model? Journal of Artificial Societies and Social Simulation, 19(1), 5. https://doi.org/10.18564/jasss.2857
- USGS-USAID. (2018). Malawi Land Use and Land Cover and On-Farm Tree Density 2017. Map of on-farm percent tree cover, prepared from visual analysis of high resolution imagery, mostly from the year 2017, using area frame samples spaced at 2-km intervals on a regular grid. Draft Maps prepared by USGS/USAID
- Valbuena, D., Verburg, P. H., Veldkamp, A., Bregt, A. K, and Ligtenberg, A. (2010). Effects of farmers’ decisions on the landscape structure of a Dutch rural region: An agent-based approach. Landscape and Urban Planning, 97(2), 98–110. https://doi.org/10.1016/j.landurbplan.2010.05.001
- Wimolsakcharoen, W., Dumrongrojwatthana, P., Le Page, C., Bousquet, F., & Trébuil, G. (2021). An agent-based model to support community forest management and non-timber forest product harvesting in northern Thailand. Socio-Environmental Systems Modelling, 3, 17894. https://doi.org/10.18174/sesmo.2021a17894
- Wortley, L., Hero, J.M., & Howes, M. (2013). Evaluating ecological restoration success: A review of the literature. Restoration Ecology, 21(5), 537–543. https://doi.org/10.1111/rec.12028
- Zulu, L.C. (2008). Community-forest management in Southern Malawi: Solution or part of the problem? Society And. Natural Resources, 21(8), 687–703. https://doi.org/10.1080/08941920802039242
- Zulu, L.C. (2013). Bringing people back into protected forests in developing countries: Insights from co-management in Malawi. Sustainability, 5(5), 1917–1943. https://doi.org/10.3390/su5051917
Appendix
Comparison of the spatially explicit trends among the base and experimental models for collective resources restoration ().
Spatially explicit patterns and outcomes of individual land-plot restoration ().
Comparison of the spatially explicit trends among the base and experimental models for individual land-plot restoration ().
Figure A1. Comparison of the spatially explicit trends of the extent of restoration among the base and experimental models for collective restoration.
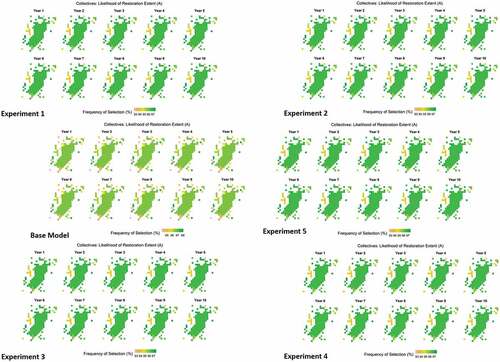
Figure A2. Comparison of the spatially explicit trends of restoration intensity and participation level among the base and experimental models for collective restoration
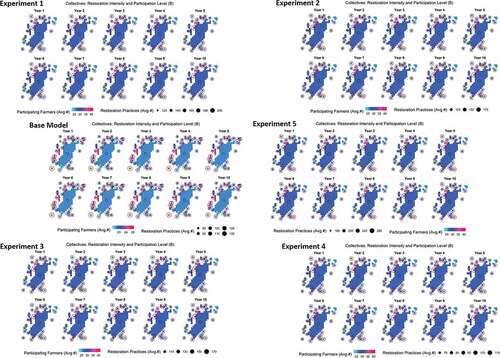
Figure A3. Spatially explicit trends of patterns and outcomes of individual land restoration (Base model, panels A-B).
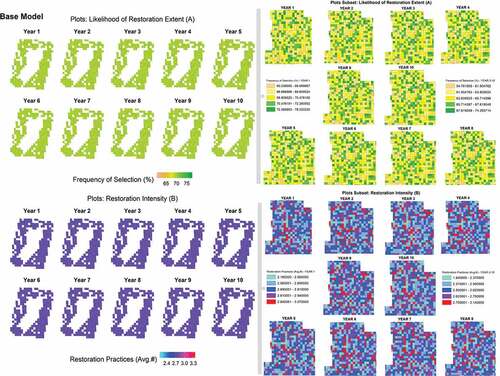
Figure A4. Comparison of the spatially explicit trends in the extent of restoration among the base and experimental models for individual land-plot restoration.
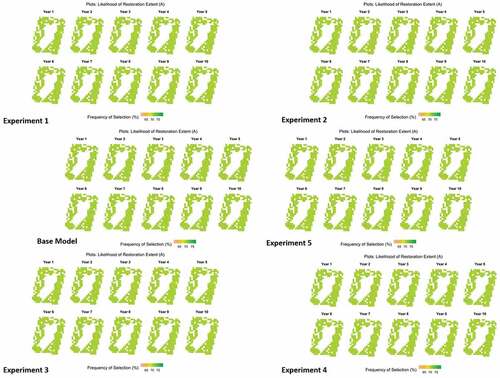
Figure A5. Comparison of the spatially explicit trends in restoration intensity and participation level among the base and experimental models for individual land-plot restoration