
 ?Mathematical formulae have been encoded as MathML and are displayed in this HTML version using MathJax in order to improve their display. Uncheck the box to turn MathJax off. This feature requires Javascript. Click on a formula to zoom.
ABSTRACT
Terrestrial biomass carbon stocks (BCS) play a vital role in the climate system, but benchmarked estimates prior to the late twentieth century remain scarce. Here, by making use of an early global forest resource assessment and harmonizing information on land use and carbon densities, we establish a global BCS account for the year 1950. Our best-guess BCS estimate is 450.2 PgC (median of all modulations: 517.8 PgC, range: 443.7–584.0 PgC), with ecosystems in Southern America and Western Africa storing c. 27 and 16% of the total respectively. Our estimates are in line with land change emissions estimates and suggest a reduction in BCS of 8–29% compared to the median, with losses in tropical subcontinents partially offset by gains in northern subcontinents. Our study demonstrates an approach to reconstruct global BCS by triangulating different data sources and extends the study of global BCS accounts further back into the twentieth century.
1. Introduction
In the hypothetical absence of human activities, the global terrestrial biomass would store 900–950 PgC (Erb et al., Citation2018). Starting from their first signatures more than 12,000 years ago (Ellis, Citation2021), anthropogenic land cover change and land management have greatly impacted carbon dynamics in natural ecosystems. The extent and intensity of land use change has accelerated in the twentieth century (Houghton et al., Citation1983; Houghton & Nassikas, Citation2017; Kastner et al., Citation2021b; Ramankutty & Foley, Citation1999). This acceleration is concomitant with increasing production, trade and consumption of biomass commodities (Kastner et al., Citation2021b; Krausmann & Langthaler, Citation2019) and a growth of resource use in general (Krausmann et al., Citation2013; Krausmann & Langthaler, Citation2019) over the last few decades.
To account for the carbon impacts of long-term land cover change and land management, existing vegetation modelling-based efforts span several decades (Houghton et al., Citation1983) or even millennia (Pongratz et al., Citation2009). These modelling approaches focus on accounting for carbon flows between vegetation, atmosphere, and societal use, without necessarily aiming to establish robust estimates of terrestrial biomass carbon stocks (BCS). Two such major modelling approaches exist to assess long-term carbon fluxes: (1) book-keeping models (Gasser et al., Citation2020; Hansis et al., Citation2015; Houghton & Nassikas, Citation2017) and (2) process-based dynamic vegetation models (Poulter et al., Citation2011; Vuichard et al., Citation2019; Yang et al., Citation2020). Book-keeping approaches quantify the impact of land use on carbon emissions, and therefore only quantify a fraction of BCS change, excluding the impacts of environmental change or legacy effects from management (Erb et al., Citation2013; Le Noë et al., Citation2020). Process-based models, in principle, account for environmental drivers and legacy effects as well, but their coverage of land management impacts is still relatively modest and imperfect, resulting in large uncertainties (Friedlingstein et al., Citation2019; Pongratz et al., Citation2018). In particular, the lack of direct on-ground assessments of BCS hampers the calibration of results from these sets of analyses, hindering efforts to reduce the considerable uncertainties in historical BCS accounts (Li et al., Citation2017; Pongratz et al., Citation2021).
Inventory-based approaches are well placed to offer episodic (decadal, multi-decadal) reconstructions of BCS, especially across the twentieth century (Brown, Citation2002; Brown & Lugo, Citation1984; FAO, Citation2018; Liski et al., Citation2006). However, recent global assessments based on field-based biomass observations and remote sensing data only start in 1990 (FAO, Citation2018) and mainly cover the start of the twenty-first century (Erb et al., Citation2018; Spawn et al., Citation2020; Xu et al., Citation2021). Other longer-term efforts are constrained by their regional focus (Gingrich et al., Citation2007; Le Noë et al., Citation2021b; Richards & Flint, Citation1994). In this background, a complementary approach focussed on estimating global BCS in a harmonized and integrative manner is required to not only better understand the dynamics of the carbon cycle over time (Houghton & Nassikas, Citation2017; Li et al., Citation2017), but also to contextualise estimates of carbon gains across regions (Griscom et al., Citation2017) and examine global land use transitions like the forest transition (Kauppi et al., Citation2006, Citation2020; Meyfroidt & Lambin, Citation2011).
Here, we start filling this research gap by constructing a global country-level BCS dataset for the mid-twentieth century. We develop a closed-budget land use accounting approach to estimate global BCS based around the year 1950, when one of the earliest consistent and harmonised global assessments was initiated by the UN Food and Agriculture Organization (FAO). We demonstrate an approach to integrate information from early FAO Forest Resource Assessments with other sources of information on land use, BCS densities and ecological potentials in a targeted and specific manner. This allows us to explore changing BCS dynamics over the largest possible contemporary timeperiod. The mid-twentieth century constitutes a vital signpost for long-term carbon budgeting studies (Hurtt et al., Citation2020; Klein Goldewijk et al., Citation2017) and a key turning point in global land use dynamics. It is situated just after the end of World War II and just before, or coinciding with, the end of the colonial period across much of the tropics. Subsequent decades have witnessed an increase in frontier deforestation for agricultural expansion in tropical countries (DeFries et al., Citation2002; Richards & Flint, Citation1994; Williams, Citation2006) for serving political and economic development objectives (Garrett et al., Citation2021; Hosonuma et al., Citation2012), as well as, in contrast, a net increase in forest cover and forest carbon stocks in some countries in the Global North, described by the so-called ‘forest transition’ (Gingrich et al., Citation2022; Meyfroidt & Lambin, Citation2011; Rudel et al., Citation2020).
In this study, we aim to:
Establish a global terrestrial biomass carbon stock account for the year 1950.
Conduct an uncertainty and sensitivity analysis.
Discuss differences among world regions and land categories.
Compare these estimates with assessments for the start of the twenty-first century.
We operationalise an approach to triangulate information from land inventories and other ecological datasets to establish BCS accounts. In this way, we extend the study of global BCS accounts further back into the twentieth century and set a benchmark for further longer-term analyses. Further, our approach aims to provide a data-derived estimate that, when compared to recent BCS estimates, enables an assessment of BCS changes over the 2nd half of the twentieth century.
2. Materials and methods
We undertake a global country-level BCS assessment considering above-ground biomass and below-ground biomass, while excluding carbon stored in litter, deadwood, soil, and harvested wood products. The below-ground biomass refers to the biomass of live roots, distinguishing it from the carbon stored in mineral and organic soils (Eggleston et al., Citation2006). Our methodological focus is on understanding and estimating BCS in terrestrial vegetation. We exclude BCS in aquatic vegetation and peatlands because of a lack of data on their spatial extent and carbon densities globally for the mid-twentieth century, although recent evidence indicates that tropical peatlands in particular are exceptionally carbon-rich ecosystems, estimated to store one-third of the global soil carbon on only 3% of the Earth’s surface (Dargie et al., Citation2017; Warren et al., Citation2017).
We combine contemporaneous statistical information on global land use (FAO, Citation1957; Kastner et al., Citation2021b; Silva et al., Citation2011; ) in a closed-budget vegetation approach, which allocates terrestrial land areas into considered land categories ().
Figure 1. Land categories discerned in this study and their global distribution. The shifting cultivation adjustment includes short fallows (120.1 Mha) and long fallows (138.7 Mha). Land areas mentioned in Accessible forest, Inaccessible forest and Other vegetated land represent areas without shifting cultivation and are used for the best-guess estimate (see, Section 2.1.7 and SI Text 2).
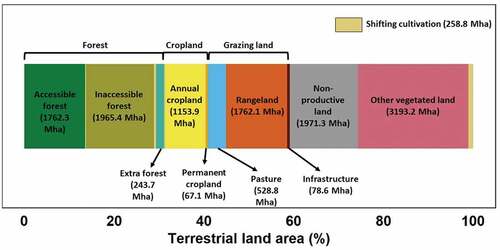
Table 1. Summary of the data sources used for estimating areas under each land category per country (n = 140). For more details on the categorization logic used for each land category, see text.
To each land category, we assign country-level carbon density values either from available datasets or assign them typical values from the literature. Attributing carbon densities to land categories (for example, forests, rangelands, pastures) for each country is challenging because national land use statistics are neither consistently mapped nor linked to natural ecosystems. Further, no information is available for some ecosystems, in particular, other vegetated lands. We address this challenge by developing a range of plausible estimates of carbon densities that enables us to quantify the uncertainty of BCS in each country. In this way, we not only describe the carbon state of forest ecosystems, but also of grazing areas (pastures as well as rangelands), which cover a significant proportion of the total productive area globally and exist in a range of woody ecosystem states (Erb et al., Citation2007; Fetzel et al., Citation2017b).
We gather carbon density estimates derived from national-level inventories compiled by the FAO (FAO, Citation1957, Citation1960, Citation1963) or presented in other scientific studies, for example, for South and Southeast Asia (Richards & Flint, Citation1994), East Asia (Choi et al., Citation2002; Fang et al., Citation2001, Citation2005), the United States (Magerl et al., Citation2019) and some European countries (Gingrich et al., Citation2007; Le Noë et al., Citation2020; SI Table S3). We use standardized factors (Eggleston et al., Citation2006) and previously-used estimates from the literature (Haberl et al., Citation2007) for conversion of area and carbon density estimates into carbon stocks. This includes the use of average wood densities for coniferous and non-coniferous woody biomass, root-to-shoot ratios (SI Table S10) and a carbon fraction of 0.5 (Eggleston et al., Citation2006; Haberl et al., Citation2007). In this way, we reconstruct BCS for 140 countries, considering the political boundaries of 1950 (SI Table S1), and aggregate these estimates to 14 subcontinental units (SI Figure S1). We consider major administrative boundary changes but do not account for small-scale border adjustments (SI Table S2).
2.1 Derivation of land categories and biomass carbon stock densities
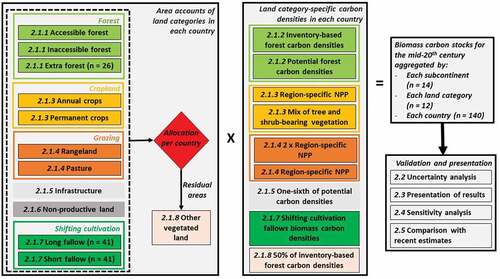
The schematic of our approach is provided in . Section 2.1 explains in detail our approach to reconstruct land areas and BCS density accounts for each land category (Sections 2.1.1–2.1.8) per country. We perform a series of modulations of carbon densities in each land category based on different assumptions of the likely presence of woody biomass (SI Table S6). We use all modulations to perform a comprehensive uncertainty assessment (Section 2.2), select one modulation for a detailed analysis (Section 2.3) and identify which land category displays the highest sensitivity (Section 2.4). Lastly, we describe the comparison of our results with estimates from the beginning of the twenty-first century (Erb et al., Citation2018; Spawn et al., Citation2020; Xu et al., Citation2021; Section 2.5).
Figure 2. The schematic flow of the approach used in this study to calculate national biomass carbon stock accounts. Area estimates for each land category are combined with biomass carbon stock density values (here shown for the best-guess case) to estimate total biomass carbon stocks per country. Numbers before each item denote respective sub-sections in the manuscript.
2.1.1 Forest areas
We develop a new estimate of global forest areas in the mid-twentieth century which accounts for areas under different forest carbon densities based on the likely presence of forest management regimes. This makes use of areas reported in forest inventories, while overcoming some of the shortcomings of historical area assessments, especially in tropical countries (Chazdon et al., Citation2016a; Grainger, Citation2008).
We use forest area estimates from the FAO World Forest Resources Assessment 1953 (hereafter, the 1953 Assessment). The 1953 Assessment is the 2nd such assessment undertaken by the FAO (FAO, Citation1957, Citation2018), compiling data from country reports following an established forest area definition. According to the 1953 Assessment, forests are ‘All lands bearing vegetative associations dominated by trees of any size, exploited or not, capable of producing wood or of exerting an influence on the local climate or on the water regime’ (FAO, Citation1957, p. 112).
According to recent reconstructions of global land-use dynamics (Kastner et al., Citation2021b; Klein Goldewijk et al., Citation2017), forest areas provided by the 1953 Assessment were under-reported for some countries. Two key reasons for this situation are the comparatively lower reporting capabilities of some tropical countries (Grainger, Citation2008; Romijn et al., Citation2015) and the nature of the prevailing ‘forest’ definition which likely neglected sparse tree-bearing ecosystems unfit for timber extraction (Chazdon et al., Citation2016a).
To quantify the extent of this underreporting, we compare forest areas reported by the 1953 Assessment with FAO-led Forest Resource Assessments of the early twenty-first century, and find an increase in forest areas in 26 tropical countries, despite there being no consistent evidence from other sources of an increase in forest areas. Rather, periodic assessments of the FAO (Caravaggio, Citation2020; Lanly, Citation1982) frequently identify high tropical deforestation rates in these countries across the 2nd half of the twentieth century. We therefore introduce the additional sub-category of ‘Extra forest’, defined as the difference between forests (as provided in the 1953 Assessment) and the sum of the area under forestry and potentially forested wilderness areas in 1950 (Kastner et al., Citation2021b; Ramankutty & Foley, Citation1999) in these 26 tropical countries (SI Table S4). A total of 282.9 Mha was added to the forest category. The correction results in a 7.4% increase in the total forest area.
2.1.2 Forest carbon densities
We place particular emphasis on the derivation of carbon densities in forests because forests store manifold times more aboveground biomass carbon per unit area than all other land categories (Pan et al., Citation2013).
The 1953 Assessment provides a detailed categorization on forest types based on extent of use and its volumes (FAO, Citation1957). Being primarily a timber assessment meant to estimate timber flows to service post-War economies (Chazdon et al., Citation2016b), the 1953 Assessment distinguishes ‘accessible’ and ‘inaccessible’ forests based on physical and economic accessibility.
We interpret this distinction in terms of the likely presence/absence of forest management regimes involving significant wood harvest. We consider ‘Accessible forests’ as secondary forests under active management regimes, while ‘Inaccessible forests’ are considered to match the average potential vegetation in a country (SI Text 2).
For accessible forests, we derive average forest carbon densities based on growing stock information from global assessments which compiled inventory information from individual countries (FAO, Citation1957, Citation1960, Citation1963). Where possible, we used information derived from the 1953 Assessment, and used information from subsequent assessments when necessary to make up for data gaps.
We convert growing stock volumes to BCS estimates by considering (1) wood density values classified per continent and biome-type, (2) region-specific biomass expansion factors (BEFs), (3) a root-to-shoot ratio classified per biome-type (Haberl et al., Citation2007) and (4) a constant carbon fraction of 0.5 (Eggleston et al., Citation2006).
We use the formula:
Where, B = Biomass Stocks (in tonnes); GS = total growing stock volume (in m3); WD = Wood Density (in t/m3); RSr = Root/Shoot ratio (unitless); BCS = Biomass Carbon Stocks (in tonnes); CF = Carbon Fraction (unitless).
For 17 countries, we use independent assessments of forest carbon densities for South and Southeast Asia (Richards & Flint, Citation1994), East Asia (Choi et al., Citation2002; Fang et al., Citation2005), United States (Magerl et al., Citation2019) and some European countries (Gingrich et al., Citation2007; Le Noë et al., Citation2020) derived from local forest inventories (SI Table S3). Combining these assessments, we obtain forest carbon density estimates for a total of 100 countries, which cover 87.2% of all forests in the world (SI Figure S2).
For the 40 countries lacking growing stock information, we derive subcontinental-averaged estimates of BCS densities to combine with the reported country-level forest area estimates. This approach is similar to IPCC ‘Tier 2’ methods (Eggleston et al., Citation2006) that apply region-specific carbon density values to the country-specific forest areas.
We assume that ‘Inaccessible forests’ and ‘Extra forests’ were undisturbed by management or harvest activities and allocate them per-country carbon density values for ‘potential forests’, i.e. forests in the absence of human intervention (Erb et al., Citation2018). See SI Table S6 for all modulations performed for this land category.
2.1.3 Cropland
We obtain cropland areas from a long-term study of global land use (Kastner et al., Citation2021b), which is based on historical statistical records from the FAO and the HYDE long-term land use dataset (Klein Goldewijk et al., Citation2017).
Available cropland estimates combine areas under annual croplands (including multi-cropping) and permanent croplands. We distinguish these two subcategories by estimating the permanent crop fraction, ie. the proportion of permanent crops in total cropland per country, using FAOSTAT data for the years 1961–1965 as the value for the year 1950 (SI Text 2). These years represent the first years of consistent and harmonized data collection by the FAO. We consider the categories ‘Land under permanent crops’ and ‘Cropland’ to make this distinction.
We assume that each country only belongs to one biome type – tropical, temperate or boreal, and consider the biome type as a fixed conditioning variable. For annual crops, we allocate an average carbon density equivalent to their climatic-zone averaged Net Primary Productivity, or NPP (Krausmann et al., Citation2013). For permanent crops, we allocate an average carbon density of 22.5tC/ha, assuming an equal mix of tree-bearing and shrub-bearing permanent crops per country, in line with established estimates (Erb et al., Citation2018).
2.1.4 Grazing land
Grazing land is an umbrella term for many different land categories that can potentially be used for grazing or mowing (hay, silage) with very different land use intensities. Information on this land category remains scarce despite its vast geographical extent. Furthermore, data quality varies greatly among the individual nations as many ambiguities related to definitions exist (Erb et al., Citation2007; Fetzel et al., Citation2017a).
We delineate two kinds of grazing land based on the Aridity Index and population density, namely (1) permanent pastures and (2) rangelands (Klein Goldewijk et al., Citation2017), and allocate carbon densities based on the nature and temporal duration of vegetation.
Pasture
We consider pasture areas from (Kastner et al., Citation2021b) and allocate an average carbon density equivalent to their subcontinental-averaged NPP to account for their yearly use (Kastner et al., Citation2021b).
Rangeland
We consider rangeland areas from (Kastner et al., Citation2021b). We allocate a carbon density of twice the subcontinental-average NPP to account for the likely turnover times in these ecosystems (Kastner et al., Citation2021b). Since information on carbon densities in this land category remains relatively scarce, we also perform a set of modulations relying on existing literature (Kastner et al., Citation2021b; Xia et al., Citation2014). See SI Table S6 for all modulations performed for this land category.
2.1.5 Infrastructure
We consider infrastructure areas from (Kastner et al., Citation2021b). In the absence of reliable datasets and due to the small extent of this land category, carbon densities are calculated as one-sixth of potential mean biomass carbon densities at the country level, derived from a spatially-explicit FAO-based potential biomass carbon stocks map for the year 2000 (Erb et al., Citation2018).
2.1.6 Non-productive land
Non-productive areas (for example, hot and cold deserts), by definition, are assumed to be devoid of any BCS (Kastner et al., Citation2021b). We do not account for the possible existence of scattered woody biomass, for example, in shrubs, in this land use type because of a lack of a reliable reference.
2.1.7 Shifting cultivation
Shifting cultivation, or swidden agriculture, is a rotational mode of smallholder agriculture essentially restricted to the tropics since the start of the twentieth century (Heinimann et al., Citation2017). Information on its spatial extent remains limited (Houghton, Citation2010). The rotational form of agriculture practiced means that landscape-averaged carbon densities is lower under shifting cultivation than in forests but larger than in permanent croplands (Houghton et al., Citation2012; Mertz et al., Citation2021). We adjust for the presence of shifting cultivation fallows by performing two sets of modulations which accounted for their extent and carbon density (SI Table S6).
In the first modulation, we assume that the effects of shifting cultivation are reported in existing inventory accounts for 1950. In these cases, no modifications to carbon densities are made.
In the second modulation, which we use in the best-guess estimate (), we assume shifting cultivation fallows as a separate and additional land category. In the absence of datasets that describe the extent of shifting cultivation in the mid-twentieth century, we consider a more recent pantropical estimate for the year 2000 (Silva et al., Citation2011). The study describes a total area under shifting cultivation, ie. the area of currently cultivated fields and fallows, to be 258.8 Mha. This likely represents a modest under-estimate for the mid-twentieth century (see SI Text 2: Further information for each land category). We assumed that any land with the presence of shifting cultivation that is not recorded as cropland would exist in one of two land use-land cover states: (1) short fallows (cultivation of 2 years followed by fallows of 4 years) or (2) long fallows (fallows of more than 6 years; Fearnside, Citation2000). This modulation is considered in our best-guess estimate.
Table 2. Carbon stock accounting approaches for the best-guess case considered in the study.
We gather country-level information on the total shifting cultivation areas and aboveground biomass densities for short and long fallows (Silva et al., Citation2011) as well as average fallow lengths (Fearnside, Citation2000) for a total of 41 countries under the administrative boundaries of the year 1950. We assume a root-shoot ratio of 0.28 and a carbon fraction of 0.5 to convert aboveground biomass densities into total BCS densities (Eggleston et al., Citation2006).
2.1.8 Other vegetated land
Land area in this land category is estimated in a subtractive approach, ie. this land category encompasses all land use and land cover types not addressed so far. We allocate carbon densities to this land category based on the likely presence of woody biomass, building on estimates and approaches from previous literature to determine carbon densities of sparse tree-bearing ecosystems (Erb et al., Citation2018). See SI Table S6 for all modulations performed for this land category.
2.2 Uncertainty analysis
To improve the understanding of the role of considered modulations on the overall BCS estimates, we perform a sensitivity and uncertainty analysis by varying carbon densities for each land category.
For accessible forests, we derive an uncertainty scale based on the reporting capability of the country and the kind and volume of information available in historical FAO datasets, assuming that the capacity of the country, with its administrative and economic status as a proxy, impacts the certainty and accuracy of the presented data (Carter et al., Citation2018; Romijn et al., Citation2015). This approach aligns with the uncertainty scale presented in another established global assessment from the 2nd half of the twentieth century (Persson, Citation1974), and is consistent with the tier approach of recent FAO Forest Resource Assessments (FAO, Citation2020). The uncertainty scale is used at the country-level for accessible forests, distinguishing countries in the boreal, temperate, and tropical climatic zones. These are informed, best-guess categorizations based on conventions followed by similar studies of a global nature (Pan et al., Citation2011; Persson, Citation1974).
For temperate and boreal countries either covered by the FAO assessments or where forest carbon densities are derived from individual country-level studies, an uncertainty of ±25% is considered in the carbon densities of accessible forests. For temperate and boreal countries where continental averages are used as a measure for forest carbon densities, an uncertainty of ±40% is considered in the carbon densities of accessible forests. For tropical countries either covered by the FAO assessments or where forest carbon densities are derived from individual country-level studies, an uncertainty of ±40% is considered in the carbon densities of accessible forests. For tropical countries where continental averages are used as a measure for forest BCS densities, an uncertainty of ±50% is considered in the carbon densities of accessible forests.
Due to a lack of direct observations of carbon densities for all other land categories, we use different permutations of possible carbon densities derived from the literature (Erb et al., Citation2018; Xia et al., Citation2014) in a scenario-based approach as a means of addressing uncertainties (SI Table S6).
In this way, we develop 1728 BCS estimates per subcontinent by systematically combining and aggregating all the modulations performed for each land category. SI Table S6 summarises all the modulations performed in this study.
2.3 Presentation of results
Out of the total of 1728 modulations performed at the subcontinental scale by combining modulations within each land category (SI Table S6), we choose one particular BCS estimate per subcontinent as the ‘best guess’ estimate for detailed analysis based on three criteria: (1) the quality of input data sources, (2) the reasonableness of assumptions, and (3) comparisons of empirical evidence to later available estimates for the early twenty-first century. This best-guess estimate is based on carbon densities derived from available forest inventory-based datasets to the extent possible and includes shifting cultivation as a separate land management practice in the tropics, which is a key determinant of tropical carbon fluxes (Hurtt et al., Citation2011; ). In addition, we use the median and inner quantiles to describe the spread of all 1728 modulations per subcontinent.
2.4 Sensitivity analysis
We pair the description of this best-guess case with a sensitivity analysis, quantifying the range of results from all modulations. We identify which of the land categories contribute most to the observed range of values, both at the global level and at the subcontinental level. To do this, we start from the best-guess estimate (see, Section 2.3) and pair-wise change carbon densities in only a single land category to calculate the impacts of these differences on the aggregate (SI Table S6). Sensitivity of each chosen pair of values for each land category, both at the global level and at the subcontinental level, is calculated as the difference of the resulting estimate of total and land category-specific BCS from the corresponding best-guess estimate.
2.5 Comparison with recent estimates
As a final step, we compare the estimates developed in this study with recently developed global BCS estimates from the literature for the twenty-first century. We use three recent studies to consistently compare BCS estimates at the subcontinental level for the years 2000, 2010 and 2019 (Erb et al., Citation2018; Spawn et al., Citation2020; Xu et al., Citation2021). We use two best-guess BCS estimates from the Erb et al. dataset which describe BCS for the year 2000 (Erb et al., Citation2018): one based on the FAO Forest Resource Assessment (FAO, Citation2001) and the other based on a study on global forest carbon fluxes (Pan et al., Citation2011). The Spawn et al. dataset is based on the harmonization of vegetation-specific remote sensing analysis for the year 2000 (Spawn et al., Citation2020). The Xu et al. dataset is also based on high-resolution satellite imagery analysis through 2000–2019 (Xu et al., Citation2021); we use their estimates for the years 2000, 2010 and 2019.
3. Results
3.1 Total carbon stocks in the mid-twentieth century
In 1950, global vegetation stored 450.2 PgC, according to our best-guess estimate (), while the median of all modulations performed was 517.8 PgC, with inner quartiles of 443.7–584.0 PgC.
Table 3. Biomass carbon stocks in the mid-twentieth century.
Tropical subcontinents across Africa, America and Asia contributed 299.5 PgC, or two-thirds, to total global BCS (). South America and Western Africa were the two regions with highest BCS, with 124.81 PgC (27.7% of the total) and 74.57 PgC (16.6% of the total) respectively. Outside of the tropics, Soviet Union and North America made the biggest contributions. These two regions contributed around one-tenth of the total BCS each, with 57.38 PgC and 47.12 PgC respectively.
Figure 3. Global and subcontinental biomass carbon stocks. The best-guess estimate (blue dots) includes the presence of shifting cultivation in the tropics. The bars represent the median and the whiskers represent the inner quantiles of all modulations. The pie chart in the inset represents the contribution of each subcontinent to the best-guess estimate. Numbers on the pie chart are only denoted for those subcontinents where the contribution to total carbon stocks > 10%. Here, CAmC = Central America & the Caribbean; EAf = Eastern Africa; EAs = Eastern Asia, EEu = Eastern Europe; NAWA = Northern Africa & Western Asia, NAm = Northern America, Oc = Oceania; SEAs = SouthEastern Asia; SAf = Southern Africa, SAm = Southern America; SAs = Southern Asia; SU = Soviet Union; WAf = Western Africa; WEu = Western Europe.
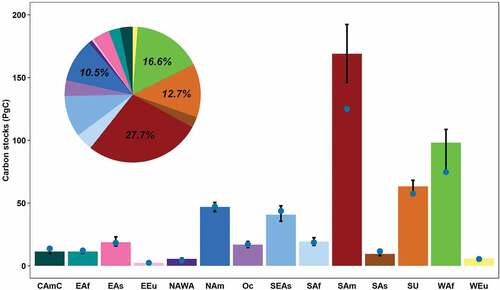
We find significant differences between the best-guess estimate and the median of all modulations across subcontinents. In 8 of the 14 subcontinents, the best-guess estimate is lower than the median, including in the 3 subcontinents with highest BCS (Southern America, Western Africa and the Soviet Union). This indicates the uncertainties that exist in BCS reconstructions and the relatively conservative nature of the best-guess estimate.
3.2 Contribution of land categories to total carbon stocks
Forests were the dominant land category for biomass carbon stocks. In the best-guess estimate, forests contributed more than 75% (340.1 PgC) on only a third of the global terrestrial land mass (), the median of all modulations being 72.6%, or 376.46 PgC (inner quantiles 318.2–441.8 PgC) of the total BCS.
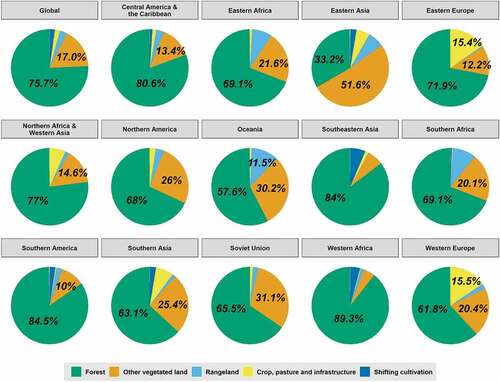
Figure 4. The contribution of each land category to total biomass carbon stocks in each subcontinent for the best-guess estimate. Numbers on the pie chart are only denoted for those land categories where the contribution to total carbon stocks > 10%.
Forests in tropical regions across America, Africa and Asia contained 247.2 PgC, or 72.6%, of the global forest BCS. These forests, which represented 55.2% of the global forest areas and 17.5% of the terrestrial land mass, stored 54.9% of the total BCS. Forest BCS were also high in Soviet Union and North America, storing 37.4 PgC and 31.9 PgC respectively.
Forests stored the highest proportion of total BCS in tropical subcontinents (). Their contribution was highest in Western Africa (89.3%), Southern America (84.5%) and Southeastern Asia (84%). It was the lowest in Eastern Asia, where forests stored a third (33.2%) of the total BCS. In the best-guess estimate, non-forest ecosystems had BCS of 110.15 PgC, while the median of all modulations was 131.03 PgC (inner quartiles 109.21–166.26 PgC). This was dominated by other vegetated lands, where BCS were 76.58 PgC. BCS in other vegetated lands were highest in the Soviet Union (17.75 PgC) followed by Southern America (12.44 PgC) and Northern America (12.19 PgC) respectively. The share of BCS in this category as a proportion of total was highest in Eastern Asia (51.6%), Soviet Union (31.1%) and Oceania (30.2%). In these regions, large areas remain under different kinds of sparse trees, shrubs and productive grasses with diverse land management intensities, which have a fraction of the carbon densities reported in forests in the same country. These ecosystems store large parts of their carbon in soil (Scharlemann et al., Citation2014; Smith et al., Citation2016), whose estimation is outside the scope of our assessment. BCS in croplands were highest in Northern America (1.04 PgC) and Eastern Asia (0.94 PgC), while BCS in pastures was highest in Southern America (0.41 PgC and Western Africa (0.31 PgC).
The contribution of rangelands was highest in Oceania (11.5%), while it remained below 10% for all other subcontinents. The contribution of crop, pastures and infrastructure lands was the highest in Western Europe (15.5%) and Eastern Europe (15.4%). For other subcontinents, the contribution of these land categories remained below 10%. The contribution of shifting cultivation was highest in Southeastern Asia (6.7%) but remained well below 10% at the global level as well as for all other tropical subcontinents.
The distribution of forest BCS differed between accessible and inaccessible forests for each subcontinent (). In Western and Eastern Europe, accessible forests stored more forest BCS than inaccessible forests, while inaccessible and extra forests together stored significantly more forest BCS across the Americas and across Western and Southern Africa. Inaccessible forests and other vegetated lands demonstrated the highest uncertainty and sensitivity to different carbon densities due to a lack of direct measurements for these ecosystems in available inventory or modelling-based assessments (SI Figures S5 and S6). Distinctions between different categories of forests allowed us to explore the potential magnitude of the impacts of forest management on BCS. Since we considered that accessible forests were under active forest management regimes, we observed that forest management has indeed decreased BCS densities in some countries, understood as the difference between potential BCS densities and inventory-derived BCS densities. We compared potential and actual BCS in accessible forests in each country and found that, in the best-guess estimate, forest management decreased BCS by more than a quarter globally, in line with recent global evidence (Erb et al., Citation2018; Noormets et al., Citation2015), albeit with remarkable regional differences.
Figure 5. Distribution of carbon stocks among land categories across all subcontinents and globally (bottom right inset). The blue dots represent the best-guess estimate (see text). Here, AcFor = Accessible Forests, InacFor = Inaccessible Forests, ExtFor = Extra Forests, OVL = Other Vegetated Lands, Ran = Rangeland, CrPInfra = Crop, Pastures and Infrastructure. For information on land categories, see Materials and Methods.
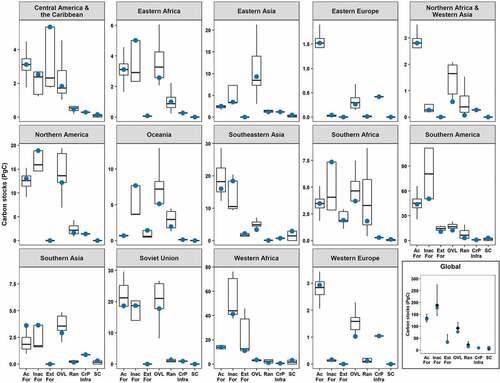
The impacts of management were particularly high in Eastern Asia, Western Europe and Eastern Africa. These regions had management-induced BCS losses in accessible forests of 4.72 PgC, 4.50 PgC and 4.74 PgC, or 65.2%, 60.5 and 60.3% of their potential forest BCS respectively. In comparison, accessible forests in other tropical regions covered only a fraction of the total forest area, reflecting the comparatively lower extent of forest use (SI Figure S3). In Southern America, Western Africa and Northern Africa, management impacts could not be adequately disentangled because growing stock-derived BCS densities were close to, or even exceeded average potential forest BCS densities for some countries in these three subcontinents (SI Table S5). Such cases where forest carbon densities in accessible forests exceeded the average potential forest carbon densities indicated that accessible forests in these countries were preferentially located in carbon-rich forests, in line with ensuring maximum timber flows.
In general, forests had the highest carbon densities among all land categories considered in this study (SI Figure S4). However, differences in the relative distribution of accessible, inaccessible and extra forests led to significant differences in subcontinental carbon densities.
3.3 Relative contributions of areas and carbon densities to total carbon stocks
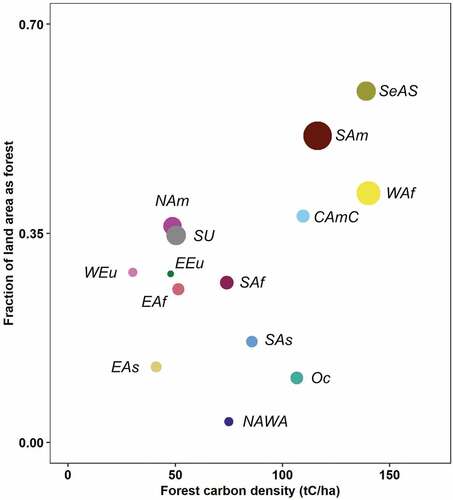
Comparing the extent of forest in each subcontinent with forest BCS densities revealed the relative role of forest areas and forest carbon densities in determining total BCS (). We find that tropical regions had the highest average forest carbon densities and had the largest fractions of land area as forest. In the best-guess estimate, forest carbon densities were highest in Western Africa (140.1 tC/ha) and Southeastern Asia (139.0 tC/ha). Southeastern Asia also had the highest share of forests in the total land area – 58.7% of the land area in this region was under forest cover. Other regions with a high share of forests were Southern America (51.2%) and Western Africa (41.7%). Forest carbon densities were also high in Southern America (116.3 tC/ha) and Central America (109.7 tC/ha). Forest carbon densities were comparatively lower in Eastern Asia (40.9 tC/ha) and the Western Europe (30.0 tC/ha). However, tropical regions did not necessarily contribute the highest to total BCS (SI Figure S7). Despite high forest carbon densities in Southeastern Asia, its contribution to total BCS was lower than the Soviet Union and Northern America, even though these two regions have lower forest carbon densities (50.4 tC/ha and 48.5 tC/ha, respectively). Southern America contributed the highest to global BCS because of large areas under forest cover and high carbon densities.
Figure 6. The contribution of each subcontinent to total carbon stocks as a function of its forest area fraction and average forest carbon density for the best-guess estimate. The size of the circle indicates the forest biomass carbon stocks in that subcontinent. Here, CAmC = Central America & the Caribbean; EAf = Eastern Africa; EAs = Eastern Asia, EEu = Eastern Europe; NAWA = Northern Africa & Western Asia, NAm = Northern America, Oc = Oceania; SEAs = SouthEastern Asia; SAf = Southern Africa, SAm = Southern America; SAs = Southern Asia; SU = Soviet Union; WAf = Western Africa; WEu = Western Europe.
3.4 National contributions to global carbon stocks
We further analysed the contribution of each country to total BCS in each subcontinent in the best-guess estimate (). India and China contributed more than 80% of total BCS in Southern Asia and Eastern Asia respectively. United States and Canada contributed almost equally to BCS in Northern America. Mexico (53.3%) and Brazil (54.1%) contributed the highest in Central America and Southern America respectively. Country contributions were more evenly distributed in Western Europe and Southern Africa, where other countries contributed half and about a third to the total respectively.
Figure 7. (a) Country contributions to total carbon stocks for each subcontinent for the best-guess case. Top 3 countries in each subcontinent are highlighted, and all others are summarised under ‘Other countries’. Percentages in brackets on the y-axis represent the contribution of each subcontinent to total carbon stocks. (b) Top 20 countries with the highest biomass carbon stocks for the best-guess estimate. Percentages on top of each bar represent the contribution of each country to total carbon stocks. For information on current administrative boundaries of larger administrative units in the mid-twentieth century, see SI Table 2.
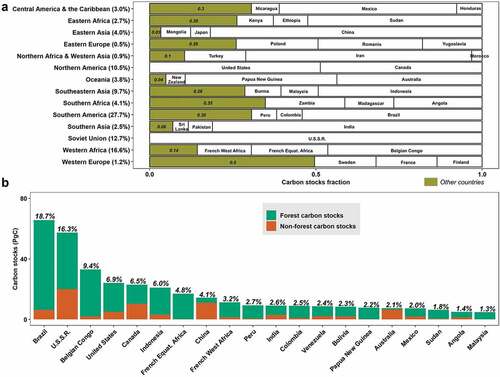
Among countries, we found that Brazil (65.7 PgC, or more than 14% of the total) and the Soviet Union (57.4 PgC, or 12.6% of the total) contained the highest BCS (). Forests in these countries contributed 59.4 and 37.4 PgC, or 90.4% and 65.1% of the country totals. The contribution of other vegetated lands and rangelands in these two countries were 4.76 PgC and 17.76 PgC, and 1.04 PgC and 1.29 PgC respectively. Other countries with a high proportion of total BCS included Belgian Congo, United States, Canada and Indonesia. BCS in croplands were highest in the United States and China (0.86 PgC and 0.84 PgC respectively). BCS in grazing areas, including both pastures and rangelands, was highest in Australia and United States (1.9 PgC and 1.73 PgC respectively).
3.5 Trajectories over the late twentieth century
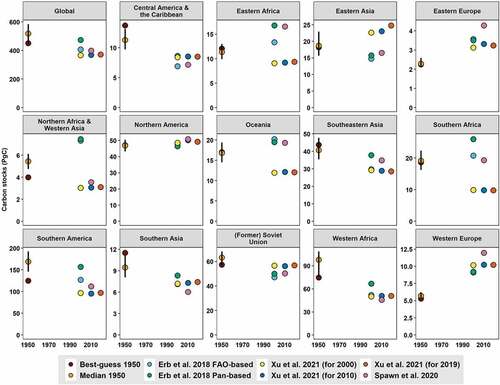
Compared to the best-guess estimate for the year 1950, 2 out of 3 estimates (Erb et al., Citation2018; Xu et al., Citation2021) for the year 2000 suggest a decrease in global BCS over the 2nd half of the twentieth century (), (SI Table S8). The Pan-based estimate from Erb et al. reports a total of 472.6 PgC, 4.9% higher than the best-guess estimate. Both BCS estimates for the year 2010 and 2019 (Spawn et al., Citation2020; Xu et al., Citation2021) report a decrease of 52.4–82.2 PgC (11.6–18.2%) compared to the best-guess estimate. When compared to the median estimate of 518.1 PgC for 1950, all estimates for the year 2000 suggest a decline in global BCS of 45.5–151.6 PgC (8.7–29.2%). Xu et al. report net increases in BCS for the years 2010 and 2019, as compared to 2000.
Figure 8. Change in biomass carbon stocks globally (top left) and at the subcontinent level over 1950–2019. We use carbon stocks estimates for 2000–2019 from (Erb et al., Citation2018; Spawn et al., Citation2020) and (Xu et al., Citation2021) to compare against estimates developed in this study. The whiskers represent the lower and upper quantiles. Note the different scales on the y-axis for each facet. We use the term (Former) Soviet Union to indicate the changed administrative boundaries across the 2nd half of the twentieth century.
Changes in BCS across subcontinents were not uniform (SI Table S8). Some subcontinents witnessed an increase in BCS between 1950 and 2000. Compared to the best-guess estimate, BCS in Western and Eastern Europe grew by 3.81–4.87 PgC (72.1–92.2%) and 0.87–1.32 PgC (38.6%–58.6%) respectively. In both these regions, BCS have stabilised over 2000–2019. BCS in Northern America only showed marginal changes when compared to the year 2000, witnessed an increase till the year 2010 and then marginally declined in 2019. In Eastern Asia, our results are inconclusive, with the difference to Xu et al. dataset indicating an increase, while the difference to both the Erb et al. datasets indicating a decrease in BCS. In the Xu et al. dataset, BCS have continued to increase over 2000–2019. BCS in the Soviet Union witnessed a decline of 1.3–17.8% over the late twentieth century, but have remained stable over 2000–2019.
Some tropical subcontinents witnessed a decline in BCS (SI Table S8). In frontier deforestation regions like Central America, Southeastern Asia, Southern Asia and Western Africa, BCS declined by more than 37%, 13.5%, 27.7% and 10.5%, respectively when the best-guess estimate was compared with corresponding estimates for the year 2000. These four regions have witnessed marginal changes over 2010–2019
In other tropical subcontinents, BCS changes were highly dependent on the dataset used for comparison. In Eastern Africa, where Kenya has undergone a late-twentieth century forest transition (Rudel et al., Citation2020) and parts of Ethiopia also show signs of greening (Belay et al., Citation2015), we find signs of a net increase in BCS by 10.7% when compared to the Erb et al. FAO-based dataset and 39.1% when compared to the Erb et al. Pan-based dataset. In the Xu et al. dataset, BCS is largely stable over 2000–2019 in this subcontinent, but remains below our best-guess estimate for 1950. However, datasets on land areas and carbon densities are least robust and uncertainties in BCS are highest in tropical subcontinents, limiting efforts to completely interpret these changes.
These limitations are demonstrated most starkly in Southern America. In this subcontinent, absolute values of BCS for the year 2000 differs substantially across datasets. A comparison of the best-guess estimate with the Erb et al. FAO-based dataset suggests negligible net BCS changes, while comparisons with the Xu et al. dataset and Erb et al. Pan-based dataset suggest an increase of 28 PgC and a decrease of 32 PgC respectively. These differences are driven by Brazil, Argentina, Peru and Surinam, where a combination of the under-reporting of forest areas in 1950, underestimation of forest carbon densities in inaccessible and extra forests (SI Table S5 for Brazil) as well as the relatively high carbon densities used in the Erb et al. dataset contribute to this observation.
4. Discussion
4.1 Carbon stocks in the mid-twentieth century
Compared to the BCS in potential vegetation of 900–950 PgC (Erb et al., Citation2018; Olson et al., Citation1983) and pre-industrial estimates of 610–620 PgC (Houghton, Citation2003), we report BCS in the range of 443.7–584.0 PgC, with the median of all performed modulations being 517.8 PgC. Additionally, we report a best-guess estimate of 450.2 PgC. We use reported estimates to the extent possible and overcome data limitations regarding the areas under shifting cultivation and ecological potentials of BCS densities in the mid-twentieth century by considering contemporary estimates, justified by conflicting evidence on the magnitude and extent of their changes over the 2nd half of the twentieth century (SI Text 4). Future analyses may account for the impacts of these changes by simulating forest growth trajectories under climate change at high resolutions (Anderson-Teixeira et al., Citation2021; McDowell et al., Citation2020) and reconstructing areas under shifting cultivation at national scales from field-based information (Molinario et al., Citation2015; Read & Lawrence, Citation2003).
Our best-guess estimate is comparable to the median estimate of 450 PgC for the year 2000 reported by (Erb et al., Citation2018), which encompasses the FAO-based estimate of 406.6 PgC and the Pan et al.-based estimate of 472.6 PgC (Erb et al., Citation2018), but uncertainties remain high. Our best-guess estimate is significantly higher than two other contemporary estimates for the years 2000–2019 (Spawn et al., Citation2020; Xu et al., Citation2021; and SI Table S7). Compared to the median estimate for 1950, all estimates for the twenty-first century report a significant decrease in BCS globally. These BCS declines have not only been driven by extensive deforestation in the tropics, for which agricultural expansion remains the biggest driver (DeFries et al., Citation2002; Skole & Tucker, Citation1993; Williams, Citation2006), but also land management in unconverted ecosystems globally (Erb et al., Citation2018). Moreover, we show the substantial impacts of forest management on forest BCS. Such management may take various forms based on local context-specificities, but can include practices like harvesting, tree species selection, thinning and selective cutting (Erb et al., Citation2017).
Our analysis highlights the tension between a probable range of total BCS and a plausible best-guess estimate. While the inner quantiles of the modulations derived from aggregating 1728 cases per subcontinent encompasses a reasonable range of 30% and thus represent plausible cases of total BCS in 1950, it is driven by remarkable variations in BCS of other vegetated lands (), SI Figures S5 and S6) and the cumulative nature of the uncertainty analysis. This highlights the need for more research to understand the carbon state of, and fluxes in, these diverse tree-bearing lands which cover tropical and subtropical dry forests and savannas, where BCS are often underestimated (Pötzschner et al., Citation2022), as well as tundra and taiga in the northern latitudes, which store significant proportions of their biomass in below-ground carbon pools (Campioli et al., Citation2015; Thurner et al., Citation2014), to help narrow the large uncertainty ranges in global carbon budgets over the last six decades (Friedlingstein et al., Citation2019; Le Quéré et al., Citation2013).
On the other hand, the best-guess estimate represents a modulation which is based on BCS densities derived from direct observations to the extent possible. The allocation rationales utilised for the best-guess estimate combine FAO-based estimates for the mid-twentieth century (FAO, Citation2018) with the likely carbon state of ecosystems (Erb et al., Citation2018). Thereby, it provides a robust estimate based on inventory statistics, facilitating the comparison of stock-based estimates over the largest possible timeperiod several decades apart. Our analysis also validates the results from existing hybrid stock-flux based analyses. The comparison of our best-guess estimate (450.2 PgC) with other BCS estimates for the mid-twentieth century reveals notable agreement – (Elhacham et al., Citation2020) link recent global BCS estimates (Erb et al., Citation2018) with information on carbon fluxes derived from DGVM-based averages which account for both land use and environmental changes to report a global BCS of 449 PgC for 1950 (Elhacham et al., Citation2020).
4.2 Carbon fluxes over the 2nd half of the twentieth century
Our estimates of carbon emissions from land change over 1950–2000 are in line with other established estimates of net emissions from book-keeping models as well as vegetation modelling-based approaches (). Currently, annual carbon emissions derived from flux-based approaches amount to 0.9–1.5 PgC/year. These approaches, which include both book-keeping and process-based models, account for several land cover change and land management processes impacting both biomass and soils, including the effects of ecosystem conversion, wood harvest, forest degradation and shifting cultivation (Friedlingstein et al., Citation2020; Le Quéré et al., Citation2013). Process-based approaches additionally account for environmental effects (Friedlingstein et al., Citation2020; Houghton et al., Citation2012).
Table 4. Comparison of annual net carbon fluxes from biomass carbon stock changes over the 2nd half of the twentieth century. Carbon fluxes for this study are developed by comparing the best-guess estimate developed in this study with the global estimates from (Erb et al., Citation2018), (Spawn et al., Citation2020) and (Xu et al., Citation2021). All other described estimates sourced from other studies also report soil carbon fluxes, which remains outside the scope of our study. Estimates for 1920–1999 are taken from a contemporary review of studies describing land change emissions (Houghton et al., Citation2012). In the ‘Processes captured’ column, ‘ALCCLM’ = Anthropogenic land cover and land management changes; SC = shifting cultivation in the tropics; EC = environmental change. Negative net emissions imply a net carbon sink.
Our inventory-based stock-change approach intrinsically also accounts for these land cover change and land management processes. Annualising the difference between our best-guess estimate and the BCS estimates for the year 2000 would result in net emissions of −0.44–1.67 PgC/year globally (negative sign indicates a net sink), albeit with distinct subcontinental trajectories ( and SI Table S9).
In effect, the similar range of net land change emissions indicates that (1) opposing land cover change and land management processes are in a similar order of magnitude and (2) the net effects of environmental change on global carbon fluxes over the 2nd half of the twentieth century were small. This net effect is composed of climate effects (that themselves can lead to vegetation greening or browning (Chen et al., Citation2019)), recovery from previous degradation (Poorter et al., Citation2021) and increased disturbances (Senf & Seidl, Citation2020), which appear to have cancelled out. However, uncertainties remain large. Our analysis does not include soil carbon fluxes, although its influence on land change emissions, although regionally pronounced, has been found to be modest when considered at the global scale (Ito et al., Citation2020; Pongratz et al., Citation2021). Further, the full range of net emissions estimates widens (−0.57 to 4.36 PgC/year) when the median and inner quantiles of all modulations is are included, rendering this interpretation to be treated with caution.
4.3 Identifying an emerging global land transition
Our analysis provides grounds for the extension of land use transition research to account for the evolution of global and subcontinental BCS. While our estimates indicate a decline in BCS over 1950–2000 globally, some subcontinents indeed report an increase in BCS (SI Table S8). This suggests that the trajectory of BCS changes remains a function of geographic setting and previous land use histories of subcontinents.
As forests in the Global North, for example, in France (Le Noë et al., Citation2020), Austria (Gingrich et al., Citation2007) and the United States (Magerl et al., Citation2019), recover due to resource substitution, externalization and state-driven actions after years of net deforestation (Gingrich et al., Citation2019; Mather, Citation2005; Meyfroidt & Lambin, Citation2011; Rudel et al., Citation2020), we find evidence of BCS recoveries in these regions as well. We observe such ‘carbon stock transitions’ for Western and Eastern Europe as well as Northern America. Carbon gains in these subcontinents can only partly counteract observed BCS reductions globally since these subcontinents have significantly lower carbon densities than tropical subcontinents (). Moreover, a comparison of annual carbon fluxes in these subcontinents across three timeperiods indicate an accelerating rate of carbon gains (SI Table S9), suggesting the thickening of forests in the constituent countries driven by environmental change (Gingrich et al., Citation2007; Magerl et al., Citation2019; Le Noë et al., Citation2020). However, further gains may be limited due to limitations of land availability (Kalt et al., Citation2021) and the saturation of environmental effects (Le Noë et al., Citation2021a).
In the tropics, some countries have reported net forest area gains over the late twentieth century, for example, India (Singh et al., Citation2017) and Vietnam (Meyfroidt & Lambin, Citation2008). However, from our results, we do not find definitive evidence of a carbon stock transition at the subcontinental level in the tropics, except for some evidence in the case of Eastern Africa (SI Table S8), although uncertainties remain high. Forest area increases which have led to the forest transition in some tropical countries are not mirrored by BCS gains, owing to the differential impacts of land use on tree cover and BCS changes (Bhan et al., Citation2021). In reality, the overwhelming signal in the tropics remains the net loss of BCS. These subcontinents have high carbon densities () which drive the BCS reductions observed globally. The rate of carbon loss in these subcontinents remains variable across 7 decades (SI Table S9), with some indications of accelerating carbon losses over the last 2 decades also consistent with recent evidence (Feng, Citation2022). In these subcontinents, the overwhelming challenge that exists is to significantly reduce, or even halt, deforestation (Griscom et al., Citation2017; Roe et al., Citation2021) while undertaking realistic restoration interventions (Zeng et al., Citation2020).
To further contextualise these changes, future re-investigations of regional inventories can help demonstrate the relative role of forest area changes and biomass thickening in determining these changes (Gingrich et al., Citation2019; Kauppi et al., Citation2020; Thom et al., Citation2018), while combining BCS assessments with the analysis of socio-metabolic indicators (Gingrich et al., Citation2022) can reveal the divergent pathways of such land transitions across the world.
5. Conclusion
By integrating land use datasets with information on carbon densities from forest inventories, we reconstruct estimates of BCS for the year 1950. We report a best-guess estimate of 450.2 PgC, while the median of all modulations is 517.8 PgC. We find that forests were the primary storehouse of BCS and tropical subcontinents stored the most BCS. Our estimates of annual carbon fluxes over the 2nd half of the twentieth century are largely similar to other modelling-based efforts, and indicate that additional carbon sinks due to environmental change only partly offset land use change impacts on BCS. Comparisons to contemporary estimates of BCS reveal an aggregate global reduction in BCS, albeit with pronounced subcontinental characteristics of change which differentiates between tropical and extra-tropical subcontinents. The carbon stock transition following a forest transition helps contextualise such a geographical distribution of BCS changes.
Supplemental Material
Download PDF (1.3 MB)Disclosure statement
No potential conflict of interest was reported by the author(s).
Supplementary material
Supplemental data for this article can be accessed online at https://doi.org/10.1080/1747423X.2022.2112779
Additional information
Funding
References
- Anderson-Teixeira, K.J., Herrmann, V., Banbury Morgan, R., Bond-Lamberty, B., Cook-Patton, S.C., Ferson, A.E., Muller-Landau, H.C., & Wang, M.M.H. (2021). Carbon cycling in mature and regrowth forests globally. Environmental Research Letters, 16(5), 053009. https://doi.org/10.1088/1748-9326/abed01
- Arora, V.K., & Boer, G.J. (2010). Uncertainties in the 20th century carbon budget associated with Land Use Change. Global Change Biology, 16(12), 3327–3348. https://doi.org/10.1111/j.1365-2486.2010.02202.x
- Belay, K.T., Van Rompaey, A., Poesen, J., Van Bruyssel, S., Deckers, J., & Amare, K. (2015). Spatial analysis of land cover changes in eastern tigray (Ethiopia) from 1965 to 2007: Are there signs of a forest transition? Land Degradation and Development, 26(7), 680–689. https://doi.org/10.1002/ldr.2275
- Bhan, M., Gingrich, S., Matej, S., Fritz, S., & Erb, K.-H. (2021). Land use increases the correlation between tree cover and biomass carbon stocks in the global tropics. Land, 10(11), 1217. https://doi.org/10.3390/land10111217
- Brown, S. (2002). Measuring carbon in forests: Current status and future challenges. Environment and Pollution, 116(3), 363–372. https://doi.org/10.1016/S0269-7491(01)00212-3
- Brown, S., & Lugo, A.E. (1984). Biomass of tropical forests: a new estimate based on forest volumes. Science, 223(4642), 1290–1293. https://doi.org/10.1126/science.223.4642.1290
- Campioli, M., Vicca, S., Luyssaert, S., Bilcke, J., Ceschia, E., Chapin III, F.S., Ciais, P., Fernández-Martínez, M., Malhi, Y., Obersteiner, M., Olefeldt, D., Papale, D., Piao, S.L., Peñuelas, J., Sullivan, P.F., Wang, X., Zenone, T., & Janssens, I.A. (2015). Biomass production efficiency controlled by management in temperate and boreal ecosystems. Nature Geoscience, 8(11), 843–846. https://doi.org/10.1038/ngeo2553
- Caravaggio, N. (2020). A global empirical re-assessment of the environmental kuznets curve for deforestation. Forest Policy and Economics, 119, 102282. https://doi.org/10.1016/j.forpol.2020.102282
- Carter, S., Herold, M., Avitabile, V., de Bruin, S., De Sy, V., Kooistra, L. (2018). Agriculture-driven deforestation in the tropics from 1990–2015: Emissions, trends and uncertainties. Environmental Research Letters, 13(1), 014002. https://doi.org/10.1088/1748-9326/aa9ea4
- Chazdon, R.L., Brancalion, P.H.S., Laestadius, L., Bennett-Curry, A., Buckingham, K., Kumar, C., Moll-Rocek, J., Vieira, I.C.G., & Wilson, S.J. (2016a). When is a forest a forest? Forest concepts and definitions in the era of forest and landscape restoration. Ambio, 45(5), 538–550. https://doi.org/10.1007/s13280-016-0772-y
- Chazdon, R.L., Brancalion, P.H.S., Laestadius, L., Bennett-Curry, A., Buckingham, K., Kumar, C., Moll-Rocek, J., Vieira, I.C.G., & Wilson, S.J. (2016b). When is a forest a forest? Forest concepts and definitions in the era of forest and landscape restoration. Ambio, 45(5), 538–550. https://doi.org/10.1007/s13280-016-0772-y
- Chen, C., Park, T., Wang, X., Piao, S., Xu, B., Chaturvedi, R.K., Fuchs, R., Brovkin, V., Ciais, P., Fensholt, R., Tømmervik, H., Bala, G., Zhu, Z., Nemani, R.R., & Myneni, R.B. (2019). China and India lead in greening of the world through land-use management. Nature Sustainability, 2(2), 122–129. https://doi.org/10.1038/s41893-019-0220-7
- Choi, S.-D., Lee, K., & Chang, Y.-S. (2002). Large rate of uptake of atmospheric carbon dioxide by planted forest biomass in Korea: CO 2 UPTAKE BY PLANTED FOREST BIOMASS IN KOREA. Global Biogeochemical Cycles, 16(4), 1–36. https://doi.org/10.1029/2002GB001914
- Dargie, G.C., Lewis, S.L., Lawson, I.T., Mitchard, E.T.A., Page, S.E., Bocko, Y.E. (2017). Age, extent and carbon storage of the central Congo Basin peatland complex. Nature, 542(7639), 86–90. https://doi.org/10.1038/nature21048
- DeFries, R.S., Houghton, R.A., Hansen, M.C., Field, C.B., Skole, D., & Townshend, J. (2002). Carbon emissions from tropical deforestation and regrowth based on satellite observations for the 1980s and 1990s. Proceedings of the National Academy of Sciences, 99(22), 14256–14261. https://doi.org/10.1073/pnas.182560099
- Eggleston, H.S., Buendia, L., Miwa, K., Ngara, T., & Tanabe, K. (2006). IPCC guidelines for national greenhouse gas inventories. Institution Global Environmental Strategies Hayama Jpn, 48–56.
- Elhacham, E., Ben-Uri, L., Grozovski, J., Bar-On, Y.M., & Milo, R. (2020). Global human-made mass exceeds all living biomass. Nature, 588(7838), 442–444. https://doi.org/10.1038/s41586-020-3010-5
- Ellis, E.C. (2021). Land use and ecological change: A 12,000-Year history. Annual Review of Environment and Resources, 46(1), 1–33. https://doi.org/10.1146/annurev-environ-012220-010822
- Erb, K.-H., Gaube, V., Krausmann, F., Plutzar, C., Bondeau, A., & Haberl, H. (2007). A comprehensive global 5 min resolution land-use data set for the year 2000 consistent with national census data. Journal of Land Use Science, 2(3), 191–224. https://doi.org/10.1080/17474230701622981
- Erb, K.-H., Kastner, T., Luyssaert, S., Houghton, R.A., Kuemmerle, T., Olofsson, P. (2013). Bias in the attribution of forest carbon sinks. Nature Climate Change, 3(10), 854–856. https://doi.org/10.1038/nclimate2004
- Erb, K.-H., Kastner, T., Plutzar, C., Bais, A.L.S., Carvalhais, N., Fetzel, T (2018). Unexpectedly large impact of forest management and grazing on global vegetation biomass. Nature, 553(7686), 73–76. https://doi.org/10.1038/nature25138
- Erb, K.-H., Luyssaert, S., Meyfroidt, P., Pongratz, J., Don, A., Kloster, S. (2017). Land management: Data availability and process understanding for global change studies. Global Change Biology, 23(2), 512–533. https://doi.org/10.1111/gcb.13443
- Fang, J., Chen, A., Peng, C., Zhao, S., & Ci, L. (2001). Changes in Forest Biomass Carbon Storage in China Between 1949 and 1998. Science, 292(5525), 2320–2322. https://doi.org/10.1126/science.1058629
- Fang, J., Oikawa, T., Kato, T., Mo, W., & Wang, Z. (2005). Biomass carbon accumulation by Japan’s forests from 1947 to 1995. Global Biogeochemical Cycles, 19(2), n/a–n/a. https://doi.org/10.1029/2004GB002253
- FAO. (1957) . World forest resources. Food and Agriculture Organization of the United Nations.
- FAO. (1960). World forest inventory 1958. Food and Agriculture Organization of the United Nations.
- FAO. (1963). World forest inventory 1963. Food and Agriculture Organization of the United Nations.
- FAO. (2001). Global forest resources assessment 2000. Food and Agriculture Organization of the United Nations.
- FAO. (2018). 1948 - 2018: Seventy years of FAO’s Global Forest Resources Assessment: Historical overview and future prospects. Food and Agriculture Organization of the United Nations.
- FAO. (2020). Global forest resources assessment 2020. FAO. https://doi.org/10.4060/ca9825en.
- Fearnside, P.M. (2000). Global warming and tropical land-use change: Greenhouse gas emissions from biomass burning, decomposition and soils in forest conversion, shifting cultivation and secondary vegetation. Climate Change, 46(1/2), 115–158. https://doi.org/10.1023/A:1005569915357
- Feng, Y. (2022). Doubling of annual forest carbon loss over the tropics during the early twenty-first century. Nature Sustainability, 5, 444–451 . https://doi.org/10.1038/s41893-022-00854-3
- Fetzel, T., Havlik, P., Herrero, M., Kaplan, J.O., Kastner, T., Kroisleitner, C. (2017a). Quantification of uncertainties in global grazing systems assessment. Global Biogeochemical Cycles, 31(7), 1089–1102. https://doi.org/10.1002/2016GB005601
- Fetzel, T., Havlik, P., Herrero, M., Kaplan, J.O., Kastner, T., Kroisleitner, C. (2017b). Quantification of uncertainties in global grazing systems assessment: uncertainties in global grazing data. Global Biogeochemical Cycles, 31(7), 1089–1102. https://doi.org/10.1002/2016GB005601
- Friedlingstein, P., Jones, M.W.O., Andrew, S.M., M, R., Hauck, J., Peters, G.P. (2019). Global carbon budget 2019. Earth System Science Data, 11(4), 1783–1838. https://doi.org/10.5194/essd-11-1783-2019
- Friedlingstein, P., O’Sullivan, M., Jones, M.W., Andrew, R.M., Hauck, J., Olsen, A (2020). Global carbon budget 2020. Earth System Science Data, 12(4), 3269–3340. https://doi.org/10.5194/essd-12-3269-2020
- Garrett, R.D., Cammelli, F., Ferreira, J., Levy, S.A., Valentim, J., & Vieira, I. (2021). Forests and sustainable development in the Brazilian Amazon: History, trends, and future prospects. Annual Review of Environment and Resources, 46(1), 625–652. https://doi.org/10.1146/annurev-environ-012220-010228
- Gasser, T., Crepin, L., Quilcaille, Y., Houghton, R.A., Ciais, P., & Obersteiner, M. (2020). Historical CO2 emissions from land use and land cover change and their uncertainty. Biogeosciences, 17(15), 4075–4101. https://doi.org/10.5194/bg-17-4075-2020
- Gingrich, S., Erb, K.-H., Krausmann, F., Gaube, V., & Haberl, H. (2007). Long-term dynamics of terrestrial carbon stocks in Austria: A comprehensive assessment of the time period from 1830 to 2000. Regional Environmental Change, 7(1), 37–47. https://doi.org/10.1007/s10113-007-0024-6
- Gingrich, S., Lauk, C., Niedertscheider, M., Pichler, M., Schaffartzik, A., Schmid, M., Magerl, A., Le Noë, J., Bhan, M., & Erb, K. (2019). Hidden emissions of forest transitions: A socio-ecological reading of forest change. Current Opinion in Environment Sustainability, 38, 14–21. https://doi.org/10.1016/j.cosust.2019.04.005
- Gingrich, S., Magerl, A., Matej, S., & Le Noë, J. (2022). Forest transitions in the United States, France and Austria: Dynamics of forest change and their socio- metabolic drivers. Journal of Land Use Science 17 , 1–21. https://doi.org/10.1080/1747423X.2021.2018514
- Grainger, A. (2008). Difficulties in tracking the long-term global trend in tropical forest area. Proceedings of the National Academy of Sciences, 105(2), 818–823. https://doi.org/10.1073/pnas.0703015105
- Griscom, B.W., Adams, J., Ellis, P.W., Houghton, R.A., Lomax, G., Miteva, D.A., Schlesinger, W.H., Shoch, D., Siikamäki, J.V., Smith, P., Woodbury, P., Zganjar, C., Blackman, A., Campari, J., Conant, R.T., Delgado, C., Elias, P., Gopalakrishna, T., Hamsik, M.R., … Fargione, J. (2017). Natural climate solutions. Proceedings of the National Academy of Sciences, 114(44), 11645–11650. https://doi.org/10.1073/pnas.1710465114
- Haberl, H., Erb, K.H., Krausmann, F., Gaube, V., Bondeau, A., Plutzar, C., Gingrich, S., Lucht, W., & Fischer-Kowalski, M. (2007). Quantifying and mapping the human appropriation of net primary production in earth’s terrestrial ecosystems. Proceedings of the National Academy of Sciences, 104(31), 12942–12947. https://doi.org/10.1073/pnas.0704243104
- Hansis, E., Davis, S.J., & Pongratz, J. (2015). Relevance of methodological choices for accounting of land use change carbon fluxes. Global Biogeochemical Cycles, 29(8), 1230–1246. https://doi.org/10.1002/2014GB004997
- Heinimann, A., Mertz, O., Frolking, S., Egelund Christensen, A., Hurni, K., Sedano, F. (2017). A global view of shifting cultivation: Recent, current, and future extent. PLOS ONE, 12(9), e0184479. https://doi.org/10.1371/journal.pone.0184479
- Hosonuma, N., Herold, M., De Sy, V., De Fries, R.S., Brockhaus, M., Verchot, L. (2012). An assessment of deforestation and forest degradation drivers in developing countries. Environmental Research Letters, 7(4), 044009. https://doi.org/10.1088/1748-9326/7/4/044009
- Houghton, R.A. (2003). Revised estimates of the annual net flux of carbon to the atmosphere from changes in land use and land management 1850-2000. Tellus B, 55, 378–390. https://doi.org/10.1034/j.1600-0889.2003.01450.x
- Houghton, R.A. (2010). How well do we know the flux of CO2 from land-use change? Tellus B: Chemical and Physical Meteorology, 62(5), 337–351. https://doi.org/10.1111/j.1600-0889.2010.00473.x
- Houghton, R.A., Hobbie, J.E., Melillo, J.M., Moore, B., Peterson, B.J., Shaver, G.R. (1983). Changes in the carbon content of terrestrial biota and soils between 1860 and 1980: A net release of CO2 to the atmosphere. Ecological Monographs, 53(3), 235–262. https://doi.org/10.2307/1942531
- Houghton, R.A., House, J.I., Pongratz, J., van der Werf, G.R., DeFries, R.S., Hansen, M.C. (2012). Carbon emissions from land use and land-cover change. Biogeosciences, 9(12), 5125–5142. https://doi.org/10.5194/bg-9-5125-2012
- Houghton, R.A., & Nassikas, A.A. (2017). Global and regional fluxes of carbon from land use and land cover change 1850-2015: Carbon emissions from land use. Global Biogeochemical Cycles, 31(3), 456–472. https://doi.org/10.1002/2016GB005546
- Hurtt, G.C., Chini, L.P., Frolking, S., Betts, R.A., Feddema, J., Fischer, G. (2011). Harmonization of land-use scenarios for the period 1500–2100: 600 years of global gridded annual land-use transitions, wood harvest, and resulting secondary lands. Climate Change, 109(1–2), 117–161. https://doi.org/10.1007/s10584-011-0153-2
- Hurtt, G.C., Chini, L., Sahajpal, R., Frolking, S., Bodirsky, B.L., Calvin, K. (2020). Harmonization of global land-use change and management for the period 850–2100 (LUH2) for CMIP6. Climate and Earth System Modeling 13(11) , https://doi.org/10.5194/gmd-2019-360
- Ito, A., Hajima, T., Lawrence, D.M., Brovkin, V., Delire, C., Guenet, B. (2020). Soil carbon sequestration simulated in CMIP6-LUMIP models: Implications for climatic mitigation. Environmental Research Letters, 15(12), 124061. https://doi.org/10.1088/1748-9326/abc912
- Kalt, G., Mayer, A., Haberl, H., Kaufmann, L., Lauk, C., Matej, S. (2021). Exploring the option space for land system futures at regional to global scales: The diagnostic agro-food, land use and greenhouse gas emission model BioBaM-GHG 2.0. Ecological Modelling, 459, 109729. https://doi.org/10.1016/j.ecolmodel.2021.109729
- Kastner, T., Chaudhary, A., Gingrich, S., Marques, A., Persson, U.M., Bidoglio, G. (2021b). Global agricultural trade and land system sustainability: Implications for ecosystem carbon storage, biodiversity, and human nutrition. One Earth, 4(10), 1425–1443. https://doi.org/10.1016/j.oneear.2021.09.006
- Kastner, T., Matej, S., Forrest, M., Gingrich, S., Haberl, H., Hickler, T. (2021b). Land use intensification increasingly drives the spatiotemporal patterns of the global human appropriation of net primary production in the last century. Global Change Biology, 28(1). https://doi.org/10.1111/gcb.15932.
- Kauppi, P.E., Ausubel, J.H., Fang, J., Mather, A.S., Sedjo, R.A., & Waggoner, P.E. (2006). Returning forests analyzed with the forest identity. Proceedings of the National Academy of Sciences, 103(46), 17574–17579. https://doi.org/10.1073/pnas.0608343103
- Kauppi, P.E., Ciais, P., Högberg, P., Nordin, A., Lappi, J., Lundmark, T. (2020). Carbon benefits from Forest Transitions promoting biomass expansions and thickening. Global Change Biology, 26(1). https://doi.org/10.1111/gcb.15292.
- Klein Goldewijk, K., Beusen, A., Doelman, J., & Stehfest, E. (2017). Anthropogenic land use estimates for the Holocene – HYDE 3.2. Earth System Science Data, 9(2), 927–953. https://doi.org/10.5194/essd-9-927-2017
- Krausmann, F., Erb, K.-H., Gingrich, S., Haberl, H., Bondeau, A., Gaube, V. (2013). Global human appropriation of net primary production doubled in the 20th century. Proceedings of the National Academy of Sciences, 110(25), 10324–10329. https://doi.org/10.1073/pnas.1211349110
- Krausmann, F., & Langthaler, E. (2019). Food regimes and their trade links: A socio-ecological perspective. Ecological Economics, 160, 87–95. https://doi.org/10.1016/j.ecolecon.2019.02.011
- Lanly, J.-P. (1982). Tropical forest resources. Food and Agriculture Organization of the United Nations.
- Le Noë, J., Erb, K.-H., Matej, S., Magerl, A., Bhan, M., & Gingrich, S. (2021a). Altered growth conditions more than reforestation counteracted forest biomass carbon emissions 1990–2020. Nature Communications, 12(1), 6075. https://doi.org/10.1038/s41467-021–26398-2
- Le Noë, J., Erb, K.-H., Matej, S., Magerl, A., Bhan, M., & Gingrich, S. (2021b). Socio-ecological drivers of long-term ecosystem carbon stock trend: An assessment with the LUCCA model of the French case. Anthropocene, 33, 100275. https://doi.org/10.1016/j.ancene.2020.100275
- Le Noë, J., Matej, S., Magerl, A., Bhan, M., Erb, K., & Gingrich, S. (2020). Modeling and empirical validation of long‐term carbon sequestration in forests (France, 1850–2015). Global Change Biology, 26(4), 2421–2434. https://doi.org/10.1111/gcb.15004
- Le Quéré, C., Andres, R.J., Boden, T., Conway, T.J., Houghton, R.A., House, J.I. (2013). The global carbon budget 1959–2011. Earth System Science Data, 5(1), 165–185. https://doi.org/10.5194/essd-5-165-2013
- Li, W., Ciais, P., Peng, S., Yue, C., Wang, Y., Thurner, M. (2017). Land-use and land-cover change carbon emissions between 1901 and 2012 constrained by biomass observations. Biogeosciences, 14(22), 5053–5067. https://doi.org/10.5194/bg-14-5053-2017
- Liski, J., Lehtonen, A., Palosuo, T., Peltoniemi, M., Eggers, T., Muukkonen, P. (2006). Carbon accumulation in Finland’s forests 1922–2004 – An estimate obtained by combination of forest inventory data with modelling of biomass, litter and soil. Annals of Forest Science, 63(7), 687–697. https://doi.org/10.1051/forest:2006049
- Magerl, A., Le Noë, J., Erb, K.-H., Bhan, M., & Gingrich, S. (2019). A comprehensive data-based assessment of forest ecosystem carbon stocks in the US 1907–2012. Environmental Research Letters, 14(12), 125015. https://doi.org/10.1088/1748-9326/ab5cb6
- Mather, A.S. (2005). Assessing the world’s forests. Global Environmental Change, 15(3), 267–280. https://doi.org/10.1016/j.gloenvcha.2005.04.001
- McDowell, N.G., Allen, C.D., Anderson-Teixeira, K., Aukema, B.H., Bond-Lamberty, B., Chini, L. (2020). Pervasive shifts in forest dynamics in a changing world. Science, 368(6494), eaaz9463. https://doi.org/10.1126/science.aaz9463
- Mertz, O., Bruun, T.B., Jepsen, M.R., Ryan, C.M., Zaehringer, J.G., Hinrup, J.S. (2021). Ecosystem service provision by secondary forests in shifting cultivation areas remains poorly understood. Human & Ecological, 49(3), 271–283. https://doi.org/10.1007/s10745-021-00236-x
- Meyfroidt, P., & Lambin, E.F. (2008). The causes of the reforestation in Vietnam. Land Use Policy, 25(2), 182–197. https://doi.org/10.1016/j.landusepol.2007.06.001
- Meyfroidt, P., & Lambin, E.F. (2011). Global forest transition: Prospects for an end to deforestation. Annual Review of Environment and Resources, 36(1), 343–371. https://doi.org/10.1146/annurev-environ-090710-143732
- Molinario, G., Hansen, M.C., & Potapov, P.V. (2015). Forest cover dynamics of shifting cultivation in the democratic republic of congo: A remote sensing-based assessment for 2000–2010. Environmental Research Letters, 10(9), 094009. https://doi.org/10.1088/1748-9326/10/9/094009
- Noormets, A., Epron, D., Domec, J.C., McNulty, S.G., Fox, T., Sun, G. (2015). Effects of forest management on productivity and carbon sequestration: A review and hypothesis. Forest Ecology and Management, 355, 124–140. https://doi.org/10.1016/j.foreco.2015.05.019
- Olson, J.S., Watts, J.A., & Allison, L.J. (1983). Carbon in live vegetation of major world ecosystems. Oak Ridge National Laboratory https://cdiac.ess-dive.lbl.gov/epubs/ndp/ndp017/ndp017_1985.html
- Pan, Y., Birdsey, R.A., Fang, J., Houghton, R., Kauppi, P.E., Kurz, W.A. (2011). A large and persistent carbon sink in the world’s forests. Science, 333(6045), 988–993. https://doi.org/10.1126/science.1201609
- Pan, Y., Birdsey, R.A., Phillips, O.L., & Jackson, R.B. (2013). The structure, distribution, and biomass of the world’s forests. Annual Review of Ecology, Evolution, and Systematics, 44(1), 593–622. https://doi.org/10.1146/annurev-ecolsys-110512-135914
- Persson, R. (1974). World forest resources: Review of the world’s forest resources in the early 1970s. Royal College of Forestry.
- Piao, S., Ciais, P., Friedlingstein, P., de Noblet-Ducoudré, N., Cadule, P., Viovy, N., & Wang, T. (2009). Spatiotemporal patterns of terrestrial carbon cycle during the 20th century. Global Biogeochemical Cycles, 23(4). https://doi.org/10.1029/2008gb003339
- Pongratz, J., Dolman, H., Don, A., Erb, K.-H., Fuchs, R., Herold, M. (2018). Models meet data: Challenges and opportunities in implementing land management in Earth system models. Global Change Biology, 24(4), 1470–1487. https://doi.org/10.1111/gcb.13988
- Pongratz, J., Reick, C.H., Raddatz, T., Claussen, M., Molinario, G., Hansen, M.C., & Potapov, P.V. (2009). Effects of anthropogenic land cover change on the carbon cycle of the last millennium. Global Biogeochemical Cycles, 23(4), n/a–n/a. https://doi.org/10.1029/2009GB003488
- Pongratz, J., Schwingshackl, C., Bultan, S., Obermeier, W., Havermann, F., & Guo, S. (2021). Land use effects on climate: current state, recent progress, and emerging topics. Current Climate Change Reports, 7(4), 99–120. https://doi.org/10.1007/s40641-021-00178-y
- Poorter, L., Dylan, C., C, J.C., T, V.D.S.M., Lucy, A., Frans, B. (2021). Multidimensional tropical forest recovery. Science, 374(6573), 1370–1376. https://doi.org/10.1126/science.abh3629
- Pötzschner, F., Baumann, M., Gasparri, N.I., Conti, G., Loto, D., Piquer-Rodríguez, M. (2022). Ecoregion-wide, multi-sensor biomass mapping highlights a major underestimation of dry forests carbon stocks. Remote Sensing of Environment, 269, 112849. https://doi.org/10.1016/j.rse.2021.112849
- Poulter, B., Frank, D.C., Hodson, E.L., & Zimmermann, N.E. (2011). Impacts of land cover and climate data selection on understanding terrestrial carbon dynamics and the CO2 airborne fraction. Biogeosciences, 8, 2027–2036. https://doi.org/10.5194/bg-8-2027-2011
- Ramankutty, N., & Foley, J.A. (1999). Estimating historical changes in global land cover: Croplands from 1700 to 1992. Global Biogeochemical Cycles, 13(4), 997–1027. https://doi.org/10.1029/1999GB900046
- Read, L., & Lawrence, D. (2003). Recovery Of Biomass Following Shifting Cultivation In Dry Tropical Forests Of The Yucatan. Ecological Applications, 13(1), 85–97.
- Richards, J.F., & Flint, E.P. (1994). Historic land use and carbon estimates for South and Southeast Asia: 1880-1980 (CDIAC). https://doi.org/10.3334/CDIAC/lue.ndp046
- Roe, S., Streck, C., Beach, R., Busch, J., Chapman, M., Daioglou, V. (2021). Land‐based measures to mitigate climate change: Potential and feasibility by country. Global Change Biology, 27(23). https://doi.org/10.1111/gcb.15873.
- Romijn, E., Lantican, C.B., Herold, M., Lindquist, E., Ochieng, R., Wijaya, A. (2015). Assessing change in national forest monitoring capacities of 99 tropical countries. Forest Ecology and Management, 352, 109–123. https://doi.org/10.1016/j.foreco.2015.06.003
- Rudel, T.K., Meyfroidt, P., Chazdon, R., Bongers, F., Sloan, S., Grau, H.R. (2020). Whither the forest transition? Climate change, policy responses, and redistributed forests in the twenty-first century. Ambio, 49(1), 74–84. https://doi.org/10.1007/s13280-018-01143-0
- Scharlemann, J.P., Tanner, E.V., Hiederer, R., & Kapos, V. (2014). Global soil carbon: Understanding and managing the largest terrestrial carbon pool. Carbon Management, 5(1), 81–91. https://doi.org/10.4155/cmt.13.77
- Senf, C., & Seidl, R. (2020). Mapping the forest disturbance regimes of Europe. Nature Sustainability 4 . https://doi.org/10.1038/s41893-020-00609-y
- Shevliakova, E., Pacala, S.W., Malyshev, S., Hurtt, G.C., Milly, P.C., Caspersen, J.P., Sentman, L.T., Fisk, J.P., Wirth, C., & Crevoisier, C. (2009). Carbon cycling under 300 years of land use change: Importance of the secondary vegetation sink. Global Biogeochemical Cycles, 23(2). https://doi.org/10.1029/2007gb003176
- Silva, J.M.N., Carreiras, J.M.B., Rosa, I., & Pereira, J.M.C. (2011). Greenhouse gas emissions from shifting cultivation in the tropics, including uncertainty and sensitivity analysis. Journal of Geophysical Research, 116(D20), D20304. https://doi.org/10.1029/2011JD016056
- Singh, M.P., Bhojvaid, P.P., de Jong, W., Ashraf, J., & Reddy, S.R. (2017). Forest transition and socio-economic development in India and their implications for forest transition theory. Forest Policy and Economics, 76, 65–71. https://doi.org/10.1016/j.forpol.2015.10.013
- Skole, D., & Tucker, C. (1993). Tropical deforestation and habitat fragmentation in the Amazon: Satellite data from 1978 to 1988. Science, 260(5116), 1905–1910. https://doi.org/10.1126/science.260.5116.1905
- Smith, P., House, J.I., Bustamante, M., Sobocká, J., Harper, R., Pan, G. (2016). Global change pressures on soils from land use and management. Global Change Biology, 22(3), 1008–1028. https://doi.org/10.1111/gcb.13068
- Spawn, S.A., Sullivan, C.C., Lark, T.J., & Gibbs, H.K. (2020). Harmonized global maps of above and belowground biomass carbon density in the year 2010. Science Data, 7(1), 112. https://doi.org/10.1038/s41597-020-0444-4
- Stocker, B.D., Strassmann, K., & Joos, F. (2011). Sensitivity of holocene atmospheric CO2 and the modern carbon budget to early human land use: Analyses with a process-based model. Biogeosciences, 8(1), 69–88. https://doi.org/10.5194/bg-8-69-2011
- Strassmann, K.M., Joos, F., & Fischer, G. (2008). Simulating effects of land use changes on carbon fluxes: Past contributions to atmospheric CO2 increases and future commitments due to losses of terrestrial sink capacity. Tellus B: Chemical and Physical Meteorology, 60(4), 583–603. https://doi.org/10.1111/j.1600-0889.2008.00340.x
- Thom, D., Rammer, W., Garstenauer, R., & Seidl, R. (2018). Legacies of past land use have a stronger effect on forest carbon exchange than future climate change in a temperate forest landscape. Biogeosciences, 15(18), 5699–5713. https://doi.org/10.5194/bg-15-5699-2018
- Thurner, M., Beer, C., Santoro, M., Carvalhais, N., Wutzler, T., Schepaschenko, D. (2014). Carbon stock and density of northern boreal and temperate forests. Global Ecology and Biogeography, 23(3), 297–310. https://doi.org/10.1111/geb.12125
- Van Minnen, J.G., Klein Goldewijk, K., Stehfest, E., Eickhout, B., van Drecht, G., & Leemans, R. (2009). The importance of three centuries of land-use change for the global and Regional Terrestrial Carbon Cycle. Climatic Change, 97(1–2), 123–144. https://doi.org/10.1007/s10584-009-9596-0
- Vuichard, N., Messina, P., Luyssaert, S., Guenet, B., Zaehle, S., Ghattas, J. (2019). Accounting for carbon and nitrogen interactions in the global terrestrial ecosystem model ORCHIDEE (trunk version, rev 4999): Multi-scale evaluation of gross primary production. Geoscientific Model Development, 12(11), 4751–4779. https://doi.org/10.5194/gmd-12-4751-2019
- Warren, M., Hergoualc’h, K., Kauffman, J.B., Murdiyarso, D., & Kolka, R. (2017). An appraisal of Indonesia’s immense peat carbon stock using national peatland maps: Uncertainties and potential losses from conversion. Carbon Balance and Management, 12(1), 12. https://doi.org/10.1186/s13021-017-0080-2
- Williams, M. (2006). Deforesting the Earth: From prehistory to global crisis, an abridgment. University of Chicago Press.
- Xia, J., Liu, S., Liang, S., Chen, Y., Xu, W., & Yuan, W. (2014). Spatio-Temporal patterns and climate variables controlling of biomass carbon stock of global grassland ecosystems from 1982 to 2006. Remote Sensing, 6(3), 1783–1802. https://doi.org/10.3390/rs6031783
- Xu, L., Saatchi, S.S., Yang, Y., Yu, Y., Pongratz, J., Bloom, A.A. (2021). Changes in global terrestrial live biomass over the 21st century. Science Advances, 7(27), eabe9829. https://doi.org/10.1126/sciadv.abe9829
- Yang, H., Ciais, P., Santoro, M., Huang, Y., Li, W., Wang, Y. (2020). Comparison of forest above‐ground biomass from dynamic global vegetation models with spatially explicit remotely sensed observation‐based estimates. Global Change Biology, 26(7). https://doi.org/10.1111/gcb.15117.
- Zaehle, S., Ciais, P., Friend, A.D., & Prieur, V. (2011). Carbon benefits of anthropogenic reactive nitrogen offset by nitrous oxide emissions. Nature Geoscience, 4(9), 601–605. https://doi.org/10.1038/ngeo1207
- Zeng, Y., Sarira, T.V., Carrasco, L.R., Chong, K.Y., Friess, D.A., Lee, J.S.H. (2020). Economic and social constraints on reforestation for climate mitigation in Southeast Asia. Nature Climate Change, 10(9), 842–844. https://doi.org/10.1038/s41558-020-0856-3