
ABSTRACT
Tropical rainforest ecosystems that function as biodiversity pools had been undermined because of anthropogenic activities. Research has shown that protected areas (PAs) have become the first safeguard for biodiversity. However, how to measure the effectiveness of PAs remains unclear. We present spatiotemporal changes within the PAs and non-PAs in the Leuser Ecosystem, which is one of the significant global landscapes, using intensity analysis during two time periods and propensity score matching to investigate the effectiveness of PAs. We classified land cover using machine learning based on remotely sensed data. Our results revealed the effectiveness of PAs compared with non-PAs. The new conservation intervention after 2008 resulted in the deacceleration of deforestation from 2000–2010 to 2010–2020. In addition, PAs can reduce deforestation two times more effectively than non-PAs. Therefore, PAs and good governance within the Leuser Ecosystem are crucial in maintaining the natural ecosystem to address global conservation targets.
Introduction
As a part of the Tropical Rainforest Heritage of Sumatra (Claudino-Sales, Citation2019), the Leuser Ecosystem significantly contributes to global conservation through its ecosystem services and biodiversity habitats (Le Saout et al., Citation2013). It is considered to be the last natural habitat for certain endangered mammals such as orangutans, elephants, tigers, and rhinoceros (Cochard, Citation2017). The Leuser Ecosystem notably contributes to carbon sequestration (Warren et al., Citation2017), provision of water (Cochard, Citation2017), and provides various products for community livelihoods in the surrounding landscape (Griffin et al., Citation2013). The Leuser Ecosystem falls under two general designations for conservation or economic developments through forest production and road infrastructure (Sloan et al., Citation2019, Citation2018). This landscape also functions as a National Strategic Area to preserve ecosystem services that restrict further road developments. However, a previous study highlighted some redundancies in the legal act related to the landscape, implying a shortfall in the conservation plan and strategies of the Leuser Ecosystem (Sloan et al., Citation2019).
Indonesia is rapidly expanding through infrastructure and accessibility development (Laurance et al., Citation2009; Sloan et al., Citation2018), across its major islands (e.g. Sumatra). This rapid expansion has caused a natural ecosystem disturbance. Recent reports indicate have indicated that anthropogenic activities have significantly changed the land cover (Margono et al., Citation2012). Agricultural incursions and logging activities are reportedly the significant drivers of deforestation and forest degradation in Sumatra (Margono et al., Citation2014, Citation2012), particularly in the Leuser Ecosystem (Gaveau, Wich, et al., Citation2009). Forest degradations are responsible for high carbon emissions that lead to climate change (Page et al., Citation2011). In addition, deforestation results in habitat losses for its threatened biodiversity (Gaveau et al., Citation2009; Kinnaird et al., Citation2003; Linkie et al., Citation2008; Weiskopf et al., Citation2019; Wich et al., Citation2016). Previous studies showed that protected areas could effectively function as habitat refugia and biodiversity hotspots (Condro et al., Citation2021a; Haight & Hammill, Citation2020). Thus, protected areas should be known as part of a comprehensive approach for sustainable management that can overcome the cumulative effects of anthropogenic activities such as biodiversity loss (Condro et al., Citation2021b; Magioli et al., Citation2021). It is essential to understand the role of the protected areas in the conservation process; however, elucidating the performance of protected areas has proved challenging (Geldmann et al., Citation2020).
Land use or land cover change (LULCC) analysis helps to evaluate the trade-offs between land categories to understand the coupled human–environmental mechanism (Lambin & Meyfroidt, Citation2011; Mendoza-Ponce et al., Citation2018). The spatiotemporal dynamics can represent the underlying anthropogenic activities that interact with the natural landscape over time (Song et al., Citation2018). The massive landscape alterations result in loss of biodiversity, climate disturbance, decreased land productivity, and tenurial conflicts in the community, affecting long-term environmental sustainability (Duveiller et al., Citation2020; Yohannes et al., Citation2020; Zhao et al., Citation2018). However, land transformation is investigated using data and techniques, and errors in LULC data can deliver through change analysis. Hence, robust classification methods and land cover change analyses are required to provide an in-depth understanding of the changes in the landscape over time (Xie et al., Citation2020).
In recent years, several studies have assessed the spatiotemporal patterns of land changes (Chughtai et al., Citation2021; Naboureh et al., Citation2021). Most of these studies compared two-time land cover maps through a transition matrix to measure temporal change within a set of categories (Quan et al., Citation2019; Rogan & Chen, Citation2004). Some studies have also used a transition matrix to evaluate land cover changes over time (Hermon, Citation2016; Koh et al., Citation2011). However, studies have also shown the shortfalls of using this matrix in providing the underlying land cover dynamics and revealing gross loss/gain for each category (Huang et al., Citation2018; Pontius, Citation2019). Therefore, intensity analysis was introduced to investigate comprehensive land cover changes.
The intensity analysis is a framework to provide various signals of change through interval, category, and transition levels for land cover change investigation (Aldwaik & Pontius, Citation2012; Varga et al., Citation2019). This framework can better understand land cover change analysis than the transition matrix (Aldwaik & Pontius Jr., Citation2013). Nyamekye et al. (Citation2020) assessed urban growth in Ghana using intensity analysis. Another study applied this framework to examine the land change dynamics in the African-emerging city (Akinyemi et al., Citation2017). Quan et al. (Citation2018) implemented intensity analysis to communicate land cover dynamics in two regions of China during three time points. Xie et al. (Citation2020) enhanced the visualization of the transition pattern in the intensity analysis framework. Other researchers used intensity analysis for evaluating land dynamics among categories (Cribari et al., Citation2021; Ekumah et al., Citation2020; Varga et al., Citation2019).
Measuring the effectiveness of protected areas is critical to determining future conservation strategies (Nelson & Chomitz, Citation2011; Reboredo Segovia et al., Citation2020). The most popular way to evaluate the performance of conservation policies within the protected areas is to estimate the deforestation rate in the landscape through land cover change analysis (Brun et al., Citation2015; Cuenca et al., Citation2016; Gu et al., Citation2020). However, the comparison of avoided deforestation between protected and non-protected areas would likely be flawed because it neglects the lack of randomness in the protected areas (Blackman et al., Citation2015; Graham et al., Citation2021). Recent studies have used statistical matching [e.g. propensity score matching (PSM) analysis] to account for the nonrandom location of protected areas within the landscape (Gaveau et al., Citation2009; Geldmann et al., Citation2020; Gu et al., Citation2020).
In this study, we present a comprehensive intensity analysis of the Leuser Ecosystem, Indonesia, which is one of the most significant landscapes in the world for biodiversity and ecosystem services (Le Saout et al., Citation2013), for two periods of time within two regions (i.e. protected and non-protected areas). We also evaluate the effectiveness of the protected areas within the landscape using PSM.
Methods
Study area
The Leuser Ecosystem is located on North Sumatra Island, Indonesia. It covers 26,495.89 km2 and consists of protected areas (i.e. nature reserve areas, hunting parks, and nature conservation areas) and non-protected areas (i.e. production forests, limited production forests, and convertible forests) based on its forest management units. The size of the non-protected areas (16,810.62 km2) is almost two times larger than that of the protected areas (9,685.28 km2).
Land cover data
In this study, we captured deforestation dynamics and its drivers using six land cover categories defined by the Intergovernmental Panel on Climate Change (IPCC; Hirschmugl et al., Citation2018), based on machine learning classification of Landsat imageries for 2000, 2010, and 2020 (Gorelick et al., Citation2017). For our study, we modified the IPCC’s land cover classes for our study areas into the following categories: Forest, Wetland, Agriculture, Settlement, Shrubs, and Waterbodies. In this context, Settlement consists of built-up areas, roads, and other infrastructure objects that cover non-vegetated areas.
This study performed machine learning classification based on the Random Forest algorithm using cloud computing (Breiman, Citation2001). We used 25 variables derived from Landsat imageries (i.e. reflectance bands and spectral indices; Table S1). We performed visual interpretation to obtain training samples of the land cover classes within the study area (see Supplementary Materials for further details on land cover identification). Furthermore, we stratified the Leuser Ecosystem into protected and non-protected areas to capture the discrepancies in land dynamics within and outside protected areas.
Error analysis
We quantified the confusion matrix in 2000 and 2020 between the raster maps and sample references of land cover in the study area. We then performed intensity analysis to measure the error at the category level in terms of size and intensity (Pontius, Citation2019). In this analysis, the misses correspond to the omission error, false alarms correspond to commission error, and hits correspond to the agreement. We also calculated the component error of land cover maps in 2000 and 2020, i.e. Quantity, Exchange, and Shift (Pontius & Santacruz, Citation2014).
Intensity analysis
This study allocated the change during each period of time into three components: Quantity, Exchange, and Shift (Pontius & Santacruz, Citation2014). The Quantity component measures the absolute net change in the size of the classes. The Exchange component measures the transition of category i to category j in some areas or the reverse transition of category j to category i in other areas within a region during a period of time. The Shift component for category i occurs when both Crtij < Crtji and Crtik > Crtki for at least one combination of categories j and k. All equations used in this section are available in previous studies (Pontius, Citation2019; Quan et al., Citation2019).
Intensity analysis is a mathematical framework toward patterns of change in a hierarchical structure that compares uniform intensities to observed intensities of temporal difference among categories (Aldwaik & Pontius Jr., Citation2013). Intensity analysis includes interval, category, and transition levels. The interval level compares time intervals in terms of gross change. The category level measures the gains and losses of categories during each period of time in each region. The transition level compares the transitions in terms of intensity in each region during each period of time. We used transition pattern matrix introduced by Xie et al. (Citation2020) to communicate the transition level. In addition, we visualized the land cover changes within protected and non-protected areas through the Sankey diagram (Muenchow et al., Citation2019) using ggplot2 package in R.
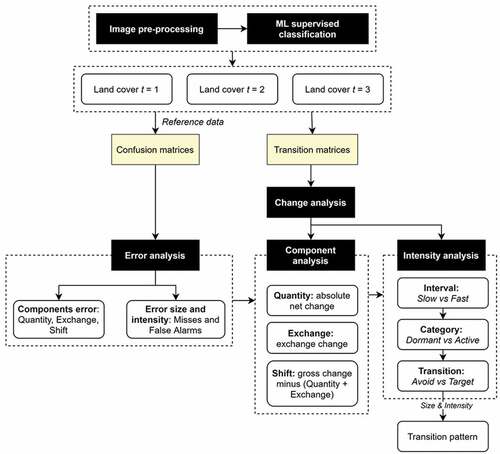
To analyse land change, we adopted the framework containing (1) data pre-processing, (2) land cover identification, (3) error analysis, and (4) change analysis from Quan et al. (Citation2019). shows the conceptual framework for intensity analysis.
Figure 1. Conceptual framework for analyzing land change.
Effectiveness of the protected areas
The effectiveness of protected areas from the anthropogenic disturbances can be calculated by comparing the variables inside and outside protected areas (Geldmann et al., Citation2020). Slope and elevation, distance to forest, distance to roads, and distance to agricultural areas are the critical predictors that best represent human pressures within protected areas in Sumatran rainforests (Gaveau et al., Citation2009). However, statistical matching (Schleicher et al., Citation2020) for comparing protected and non-protected areas (e.g. propensity matching analysis) should be evaluated because the bias toward remote areas were having a high similarity to the non-randomly located protected areas (Joppa & Pfaff, Citation2009).
The optimal full matching method from the MatchIt package in R was used to perform PSM (Ho et al., Citation2011) based on the Random Forest algorithm (Breiman, Citation2001) with 500 number of trees. The binary values were created from protected (n = 2256) and non-protected areas (n = 12,080) for the treatment variables in PSM analysis. We performed exploratory analysis to assess statistical matching quality using love plots of standardized mean differences and distributional balance of distance between before and after matching (Oldekop et al., Citation2019). We also used Moran’s I and spatial distribution of post-matching residuals to investigate spatial autocorrelation and check for hidden bias within the model (Schleicher et al., Citation2017).
In this study, protected area boundaries were considered as dependent variables and were retrieved from the World Database of Protected Areas (WDPA; UNEP-WCMC and IUCN, Citation2020). Moreover, based on the previous studies regarding protected areas’ effectiveness (Gaveau et al., Citation2009; Geldmann et al., Citation2020), we used slope and elevation (Jarvis et al., Citation2006), distance to forest edge, distance to road, forest cover in 2000, climatological temperature from WorldClim v.2.0 (Fick & Hijmans, Citation2017), and human modification index (Kennedy et al., Citation2019) to capture the confounding variables. The present studies excluded buffers of 10-km around the protected area boundaries to deal with the neighborhood leakage effect (Cuenca et al., Citation2016; Gaveau et al., Citation2009).
This study used percentage deforestation as the response variable with two periods (2000–2010 and 2010–2020), following Gaveau et al. (Citation2009). Then, we compared deforestation estimated from matching analysis within the protected and non-protected areas (Cuenca et al., Citation2016). We defined ‘deforestation’ as the alteration of Forest and Wetland categories into the other land cover types (i.e. non-Forest and non-Wetland) with the values ranging from 0% to 100% (Laurance et al., Citation2009).
Results
Land cover data and error analysis
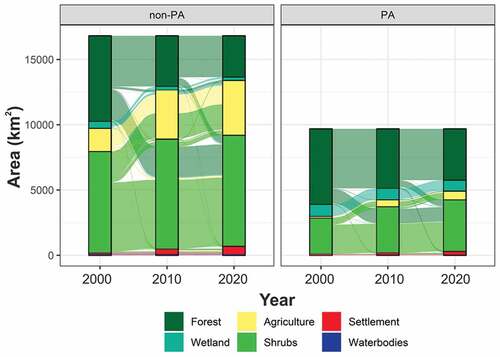
show the maps and areas of the six land categories at the three time-points having the same interval of years (i.e. 2000, 2010, 2020). Within the Leuser Ecosystem, the Forest category dominated the protected areas from 2000 to 2020. Shrubs was found to be the largest category under non-protected areas at all time points (). presents the net changes in land cover for each category. From 2000 to 2020, Forest experienced a net loss of 19% of the protected areas, while Shrubs experienced a net gain of 12% of the protected areas. With respect to non-protected areas, Forest experienced a net loss of 18%, while Agriculture experienced a net gain of 16%.
Figure 2. Maps of the Leuser Ecosystem, Indonesia over three time points within protected and non-protected areas.
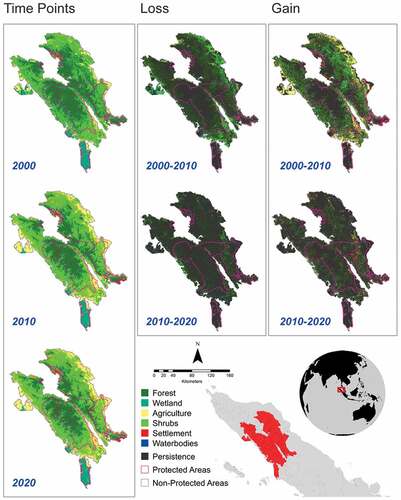
Figure 3. Sankey diagram of each land category in the Leuser Ecosystem within protected and non-protected areas at three-time points.
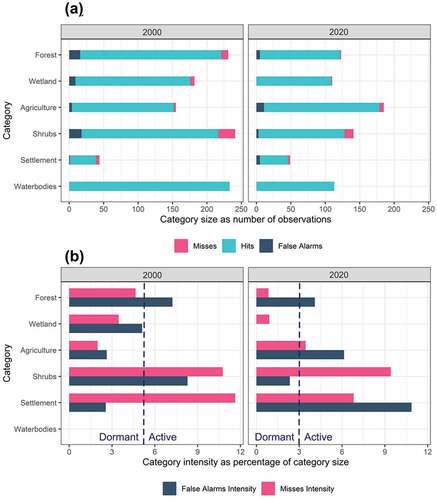
describes the category level errors for (A) size and (B) intensity of the Leuser Ecosystem in 2000 and 2020. In ), the union of hits and misses indicates the number of observations in the reference information for each category. For a particular category, if the false alarms were more extensive than the misses, it indicates that the map overestimated the size of that category. In the case of smaller false alarms than the misses, the map underestimated the size of that category. In 2020, the size of the Forest, Agriculture, and Settlement categories was insignificantly overestimated compared with the size of the rest of the categories, which was insignificantly underestimated. The underestimation of Shrubs resulted in the most significant component of error in 2020. In 2000, the size of the Forest, Wetland, and Agriculture categories was insignificantly overestimated compared with the size of the other categories, which was insignificantly underestimated. In addition, the underestimation of Shrubs and the overestimation of Forest resulted in the most significant error in 2000. In ), the uniform dashed lines represent that the overall error in 2020 and 2000, which was 3% and 5% of the Leuser Ecosystem extent, respectively.
Figure 4. Summary of category level of errors in 2000 and 2020 for (a) size and (b) intensity. The dashed lines indicate the overall error as a percentage of category size.
The maps overestimated the size of the Forest, Wetland, and Agriculture and underestimated the size of the Shrubs and Settlement; this resulted in the quantity error in 2000. Similarly, the quantity error in 2020 occurred because of the overestimation of the size of the Forest, Agriculture, and Settlement categories and the underestimation of the size of the Wetland and Shrubs categories by the map. The exchange occurred due to confusion regarding the pairs of categories. No shift component of error was observed in 2000. The exchange component accounted for most of the errors within all categories, except for the Settlement category in 2000. For the period of 2020, the quantity component accounted for most of the errors within all categories, except for the Agriculture and Settlement categories, which had the most significant intensity of shift component error in 2020 (Figure S1).
Change analysis
The results showed an extensive land cover change in the non-protected areas compared with the land cover change in the protected areas (). As shown in ), the intensity of interval level change produced a consistent pattern because the protected areas and non-protected areas occupy a relatively similar spatial extent. Quantity was found to be the largest component during the two periods, particularly from 2010 to 2020. Our results also showed that the land cover change decelerated across the two-time intervals. The changing intensity with respect to a temporal extent during 2000–2010 was faster than the uniform speed, while the change during 2010–2020 was slow.
Figure 5. Interval level change components (a) and category level losses and gains (b) in terms of intensity at two time periods within protected and non-protected areas of Leuser Ecosystem.
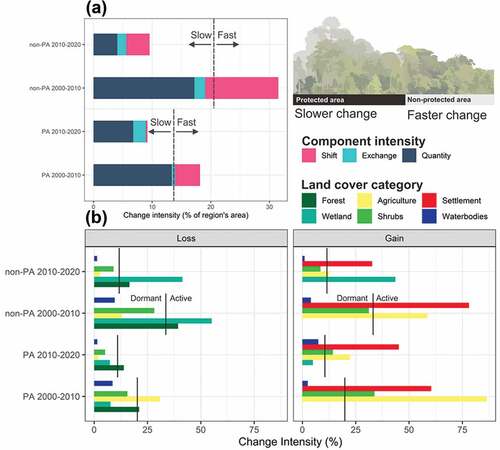
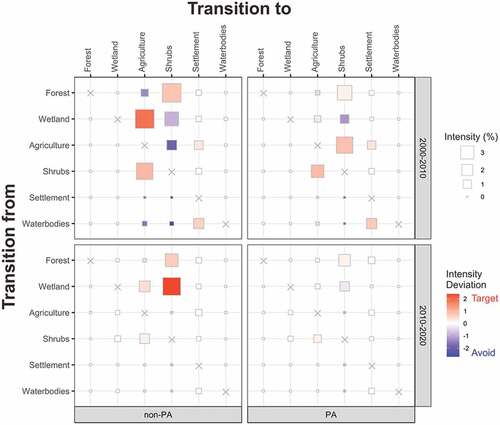
Figure 6. Transition patterns for two time periods. Each square’s size depicts the transition intensity. The gradient of colors indicates the difference between transition and uniform intensities. Red colour means targeting and blue means avoiding.
During each period within the protected areas, Forest exhibited the most significant losses (ranging from 633.90 km2 to 1,218.62 km2), while Shrubs exhibited the most significant gains (ranging from 564.40 km2 to 1,202.00 km2). The Settlement category did not show any losses during all periods. In the non-protected areas, Forest showed the most extensive loss (ranging from 391.95 km2 to 1,534.87 km2), while Shrubs showed the most significant growth from 2010 to 2020 (416.11 km2). In comparison, Agriculture showed the most significant increase from 2000 to 2010 (1,561.68 km2). ) demonstrates the uniform change intensity as a black line for each region during each period. For both protected and non-protected areas during all periods, Forest showed active losses (i.e. more intensive than uniform), while Settlement and Agriculture showed active gains. Moreover, Wetland decreased actively in the non-protected areas during all periods, while Agriculture decreased actively in the protected areas from 2000 to 2010. Meanwhile, Wetland and Shrubs increased in the non-protected areas during 2010–2020 and the protected areas during 2000–2010. Water experienced dormant gains and losses in both areas during all periods.
represents the area and intensity of transition patterns during the two periods. The largest transitions were found in the protected areas from Agriculture to Shrubs during 2000–2010 and Forest to Shrubs during 2010–2020. A relatively large transition was also observed from Forest to Shrubs within the protected areas from 2000 to 2010. With respect to the non-protected areas, the most significant transitions occurred from Wetland to Agriculture during 2000–2010 and Wetland to Shrubs during 2010–2020. In addition, intensive transitions from Forest to Shrubs were observed within the non-protected areas during 2000–2010. In the non-protected areas, a substantial portion of the gain in Shrubs was derived from Forest during 2000–2010 and Wetland during 2010–2020. Besides, the gain in Agriculture targeted Wetland and Shrubs during all periods. The transition from Wetland to Shrubs was relatively large during the first period. In the protected areas, the gain in Shrubs was derived mainly from Forest during all periods and from Agriculture during 2010–2020. The gain in Settlement was derived from Agriculture during the first period in all regions. This study found a more intensive transition during the 2000–2010 period than the 2010–2020 period for both regions (i.e. protected and non-protected areas). Our results also showed more significant transitions in the non-protected areas than in the protected areas during all periods.
Effectiveness of the protected areas on avoided deforestation
Significant differences in means and statistical distributions of each control variable that represents anthropogenic and physical drivers were observed between treatment (protected) and control (non-protected) groups. This is because all the p-values from the t-test from matching groups were found to be highly significant (Table S2). Insignificant p-values toward control variables in the post-matching groups indicated covariate balance after the matching (Table S2). Thus, PSM has adequate balanced measures of anthropogenic disturbance across treatment and confounding variables (see Supplementary Materials for further details of post-matching quality assessment; Figure S2, Figure S3). The discrepancy in deforestation between protected and non-protected areas could be connected to the key predictor after matching.
The mean difference in the percentage deforestation rate between the non-protected vs. protected areas during the 2000–2010 period was highly significant (t = – 6.3701; d.f. = 12,277; p-values < 0.001), and positive (), ). In addition, this result showed consistency of robustness in means comparison when measured using a Wilcoxon test (z = – 5.83; p-value < 0.001). The mean difference in the percentage deforestation rate between the non-protected vs. protected areas during the 2010–2020 period was also significant (t = – 6.5542; d.f. = 12,087; p-values < 0.001), and positive (), ). This result showed the consistency of robustness in means comparison as confirmed using a Wilcoxon test (z = – 9.88; p-value < 0.001). The deforestation rate in the protected areas was significantly lower than that in the non-protected areas. In addition, PSM analysis indicated that protected areas can reduce the impacts of deforestation within the landscape.
Figure 7. Comparison of the deforestation rate during the 2000–2010 period (a) and the 2010–2020 period (b) within protected areas and non-protected areas of the Leuser Ecosystem.
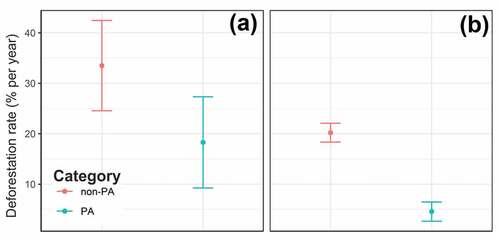
Table 1. Comparison of mean differences in percentage deforestation rates per year and 95% confidence intervals across between non-protected areas (non-PA) and protected areas (PA) during 2000–2010 and 2010–2020 periods in the Leuser Ecosystem.
Discussion
This study used intensity analysis to measure the map errors and assess land cover changes in two different land management areas (i.e. protected and non-protected areas) of the Leuser Ecosystem, Indonesia. The study period covered 20 years, comprising two periods of time: 2000–2010 and 2010–2020. Some researchers believed that maps effectively analyzed land cover change when its accuracy (based on the hits) at each time point was greater than 85% (Quan et al., Citation2015; Xie et al., Citation2020). However, the metric that depicted the percentage of hits did not reveal to bring out the various types of errors (Pontius et al., Citation2011). Thus, some investigators commonly used the confusion or error matrix to summarize the various types of errors. They assumed the remarked alterations to be the correct changes in order to explain their results. Based on the Random Forest algorithm, our results revealed a relatively low percentage of error for 2000 (5%) and 2020 (3%) in the Leuser Ecosystem. Therefore, we believe that data error has no significant influence on land changes for both periods of 2000–2010 and 2010–2020. Previous studies showed that the Random Forest algorithm performs well in identifying land cover based on remotely sensed data (Buchhorn et al., Citation2020; Condro et al., Citation2020; Oliphant et al., Citation2019). Moreover, the present study considered the neighbourhood leakage effect across the buffer zone of protected areas and the bias associated with controlling the non-random location of the designated protected areas using statistical matching analysis. Thus, this study could significantly improve assessments of the performance of the protected area within the Leuser Ecosystem.
The intensity analyses at interval levels showed a more significant land cover change in the non-protected areas than in the protected areas. This phenomenon indicated the high cultivation activities (e.g. oil palm and timber plantations) outside the protected areas within the Leuser Ecosystem (Margono et al., Citation2012). We also observed more intense land cover changes in the first period (2000–2010), which implies the development pressures before the government legally enacted the Leuser Ecosystem as environmental planning priorities based on Law Number 26/2007 and Government Regulation Number 26/2008 (Sloan, Citation2014). Despite their ecological and social importance, Forest and Wetland in the non-protected areas were found to decrease during all periods. This decrease could be linked to anthropogenic activities due to Settlement and Agriculture expansions. The changes in peat-swamp forests (i.e. Wetland) were driven mainly by oil palm conversion. In comparision, the changes in forests were considerably driven by rubber plantations, mixed agroforestry, etc. (Yarrow Robertson & Van Schaik, Citation2001). Moreover, Wetland within the protected areas was more stable with minimal alterations than that within the non-protected areas. However, Forest losses were also occurred in the protected areas within the Leuser Ecosystem. In addition, the Leuser Ecosystem is threatened by the legal or illegal development of infrastructure (e.g. roads and encroachments) in the area (Sloan et al., Citation2018).
Our findings provide information on the magnitude of transitions of the various categories (Varga et al., Citation2019). In the non-protected areas, significant transitions from Wetland to Agriculture, from Forest to Shrubs, and from Shrubs to Agriculture were observed in the first interval. Besides, Agriculture and Wetland categories avoided Shrubs in the first interval within the non-protected areas. In the non-protected areas, the transition from Forest to Shrubs and Wetland to Agriculture decreased in terms of intensity in the second interval. A significant transition was observed from Agriculture to Shrubs in the first interval within the protected areas, whereas more uniform transitions were observed in the second interval within the protected areas. This result revealed that faster change processes in land cover were occurred during the first interval in both areas than in the second interval. A previous study also showed that natural ecosystem loss (i.e. Forest and Wetland) was mainly driven by Agriculture and Shrubs, particularly in non-protected areas due to cultivation and logging activities (Margono et al., Citation2012).
Large-scale industrial logging concessions and land clearance for agricultural expansion were responsible for the transition of Forest to Shrubs (Abood et al., Citation2015; Gaveau et al., Citation2009). In addition, the category level of intensity analysis captured the road-infrastructure development within the Leuser Ecosystem. This phenomenon reflected the proliferation of anthropogenic activities through natural resource accessibility (Poor et al., Citation2019; Prasetyo et al., Citation1995; Sloan et al., Citation2018). Nevertheless, with the help of good conservation governance and practices, protected areas can safeguard biodiversity and reduce deforestation and ecosystem disturbance in the Leuser Ecosystem. Within this ecosystem, Forest and Wetland play an essential role as biodiversity habitats and provide various ecosystem services (Cochard, Citation2017; Olson et al., Citation2001). In agreement, previous works have also shown the resilience of protected areas toward global climate change (Condro et al., Citation2021a; Struebig et al., Citation2015). Therefore, rapid natural ecosystem disturbance can be overcome by increasing the network of protected areas and by protecting the current protected areas from degazettement (Le Saout et al., Citation2013).
A shown in previous studies, the protected areas were generally more effective in avoiding deforestation and human disturbance compared with the unprotected areas (Gaveau et al., Citation2009; Geldmann et al., Citation2020; Schleicher et al., Citation2017). In addition, the present study found that the protected area network suffered two times less deforestation than the non-protected areas during 2000–2020 despite the high levels of anthropogenic activities in the tropical rainforest landscape (Graham et al., Citation2021; ). These results also concur with prior studies that revealed that the protected areas avoided deforestation over earlier periods (Gaveau et al., Citation2009).
Conclusions
This study examines the application of intensity analysis for two different land-use management areas (i.e. protected and non-protected areas) across two periods in the Leuser Ecosystem, Indonesia. This study aimed to evaluate land-use change and interpret the obtained results concerning the conservation policy within the landscape. Besides, we also evaluated the land cover maps through error analysis to avoid inaccuracies of the commonly used metric (e.g. Kappa). We also measured the effectiveness of protected areas within the Leuser Ecosystem using statistical matching analysis to reduce bias toward several effects. Our results show that the new regulation of environmental planning priorities resulted in the deacceleration of land change during the period of 2010–2020 compared with the period of 2000–2010. In addition, we found that the land change was more intensive in the non-protected areas than in the protected areas. Our findings suggest that protected areas within the Leuser Ecosystem play an essential role in reducing deforestation and forest degradation compared with non-protected areas. Forests and Wetlands categories showed decreased activity, while Settlement and Agriculture categories accounted for significant net expansions during all time intervals in both regions. In addition, the gain in Agriculture and Shrubs targeted Forests or Wetlands, indicating that the incursions from cultivation and logging activities were still going on, mainly in the non-protected areas within the forests of the Leuser Ecosystem. It is worth noting that the protected areas are our last hope for reaching optimistic global conservation targets.
Supplemental Material
Download MS Word (781.5 KB)Acknowledgments
The authors would like to express gratitude toward The Laboratory of Environmental Analysis and Geospatial Modelling, Faculty of Forestry and Environment, IPB University, for supporting this research by providing computational devices and Irene Carolina Fatmayanti for her administrative assistance.
Disclosure statement
No potential conflict of interest was reported by the author(s).
Data availability statement
The data that support the findings of this study are available on request from the corresponding author, A.A.C. The data are not publicly available due to their containing information that could compromise the privacy of research participants.
Supplementary material
Supplemental data for this article can be accessed online at https://doi.org/10.1080/1747423X.2022.2115571
Additional information
Funding
References
- Abood, S.A., Lee, J.S.H., Burivalova, Z., Garcia-Ulloa, J., & Koh, L.P. (2015). Relative contributions of the logging, fiber, oil palm, and mining industries to forest loss in Indonesia. Conservation Letters, 8(1), 58–67. https://doi.org/10.1111/conl.12103
- Akinyemi, F.O., Pontius, R.G., & Braimoh, A.K. (2017). Land change dynamics: Insights from intensity analysis applied to an African emerging city. Journal of Spatial Science, 62(1), 69–83. https://doi.org/10.1080/14498596.2016.1196624
- Aldwaik, S.Z., & Pontius, R.G. (2012). Intensity analysis to unify measurements of size and stationarity of land changes by interval, category, and transition. Landscape and Urban Planning, 106(1), 103–114. https://doi.org/10.1016/j.landurbplan.2012.02.010
- Aldwaik, S.Z., & Pontius, R.G,sJr. (2013). Map errors that could account for deviations from a uniform intensity of land change. International Journal of Geographical Information Science, 27(9), 1717–1739. https://doi.org/10.1080/13658816.2013.787618
- Blackman, A., Pfaff, A., & Robalino, J. (2015). Paper park performance: Mexico’s natural protected areas in the 1990s. Global Environmental Change, 31, 50–61. https://doi.org/10.1016/j.gloenvcha.2014.12.004
- Breiman, L. (2001). Random forests. Machine Learning, 45(1), 5–32. https://doi.org/10.1023/A:1010933404324
- Brun, C., Cook, A.R., Lee, J.S.H., Wich, S.A., Koh, L.P., & Carrasco, L.R. (2015). Analysis of deforestation and protected area effectiveness in Indonesia: A comparison of Bayesian spatial models. Global Environmental Change, 31, 285–295. https://doi.org/10.1016/j.gloenvcha.2015.02.004
- Buchhorn, M., Smets, B., Bertels, L., Lesiv, M., Tsendbazar, N.-E., Masiliunas, D., Linlin, L., Herold, M., & Fritz, S. (2020). Copernicus global land service: Land cover 100m: Collection 3: Epoch 2015: Globe (Version V3.0.1). Remote Sensing, 12(1044), 1–14. https://doi.org/10.3390/rs12061044
- Chughtai, A.H., Abbasi, H., & Karas, I.R. (2021, February). A review on change detection method and accuracy assessment for land use land cover. Remote Sensing Applications: Society and Environment, 22, 100482. https://doi.org/10.1016/j.rsase.2021.100482
- Claudino-Sales, V. (2019). Tropical rainforest heritage of Sumatra, Indonesia . In Finkl, C.W. ed. Coastal world heritage sites (pp. 563–569). Springer. https://doi.org/10.1007/978-981-13-2538-0_2611
- Cochard, R. (2017). Scaling the costs of natural ecosystem degradation and biodiversity losses in Aceh Province, Sumatra. In Shivakoti, G.P., Pradhan, U, Helmi, eds. Redefining diversity and dynamics of natural resources management in Asia (Vol. 1 pp. 231–271). Elsevier Inc. https://doi.org/10.1016/B978-0-12-805454-3.00013-X
- Condro, A.A., Prasetyo, L.B., Rushayati, S.B., Santikayasa, I.P., & Iskandar, E. (2021a). Predicting hotspots and prioritizing protected areas for endangered primate species in Indonesia under changing climate. Biology, 10(2), 1–22. https://doi.org/10.3390/biology10020154
- Condro, A.A., Prasetyo, L.B., Rushayati, S.B., Santikayasa, I.P., & Iskandar, E. (2021b). Measuring metrics of climate change and its implication on the endangered mammal conservation in the Leuser Ecosystem. Frontiers in Environmental Science 9 , 713837. https://doi.org/10.3389/fenvs.2021.713837
- Condro, A.A., Setiawan, Y., Prasetyo, L.B., Pramulya, R., & Siahaan, L. (2020). Retrieving the national main commodity maps in Indonesia based on high-resolution remotely sensed data using cloud computing platform. Land, 9(10), 1–15. https://doi.org/10.3390/land9100377
- Cribari, V., Strager, M.P., Maxwell, A.E., & Yuill, C. (2021). Landscape changes in the southern coalfields of West Virginia: Multi-level intensity analysis and surface mining transitions in the headwaters of the coal river from 1976 to 2016. Land, 10(7), 748. https://doi.org/10.3390/land10070748
- Cuenca, P., Arriagada, R., & Echeverría, C. (2016). How much deforestation do protected areas avoid in tropical Andean landscapes? Environmental Science & Policy, 56, 56–66. https://doi.org/10.1016/j.envsci.2015.10.014
- Duveiller, G., Caporaso, L., Abad-Viñas, R., Perugini, L., Grassi, G., Arneth, A., & Cescatti, A. (2020). Local biophysical effects of land use and land cover change: Towards an assessment tool for policy makers. Land Use Policy, 91, 104382. November 2019 https://doi.org/10.1016/j.landusepol.2019.104382
- Ekumah, B., Armah, F.A., Afrifa, E.K.A., Aheto, D.W., Odoi, J.O., & Afitiri, A.R. (2020). Assessing land use and land cover change in coastal urban wetlands of international importance in Ghana using intensity analysis. Wetlands Ecology and Management, 28(2), 271–284. https://doi.org/10.1007/s11273-020-09712-5
- Fick, S.E., & Hijmans, R.J. (2017). WorldClim 2: New 1-km spatial resolution climate surfaces for global land areas. International Journal of Climatology, 37(12), 4302–4315. https://doi.org/10.1002/joc.5086
- Gaveau, D.L.A., Epting, J., Lyne, O., Linkie, M., Kumara, I., Kanninen, M., & Leader-Williams, N. (2009). Evaluating whether protected areas reduce tropical deforestation in Sumatra. Journal of Biogeography, 36(11), 2165–2175. https://doi.org/10.1111/j.1365-2699.2009.02147.x
- Gaveau, D.L.A.A., Wich, S., Epting, J., Juhn, D., Kanninen, M., & Leader-williams, N. (2009). The future of forests and orangutans (Pongo abelii) in Sumatra: Predicting impacts of oil palm plantations, road construction, and mechanisms for reducing carbon emissions from deforestation. Environmental Research Letters, 4(3), 034013. https://doi.org/10.1088/1748-9326/4/3/034013
- Geldmann, J., Manica, A., Burgess, N.D., Coad, L., & Balmford, A. (2020). A global-level assessment of the effectiveness of protected areas at resisting anthropogenic pressures. Proceedings of the National Academy of Sciences of the United States of America, 117(41), 25945. https://doi.org/10.1073/pnas.2018968117
- Gorelick, N., Hancher, M., Dixon, M., Ilyushchenko, S., Thau, D., & Moore, R. (2017). Google Earth engine: Planetary-scale geospatial analysis for everyone. Remote Sensing of Environment, 202, 18–27. https://doi.org/10.1016/j.rse.2017.06.031
- Graham, V., Geldmann, J., Adams, V.M., Negret, P.J., Sinovas, P., & Chang, H.-C. (2021). Southeast Asian protected areas are effective in conserving forest cover and forest carbon stocks compared to unprotected areas. Scientific Reports, 11(1), 23760. https://doi.org/10.1038/s41598-021-03188-w
- Griffin, C., Ellis, D., Beavis, S., & Zoleta-Nantes, D. (2013). Coastal resources, livelihoods and the 2004 Indian Ocean tsunami in Aceh, Indonesia. Ocean & Coastal Management, 71, 176–186. https://doi.org/10.1016/j.ocecoaman.2012.10.017
- Gu, C., Zhao, P., Chen, Q., Li, S., Li, L., Liu, L., & Zhang, Y. (2020). Forest cover change and the effectiveness of protected areas in the Himalaya since 1998. Sustainability (Switzerland), 12(15), 1–24. https://doi.org/10.3390/su12156123
- Haight, J., & Hammill, E. (2020). Protected areas as potential refugia for biodiversity under climatic change. Biological Conservation, 241, 108258. November 2019 https://doi.org/10.1016/j.biocon.2019.108258
- Hermon, D. (2016). Estimate of changes in carbon stocks based on land cover changes in the Leuser Ecosystem Area (LEA) Indonesia. Forum Geografi, 29(2), 188. https://doi.org/10.23917/forgeo.v29i2.1487
- Hirschmugl, M., Sobe, C., Deutscher, J., & Schardt, M. (2018). Combined use of optical and synthetic aperture radar data for REDD+ applications in Malawi. Land, 7(4), 1–17. https://doi.org/10.3390/land7040116
- Ho, D.E., King, G., Stuart, E.A., & Imai, K. (2011). MatchIt : Nonparametric preprocessing for parametric causal inference. Journal Of Statistical Software, 42(8), 1–28. https://doi.org/10.18637/jss.v042.i08
- Huang, F., Huang, B., Huang, J., & Li, S. (2018). Measuring land change in coastal zone around a rapidly urbanized bay. International Journal of Environmental Research and Public Health, 15(6), 1059. https://doi.org/10.3390/ijerph15061059
- Jarvis, A., Reuter, H.I., Nelson, A., & Guevara, E. (2006). Hole-filled SRTM for the globe version 3, from the CGIAR-CSI SRTM 90m database Retrieved 1 1 2021. http://srtm.csi.cgiar.org
- Joppa, L.N., & Pfaff, A. (2009). High and far: Biases in the location of protected areas. PLoS ONE, 4(12), 1–6. https://doi.org/10.1371/journal.pone.0008273
- Kennedy, C.M., Oakleaf, J.R., Theobald, D.M., Baruch-Mordo, S., & Kiesecker, J. (2019). Managing the middle: A shift in conservation priorities based on the global human modification gradient. Global Change Biology, 25(3), 811–826. https://doi.org/10.1111/gcb.14549
- Kinnaird, M.F., Sanderson, E.W., O’Brien, T.G., Wibisono, H.T., & Woolmer, G. (2003). Deforestation trends in a tropical landscape and implications for endangered large mammals. Conservation Biology, 17(1), 245–257. https://doi.org/10.1046/j.1523-1739.2003.02040.x
- Koh, L.P., Miettinen, J., Liew, S.C., & Ghazoul, J. (2011). Remotely sensed evidence of tropical peatland conversion to oil palm. Proceedings of the National Academy of Sciences of the United States of America, 108(12), 5127–5132. https://doi.org/10.1073/pnas.1018776108
- Lambin, E.F., & Meyfroidt, P. (2011). Global land use change, economic globalization, and the looming land scarcity. Proceedings of the National Academy of Sciences of the United States of America, 108(9), 3465–3472. https://doi.org/10.1073/pnas.1100480108
- Laurance, W.F., Goosem, M., & Laurance, S.G.W. (2009). Impacts of roads and linear clearings on tropical forests. Trends in Ecology & Evolution, 24(12), 659–669. https://doi.org/10.1016/j.tree.2009.06.009
- Le Saout, S., Hoffmann, M., Shi, Y., Hughes, A., Bernard, C., Brooks, T.M., Bertzky, B., Butchart, S.H.M., Stuart, S.N., Badman, T., & Rodrigues, A.S.L. (2013). Protected areas and effective biodiversity conservation. Science, 342(6160), 803–805. https://doi.org/10.1126/science.1239268
- Linkie, M., Haidir, I.A., Nugroho, A., & Dinata, Y. (2008). Conserving tigers Panthera Tigris in selectively logged Sumatran forests. Biological Conservation, 141(9), 2410–2415. https://doi.org/10.1016/j.biocon.2008.07.002
- Magioli, M., Magioli, M., Rios, E., Benchimol, M., Cavenague, D., Angelo, L., Narezi, G., Ot, M., Mendes, M., Nobre, R.D.A., Chiarello, A.G., García-olaechea, A., Bellotto, A., Cantagallo, C., Righetto, C., Henrique, D., Del, C., Koike, V., S, C.S., & Zuccolotto, S. (2021). The role of protected and unprotected forest remnants for mammal conservation in a megadiverse Neotropical hotspot. Biological Conservation 259 , 109173. https://doi.org/10.1016/j.biocon.2021.109173
- Margono, B.A., Potapov, P.V., Turubanova, S., Stolle, F., & Hansen, M.C. (2014). Primary forest cover loss in Indonesia over 2000-2012. Nature Climate Change, 4(8), 730–735. https://doi.org/10.1038/nclimate2277
- Margono, B.A., Turubanova, S., Zhuravleva, I., Potapov, P., Tyukavina, A., Baccini, A., Goetz, S., & Hansen, M.C. (2012). Mapping and monitoring deforestation and forest degradation in Sumatra (Indonesia) using Landsat time series data sets from 1990 to 2010. Environmental Research Letters, 7(3), 2000–2010. https://doi.org/10.1088/1748-9326/7/3/034010
- Mendoza-Ponce, A., Corona-Núñez, R., Kraxner, F., Leduc, S., & Patrizio, P. (2018). Identifying effects of land use cover changes and climate change on terrestrial ecosystems and carbon stocks in Mexico. Global Environmental Change, 53, 12–23. December 2017 https://doi.org/10.1016/j.gloenvcha.2018.08.004
- Muenchow, J., Schäfer, S., & Krüger, E. (2019). Reviewing qualitative GIS research—Toward a wider usage of open-source GIS and reproducible research practices. Geography Compass, 13(6), 1–17. https://doi.org/10.1111/gec3.12441
- Naboureh, A., Bian, J., Lei, G., & Li, A. (2021). A review of land use/land cover change mapping in the China-Central Asia-West Asia economic corridor countries. Big Earth Data, 5(2), 237–257. https://doi.org/10.1080/20964471.2020.1842305
- Nelson, A., & Chomitz, K.M. (2011). Effectiveness of strict vs. multiple use protected areas in reducing tropical forest fires: A global analysis using matching methods. PLoS ONE, 6(8), e22722. https://doi.org/10.1371/journal.pone.0022722
- Nyamekye, C., Kwofie, S., Ghansah, B., Agyapong, E., & Boamah, L.A. (2020, April). Assessing urban growth in Ghana using machine learning and intensity analysis: A case study of the New Juaben municipality. Land Use Policy, 99, 105057. https://doi.org/10.1016/j.landusepol.2020.105057
- Oldekop, J.A., Sims, K.R.E., Karna, B.K., Whittingham, M.J., & Agrawal, A. (2019). Reductions in deforestation and poverty from decentralized forest management in Nepal. Nature Sustainability, 2(5), 421–428. https://doi.org/10.1038/s41893-019-0277-3
- Oliphant, A.J., Thenkabail, P.S., Teluguntla, P., Xiong, J., Gumma, M.K., Congalton, R.G., & Yadav, K. (2019). Mapping cropland extent of Southeast and Northeast Asia using multi-year time-series Landsat 30-m data using a random forest classifier on the Google Earth engine cloud. International Journal of Applied Earth Observation and Geoinformation, 81, 110–124. November 2018 https://doi.org/10.1016/j.jag.2018.11.014
- Olson, D.M., Dinerstein, E., Wikramanayake, E.D., Burgess, N.D., Powell, G.V.N., Underwood, E.C., D’Amico, J.A., Itoua, I., Strand, H.E., Morrison, J.C., Loucks, C.J., Allnutt, T.F., Ricketts, T.H., Kura, Y., Lamoreux, J.F., Wettengel, W.W., Hedao, P., & Kassem, K.R. (2001). Terrestrial ecoregions of the world: A new map of life on Earth. BioScience, 51(11), 933–938.
- Page, S.E., Rieley, J.O., & Banks, C.J. (2011). Global and regional importance of the tropical peatland carbon pool. Global Change Biology, 17(2), 798–818. https://doi.org/10.1111/j.1365-2486.2010.02279.x
- Pontius, R.G. (2019). Component intensities to relate difference by category with difference overall. International Journal of Applied Earth Observation and Geoinformation, 77, 94–99. https://doi.org/10.1016/j.jag.2018.07.024
- Pontius, R.G., Millones, M., Pontius, R., Gilmore, J., Millones, M., Pontius, R.G., & Millones, M. (2011). Death to Kappa: Birth of quantity disagreement and allocation disagreement for accuracy assessment. International Journal of Remote Sensing, 32(15), 4407–4429. https://doi.org/10.1080/01431161.2011.552923
- Pontius, R.G., & Santacruz, A. (2014). Quantity, exchange, and shift components of difference in a square contingency table. International Journal of Remote Sensing, 35(21), 7543–7554. https://doi.org/10.1080/2150704X.2014.969814
- Poor, E.E., Jati, V.I.M., Imron, M.A., & Kelly, M.J. (2019). The road to deforestation: Edge effects in an endemic ecosystem in Sumatra, Indonesia. PLoS ONE, 14(7), 1–13. https://doi.org/10.1371/journal.pone.0217540
- Prasetyo, L.B., Kunfaznu, M., & Kumazaki, M. (1995). Land-use changes and their causes in the tropics : A case study in South Sumatra, Indonesia in 1969-1988. Tropics, 5(1991), 115–128. https://doi.org/10.3759/tropics.5.115
- Quan, B., Bai, Y., Römkens, M.J.M., Chang, K.T., song, H., Guo, T., & Lei, S. (2015). Urban land expansion in Quanzhou City, China, 1995-2010. Habitat International, 48, 131–139. https://doi.org/10.1016/j.habitatint.2015.03.021
- Quan, B., Pontius, R.G., & Song, H. (2019). Intensity analysis to communicate land change during three time intervals in two regions of Quanzhou City, China. GIScience and Remote Sensing, 57(1), 21–36. https://doi.org/10.1080/15481603.2019.1658420
- Quan, B., Ren, H., Pontius, R.G., & Liu, P. (2018). Quantifying spatiotemporal patterns concerning land change in Changsha, China. Landscape and Ecological Engineering, 14(2), 257–267. https://doi.org/10.1007/s11355-018-0349-y
- Reboredo Segovia, A.L., Romano, D., & Armsworth, P.R. (2020). Who studies where? Boosting tropical conservation research where it is most needed. Frontiers in Ecology and the Environment, 18(3), 159–166. https://doi.org/10.1002/fee.2146
- Rogan, J., & Chen, D.M. (2004). Remote sensing technology for mapping and monitoring land-cover and land-use change. Progress in Planning, 61(4), 301–325. https://doi.org/10.1016/S0305-9006(03)00066-7
- Schleicher, J., Eklund, J.D., Barnes, M., Geldmann, J., Oldekop, J.A., & Jones, J.P.G. (2020). Statistical matching for conservation science. Conservation Biology, 34(3), 538–549. https://doi.org/10.1111/cobi.13448
- Schleicher, J., Peres, C.A., Amano, T., Llactayo, W., & Leader-Williams, N. (2017). Conservation performance of different conservation governance regimes in the Peruvian Amazon. Scientific Reports, 7(1), 1–10. https://doi.org/10.1038/s41598-017-10736-w
- Sloan, S. (2014). Indonesia’s moratorium on new forest licenses: An update. Land Use Policy, 38, 37–40. https://doi.org/10.0.3.248/j.landusepol.2013.10.018
- Sloan, S., Alamgir, M., Campbell, M.J., Setyawati, T., & Laurance, W.F. (2019). Development corridors and Remnant-forest conservation in Sumatra, Indonesia. Tropical Conservation Science, 12(1), 1–9. https://doi.org/10.1177/1940082919889509
- Sloan, S., Campbell, M.J., Alamgir, M., Collier-Baker, E., Nowak, M.G., Usher, G., & Laurance, W.F. (2018). Infrastructure development and contested forest governance threaten the Leuser Ecosystem, Indonesia. Land Use Policy, 77, 298–309. December 2017 https://doi.org/10.1016/j.landusepol.2018.05.043
- Song, X.P., Hansen, M.C., Stehman, S.V., Potapov, P.V., Tyukavina, A., Vermote, E.F., & Townshend, J.R. (2018). Global land change from 1982 to 2016. Nature, 560(7720), 639–643. https://doi.org/10.1038/s41586-018-0411-9
- Struebig, M.J., Fischer, M., Gaveau, D.L.A., Meijaard, E., Wich, S.A., Gonner, C., Sykes, R., Wilting, A., & Kramer-Schadt, S. (2015). Anticipated climate and land-cover changes reveal refuge areas for Borneo’s orang-utans. Global Change Biology, 21(8), 2891–2904. https://doi.org/10.1111/gcb.12814
- UNEP-WCMC and IUCN. (2020). Protected planet: the world database on protected areas (WDPA). www.protectedplanet.net
- Varga, O.G., Pontius, R.G., Singh, S.K., & Szabó, S. (2019). Intensity Analysis and the Figure of Merit’s components for assessment of a Cellular Automata – Markov simulation model. Ecological Indicators, 101, 933–942. February 2018 https://doi.org/10.1016/j.ecolind.2019.01.057
- Warren, M., Hergoualc’h, K., Kauffman, J.B., Murdiyarso, D., & Kolka, R. (2017). An appraisal of Indonesia’s immense peat carbon stock using national peatland maps: Uncertainties and potential losses from conversion. Carbon Balance and Management, 12(1), 1–12. https://doi.org/10.1186/s13021-017-0080-2
- Weiskopf, S.R., McCarthy, J.L., McCarthy, K.P., Shiklomanov, A.N., Wibisono, H.T., & Pusparini, W. (2019). The conservation value of forest fragments in the increasingly agrarian landscape of Sumatra. Environmental Conservation, May, 46(4), 340–346. https://doi.org/10.1017/S0376892919000195
- Wich, S.A., Singleton, I., Nowak, M.G., Atmoko, S.S.U., Nisam, G., Arif, S.M., Putra, R.H., Ardi, R., Fredriksson, G., Usher, G., Gaveau, D.L.A., & Kühl, H.S. (2016). Land-cover changes predict steep declines for the Sumatran orangutan (Pongo abelii). Science Advances, 2(3), 1–9. https://doi.org/10.1126/sciadv.1500789
- Xie, Z., Pontius Jr, R.G., Huang, J., & Nitivattananon, V. (2020). Enhanced intensity analysis to quantify categorical change and to identify suspicious land transitions: A case study of Nanchang, China. Remote Sensing, 12(20), 1–16. https://doi.org/10.3390/rs12203323
- Yarrow Robertson, J.M., & Van Schaik, C.P. (2001). Causal factors underlying the dramatic decline of the Sumatran orang-utan. Oryx, 35(1), 26–38. https://doi.org/10.1046/j.1365-3008.2001.00149.x
- Yohannes, H., Soromessa, T., Argaw, M., & Dewan, A. (2020). Changes in landscape composition and configuration in the Beressa watershed, Blue Nile basin of Ethiopian Highlands: Historical and future exploration. Heliyon, 6(9), e04859. https://doi.org/10.1016/j.heliyon.2020.e04859
- Zhao, X., Pu, J., Wang, X., Chen, J., Yang, L.E., & Gu, Z. (2018). Land-use spatio-temporal change and its driving factors in an artificial forest area in Southwest China. Sustainability, 10(11), 1–19. https://doi.org/10.3390/su10114066