
 ?Mathematical formulae have been encoded as MathML and are displayed in this HTML version using MathJax in order to improve their display. Uncheck the box to turn MathJax off. This feature requires Javascript. Click on a formula to zoom.
ABSTRACT
Understanding the scale of land use/cover (LULC) map and its impacts on representing LULC is central to address earth observation issues. However, there is an absence of quantitative uncertainty evaluation of upscaled maps to be used over decades. An approach based on the Shannon entropy theory was then proposed to tackle this issue by reporting categorical heterogeneity information contained in upscaled pixels. The Majority Rule-Based aggregation algorithm was performed to generate upscaled maps at different widely used scales using a national LU map. The results reveal that substantial uncertainties inevitably exist in the upscaled maps. Additionally, the analysts demonstrate that the proposed approach can-and-indeed accurately provide spatially uncertain information of upscaled maps. These findings suggest that this approach is necessary for users to most effectively use these maps in earth observation models and should be extensively used in the future work.
Introduction
Observation of land use/land cover (LULC) is essential for understanding and monitoring earth system (Chen et al., Citation2020; C. Zhang et al., Citation2019). The LULC distribution and area provide fundamental information for various applications (Doelman et al., Citation2018; Le Provost et al., Citation2020; Tesfaw et al., Citation2018). These applications do not only require LULC at high resolutions but also coarser spatial resolutions (Matasov et al., Citation2019; Sohl et al., Citation2016; Verburg et al., Citation2011). Given multiple objectives, the upscaled maps at a lower spatial resolution have been as crucial input data for many research studies (Cole et al., Citation2018; Grafius et al., Citation2016; D. He et al., Citation2021; Y. He et al., Citation2022; Li & Zhou, Citation2018; Van Vliet et al., Citation2019; Zen et al., Citation2019; J. Zhang et al., Citation2022). Note that the scale refers to the spatial resolution of the LULC map in the literature (Moody & Woodcock, Citation1994, Citation1995; Sun & Congalton, Citation2018, Citation2021; Tan et al., Citation2015). The upscaling techniques using an initial base LULC map at a finer resolution to generate upscaled maps at coarser resolutions are thus highly required.
Various techniques were then developed in necessary and efficient ways (Sun et al., Citation2017), such as the Majority Rule-Based aggregation method (MRB; H.S. He et al., Citation2002; Saura, Citation2004), Point-Centred Distance-Weighted Moving Window (PDW; H.S. He et al., Citation2002), Random Rule-Based (RRB; Gardner et al., Citation2008), and Fusing Class Membership Probability and Confidence-level probability method (FMC; Sun et al., Citation2018). However, these techniques produced proportion errors of land covers and biased spatial/landscape patterns in the upscaled maps. For example, Moody and Woodcock (Citation1994) reported that the MRB led to the increase of the proportion of the dominant class. Moody and Woodcock (Citation1995) further reported that the proportion errors tend to decrease as patch size and initial proportions of cover types increase. Raj et al. (Citation2013) then compared the uncertainties from the MRB, PDW and RRB, which confirmed inevitable proportion errors and the biased spatial/landscape patterns (i.e. patch size and shape complexity) generated by these techniques. Sun et al. (Citation2018), (Citation2019) and Sun and Congalton (Citation2021) further quantitatively evaluated the errors of spatial pattern in upscaled maps using various landscape metrics (i.e. Patch-per-Unit, Aggregation index, Fragmentation, Dominance, Square-pixel index, and other metrics proposed by McGarigal et al., Citation2012). These previous studies indicated the inevitable and inaccurate LULC information in the upscaled maps.
How to efficiently report uncertainty information of upscaled maps for map users was then plaguing the community. Sun and Congalton (Citation2018) thus proposed a similarity matrix approach to evaluate the quality of upscaled maps. This approach assesses similarities between upscaled maps and their corresponding base map by three indicators: overall similarity, omission error, and commission error. However, two shortcomings were noticed considering map users’ practical demands for an optimal map. First, map users could not quantitatively assess the uncertain information at pixel level derived from the upscaled maps with mixed LULC information determined by the base map. They, thus, could not quantitatively evaluate the influence of the upscaled maps on their research. Second, map users are not aware of the spatial distribution of mapping uncertainties in the upscaled map. They are hindered from judiciously using LULC map by selecting either reliable spatial resolutions or suitable locations to fit in their research. The shortcomings inevitably pose a dilemma over opting a suitable map with uncertainty information, and consequently unknown uncertainties of various research. This considerably restricts burgeoning demand for LULC maps at different spatial resolutions for the community.
Most importantly, the unqualified upscaled maps potentially lead to errors or uncertainties for map users’ models (Verburg et al., Citation2011). The questions and dilemmas to select optimal maps for various research were then raised to plague the community over few decades. Additionally, the earth observation community highly demanded an informative estimate of uncertainty provided with a map (Griffiths et al., Citation2019; Lyons et al., Citation2018; Verburg et al., Citation2011). A quantitative and in-depth understanding of the uncertainty of upscaled maps is important to rescue the community from the predicament of choices selecting LULC data either at suitable spatial resolutions or at locations where the data has a lower uncertainty. Unlike frequently giving qualitative judgment on the upscaled maps, the quantitative approach should provide uncertainty information at pixel level, and considerably benefit decision-making in selecting an optimal map. Efforts, therefore, have been made to fulfill these requirements, but only few, to the best of our knowledge.
Taken together, quantitatively assessing the spatial uncertainties of the upscaled maps, therefore, is demanded. However, this demand is still crucially required to be satisfied over decades. Upscaling techniques use various rules to assign a categorical label to the upscaled pixel based on its corresponding categorical labels of the base map. The uncertainty information of the upscaled map at pixel level could be then described as the heterogeneity or the disorder of its corresponding categorical labels from the base map. The tricky question of how to present uncertain information in the upscaled map could be thus answered based on the information science. This is because that the upscaling technique is a classic example of the information communication between a base map and its corresponding upscaled maps. This paper, therefore, proposed a quantitative approach to assess the spatial uncertainty of the upscaled map at pixel level based on a valid theory of information communication, the Shannon Entropy. A popular upscaling technique, the Majority Rule Based Upscaling Approach (MRB), was employed to generate upscaled maps.
Materials and methods
Materials
The approach was validated using National Land Use data of China (NLUC) at 30 m for 2018 as the base data for upscaling. The data was obtained from the Resource and Environment Science and Data Center of the Institute of Geographic Sciences and Natural Resources Research (https://www.resdc.cn/). The data was reclassified into six LU types: crop, forest, grassland, water area, construction land, and unused land according to the metadata, using ArcGIS version 10.8, which covers Mainland, Taiwan, and China.
Uncertainty evaluation based on Shannon entropy
The Shannon Entropy (EquationEq. (1(1)
(1) )) was proposed to quantify the uncertainty of an information source for measuring the disorder in a system (Shannon, Citation1948). It has been validated as an effective approach to assess the heterogeneity of the attribute for an evaluation object (Wu et al., Citation2013; Yang et al., Citation2018). The higher entropy value represents higher uncertainty of the information. The upscaled maps generally aggregate the information of categorical labels from the corresponding base map containing heterogeneous attributes. The higher heterogeneity could result in higher entropy as well. Assessing this heterogeneity information thus becomes a vital breakthrough to evaluate the uncertainty of upscaled maps. Therefore, this paper developed an uncertainty evaluation approach based on the Shannon Entropy for upscaled maps at pixel level.
where is the entropy of the evaluation object X,
is the number of heterogeneous attributes,
is the
possible value
of out of
symbols,
is the probability of object
.
In the context of the upscaled maps, each categorical label represents one class type. The class type,, of the upscaled pixel
, is determined by the class types,
, of the corresponding pixels,
, in the base map. Thus, the uncertainty information (i.e. categorical heterogeneity) of upscaled pixel can be estimated by EquationEq. (2)
(2)
(2) . The occurrence probability of each class type,
, can be presented by
(EquationEq. (3
(3)
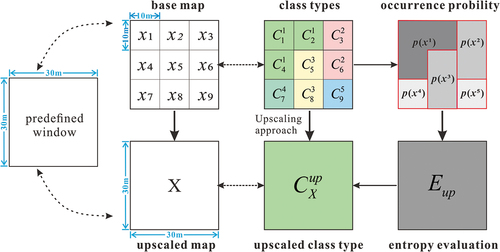
(3) )) based on the occurrence probability of all corresponding class types in the base map. If the number of the class type in the base map increases, the entropy value would increase. This could explicitly represent the uncertainty information contained in the upscaled pixels after giving a new class-type assignment. For example, in , the base map at 10 m spatial resolution is desired to be upscaled to 30 m spatial resolution. Nine pixels,
, from the base map, with five different class types,
,
,
,
, and
, respectively, are corresponding to the upscaled pixel,
. The number of each class type is 3, 2, 2, 1, and 1, respectively. The occurrence probabilities for all class types,
, are 3/9, 2/9, 2/9, 1/9, and 1/9, respectively, according to EquationEq. (3)
(3)
(3) . The
is then estimated as 2.1972 according to EquationEq. (2)
(2)
(2) .
Figure 1. Basic scheme of entropy evaluation algorithm for upscaled maps.
where is the entropy evaluation of the upscaled pixel,
is the occurrence probability of class type
corresponding to the upscaled pixel
,
and
are the total number of class type
and the total number of base pixels corresponding to
, respectively.
Majority rule based upscaling technique
The MRB, a common way (Sun et al., Citation2017), was selected to generate upscaled land cover maps. This upscaling technique determines the class type for the coarser resolution pixels in the upscaled map by selecting the most frequently occurring class from the finer resolution map contained within each coarser pixel (H.S. He et al., Citation2002; Saura, Citation2004). When there is more than one major class, the dominant class is selected at random (Raj et al., Citation2013). For each upscaled resolution of interest, a predefined and non-overlapping square window corresponding to the upscaling resolution (i.e. coarser resolution) is first constructed (H.S. He et al., Citation2002; Moody & Woodcock, Citation1995). The size of the window is the same as the desired spatial resolution of the output maps (Sun & Congalton, Citation2018). Each window is assigned a class based on the most frequently occurring class within it. For example, in , the predefined window is set as 30 m spatial resolution according to the desired spatial resolution of the upscaled maps. The class type of occurs three times that is larger than the frequencies of the other four classes within the predefined window. The class type of upscaled pixel,
is then assigned as
.
Results
Upscaling and its uncertainty evaluation
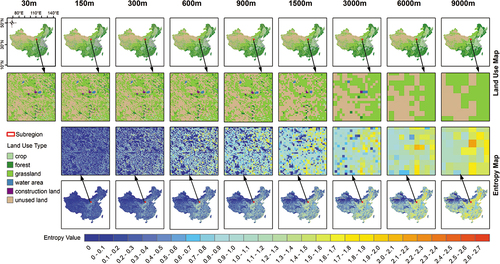
The MRB was conducted to generate upscaled LU maps at 150 m, 300 m, 600 m, 900 m, 1500 m, 3000 m, 6000 m, and 9000 m, respectively. The proposed evaluation method was used to assess the spatial uncertainties of all upscaled maps at pixel level. shows the upscaling maps and their associated uncertainty evaluation maps at pixel level. The higher entropy value indicates the higher uncertainty of the pixel. The results visually show that the upscaling technique led to considerable change of the representation of LU. Also, the extent of uncertain pixels with increasing entropy values is expanding with the upscaling.
Figure 2. Upscaled maps and their corresponding entropy maps. A subregion was selected to show details of all maps. The upper row shows the land use map at 30 m and its upscaling maps at 150 m, 300 m, 600 m, 900 m, 1500 m, 3000 m, 6000 m, and 9000 m, respectively. The lower row shows the corresponding entropy map as uncertainty evaluation at pixel level for the upscaling map of each row. A subregion was selected to show map details.
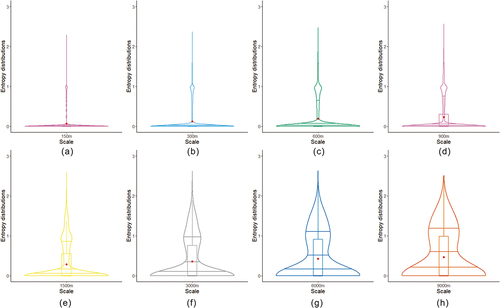
Statistical distribution of the entropy values at different scales
shows that the entropy values are highly variable due to the upscaling. The upscaled map with a coarser resolution shows a wider distribution of the entropy data. This represents a higher probability that the LU pixel would take on the given high entropy value. Also, the mean value increased from 0.0674 to 0.4260 with the variance increasing from 0.0513 to 0.3588 when the base map was upscaled from 150 m to 9000 m. For example, the highest entropy value reached 2.6398 for the scale of 6000 m. Furthermore, the inner box plots show increasing estimated quartiles with the upscaling.
Figure 3. Statistical distribution of the entropy values for each upscaled map. Results in (a), (b), (c), (d), (e), (f), (g), and (h) are calculated from all entropy values of all pixels of each scale (150 m, 300 m, 600 m, 900 m, 1500 m, 3000 m, 6000 m and 9000 m, respectively). Three lines in each sub-figure indicates the quartile positions. The whiskers show 1.5× interquartile range. The red point indicates the mean value of the entropy for each scale.
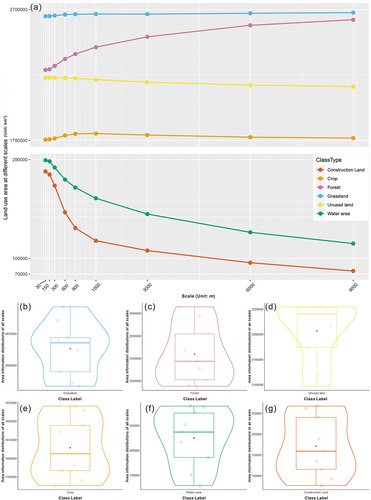
Biased and highly variable land use area information in upscaled maps
The upscaled maps show strongly biased LU area information ( (a)). The up-scaling technique results in a considerable decrease in water area, construction land area, and the unused land area, about 55.46% (from 288,811.1 km2 to 28,628.0 km2), 71.59% (from 267,194.0 km2 to 75,897.0 km2), and 2.92% (from 2,221,705.0 km2 to 2,158,650.0 km2), respectively. The technique results in the increase in the crop area, the forest area, and the grassland area, about 2.40% (from 1,785,237.0 km2 to 1,828,078.0 km2),15.36% (from 2,278,543.0 km2 to 2,628,612.0 km2) and 0.94% (from 2,653,360.0 km2 to 2,678,427.0 km2), respectively. Additionally, the LU area information provided by the upscaled maps is highly variable ( (b), (c), (d), (e), (f), and (g)). The standard deviation for grassland area, forest area, unused land area, crop area, water area, and construction land area, are 8573.896, 132,219.100, 24,497.240, 16,259.800, 58,867.780, and 72,814.760, respectively.
Figure 4. The area of each land use type derived from the upscaled maps, and its statistical distribution for all scales. (a) indicates that the area changes with upscaling for each land use type. (b), (c), (d), (e), (f) and (g) indicate the distribution of the area information of grassland, forest, unused land, crop, water area and construction land, respectively, of all different scales. The centre line indicates the median. The box limits indicate the upper and lower quartiles. The whiskers show 1.5× interquartile range. The centre point indicates the mean value of the data. Each jitter point indicates one data point.
Discussion
Upscaled maps contain considerable uncertain information of either the area or the spatial distribution. The LU area information from the upscaled map is highly variable due to the upscaling technique (). In this paper, the MRB as an example has shown that the area of the major LU type tended to increase with the upscaling, whilst the area of the minor LU type tended to decrease. For example, shows that the grassland gradually covers most of the subregion, whilst the crop, the forest, the water area, and the construction land were lost in the upscaled maps at 6000 m and 9000 m spatial resolution. This is because of the designed principles of MRB and the original area information from the base map that map users used (Raj et al., Citation2013; Sun et al., Citation2018). If different upscaling techniques were adopted, the area information would hardly be predicted or managed by map users. Earlier research also pointed out that mapping errors in base maps would significantly result in uncertain area information in upscaled maps (Sun et al., Citation2017). These facts further result in uncertain spatial distributions of LU types. Map users, therefore, urgently demand an approach to quantitatively assess the uncertainty of area information and spatial distributions of land use, who require maps at different scales to fit their experiments.
The approach proposed in this paper could satisfy the map users’ demands by quantitatively providing the heterogenous information at pixel level. The entropy value generated by the approach quantitatively indicates the uncertain information at specific locations. For example, shows that the uncertainty highly occurs at the boundary of different LU types, which is consistent with previous research (Sun & Congalton, Citation2018). Additionally, considering that the statistically estimated distribution of entropy values of the upscaled maps is easily accessible by many software (e.g., R studio), map users, therefore, could conveniently select optimal maps, and quantitatively evaluate the influence of upscaled maps on their research.
Additionally, our evaluation method lends a new perspective on the quality assessment of upscaled maps through the Shannon Entropy to assess the heterogeneous/uncertain degree. It could generate spatial quality assessment (QA) data assessing uncertainty for selecting suitable LULC data and evaluating uncertainty propagations to models of interest for map users. Earlier research hinge on the proportion errors calculated by the area information of land covers and the change of landscape patterns assessed by various landscape metrics. Although these evaluation methods could roughly assess the accuracy of upscaled maps, these could hardly support spatial analysts of uncertainty evaluation as the community expected. The QA data generated by the proposed method in this paper would potentially fulfil the expectation.
The results also demonstrate a general rule that the larger entropy value responses to the upscaling technique because the upscaled pixel usually contains more heterogeneous class information. This response is consistent with an earlier assessment of the upscaling procedure in response to heterogeneity (H.S. He et al., Citation2002; Moody & Woodcock, Citation1994, Citation1995; Raj et al., Citation2013; Sun & Congalton, Citation2021; Sun et al., Citation2018, Citation2019). However, the heterogeneity of the LULC represented by the base map would greatly impact the uncertainty of the upscaled maps (Sun & Congalton, Citation2021). If the LULC had a relatively higher homogeneous pattern, the upscaled pixels would contain less uncertain information or classes (Sun & Congalton, Citation2021). The entropy value would thus not keep increasing with the upscaling procedure. Consequently, the results indeed do not identify any strong dependence between the entropy value and the scale, but here we further confirm that spatial pattern (i.e. heterogeneity) greatly impacts the uncertainty of an upscaled map.
Taken together, results from this study provide an excellent proof of principle that the uncertainty evaluation approach based on the Shannon Entropy is a viable way for the uncertainty assessment of upscaled maps. Also, new upscaling techniques tackling the uncertainty issues should be addressed. For example, an upscaling procedure using adaptive windows to achieve a target upscaled size should be developed. Our analysis, thus, strongly suggests using this necessary and efficient approach for map users to most reasonably and scientifically use LULC data due to the existing substantial uncertainties.
Conclusion
This paper proposed an uncertainty evaluation approach based on the Shannon Entropy theory to quantitatively assess the uncertainty of the upscaled land cover maps. By developing an entropy evaluation algorithm at pixel level, the approach accounting for categorical heterogeneity information of the upscaled pixel. This quantitative information, taken as the uncertainty evaluation for upscaled maps at pixel level, could accurately describe the quality of upscaled maps for map users. A conventional upscaling technique, Majority Rule-Based aggregation (MRB), was used to generate the upscaled land use maps at 150 m, 300 m, 600 m, 900 m, 1500 m, 3000 m, 6000 m, and 9000 m, respectively, for Mainland and Taiwan, China, at 2018. The approach was then well performed to evaluate the uncertainty of these maps at pixel level. Two conclusions resulted from this performance: (1) the substantial and subtle uncertainties inevitably existing in upscaled maps deliver inaccurate information of land use area and spatial distributions of land use types. This urgently demands a quantitative approach for map users before making a decision on selecting the datasets as input to the users’ models; (2) the uncertainty evaluation approach based on the Shannon entropy enables map users to efficiently and accurately assess the quality of upscaled maps by reporting categorical heterogeneity information contained in the maps. Also, this easy-to-use approach could support uncertainty assessment of map users’ models using the upscaled maps as input. Overall, the importance of evaluating uncertainty of upscaled maps has been emphasized, whilst the approach has been validated in an efficient way. These findings strongly recommend that the earth observation community using the proposed and well-performed approach towards reasonable utilization of land use/cover maps at different scales.
Acknowledgments
The authors would like to thank the anonymous reviewers for their helpful suggestions and insightful comments that greatly improved our manuscript.
Disclosure statement
No potential conflict of interest was reported by the author(s).
Additional information
Funding
References
- Chen, G., Li, X., Liu, X., Chen, Y., Liang, X., Leng, J., Xu, X., Liao, W., Qiu, Y., Wu, Q., & Huang, K. (2020). Global projections of future urban land expansion under shared socioeconomic pathways. Nature Communications, 11(1), 1–12. https://doi.org/10.1038/s41467-020-14386-x
- Cole, B., Smith, G., & Balzter, H. (2018). Acceleration and fragmentation of CORINE land cover changes in the United Kingdom from 2006–2012 detected by Copernicus IMAGE2012 satellite data. International Journal of Applied Earth Observation and Geoinformation, 73, 107–122. https://doi.org/10.1016/j.jag.2018.06.003
- Doelman, J.C., Stehfest, E., Tabeau, A., van Meijl, H., Lassaletta, L., Gernaat, D.E.H.J., Hermans, K., Harmsen, M., Daioglou, V., Biemans, H., van der Sluis, S., & van Vuuren, D.P. (2018). Exploring SSP land-use dynamics using the IMAGE model: Regional and gridded scenarios of land-use change and land-based climate change mitigation. Global Environmental Change, 48, 119–135. https://doi.org/10.1016/j.gloenvcha.2017.11.014
- Gardner, R.H., Lookingbill, T.R., Townsend, P.A., & Ferrari, J. (2008). A new approach for rescaling land cover data. Landscape Ecology, 23(5), 513–526. https://doi.org/10.1007/s10980-008-9213-z
- Grafius, D.R., Corstanje, R., Warren, P.H., Evans, K.L., Hancock, S., & Harris, J.A. (2016). The impact of land use/land cover scale on modelling urban ecosystem services. Landscape Ecology, 31(7), 1509–1522. https://doi.org/10.1007/s10980-015-0337-7
- Griffiths, P., Nendel, C., & Hostert, P. (2019). Intra-annual reflectance composites from sentinel-2 and Landsat for national-scale crop and land cover mapping. Remote Sensing of Environment, 220, 135–151. https://doi.org/10.1016/j.rse.2018.10.031
- He, D., Shi, Q., Liu, X., Zhong, Y., & Zhang, X. (2021). Deep subpixel mapping based on semantic information modulated network for urban land use mapping. IEEE Transactions on Geoscience and Remote Sensing, 59(12), 10628–10646. https://doi.org/10.1109/TGRS.2021.3050824
- He, H.S., Ventura, S.J., & Mladenoff, D.J. (2002). Effects of spatial aggregation approaches on classified satellite imagery. International Journal of Geographical Information Science, 16(1), 93–109. https://doi.org/10.1080/13658810110075978
- He, Y., Xia, C., Shao, Z., & Zhao, J. (2022). The spatiotemporal evolution and prediction of carbon storage: a case study of urban agglomeration in China’s Beijing-Tianjin-Hebei region. Land, 11(6), 858. https://doi.org/10.3390/land11060858
- Le Provost, G., Badenhausser, I., Le Bagousse-Pinguet, Y., Clough, Y., Henckel, L., Violle, C., Bretagnolle, V., Roncoroni, M., Manning, P., & Gross, N. (2020). Land-use history impacts functional diversity across multiple trophic groups. Proceedings of the National Academy of Sciences, 117(3), 1573–1579. https://doi.org/10.1073/pnas.1910023117
- Li, X., & Zhou, W. (2018). Dasymetric mapping of urban population in China based on radiance corrected DMSP-OLS nighttime light and land cover data. Science of the Total Environment, 643, 1248–1256. https://doi.org/10.1016/j.scitotenv.2018.06.244
- Lyons, M.B., Keith, D.A., Phinn, S.R., Mason, T.J., & Elith, J. (2018). A comparison of resampling methods for remote sensing classification and accuracy assessment. Remote Sensing of Environment, 208, 145–153. https://doi.org/10.1016/j.rse.2018.02.026
- Matasov, V., Prishchepov, A.V., Jepsen, M.R., & Müller, D. (2019). Spatial determinants and underlying drivers of land-use transitions in European Russia from 1770 to 2010. Journal of Land Use Science, 14(4–6), 362–377. https://doi.org/10.1080/1747423X.2019.1709224
- McGarigal, K., Cushman, S.A., & Ene, E. (2012). FRAGSTATS v4: Spatial pattern analysis program for categorical andcontinuous maps. University of Massachusetts. http://www.umass.edu/landeco/research/fragstats/fragstats.html
- Moody, A., & Woodcock, C. (1994). Scale-dependent errors in the estimation of land-cover proportions: Implications for global land-cover datasets. Photogrammetric Engineering and Remote Sensing, 60(5), 585–594.
- Moody, A., & Woodcock, C.E. (1995). The influence of scale and the spatial characteristics of landscapes on land-cover mapping using remote sensing. Landscape Ecology, 10(6), 363–379. https://doi.org/10.1007/BF00130213
- Raj, R., Hamm, N.A.S., & Kant, Y. (2013). Analysing the effect of different aggregation approaches on remotely sensed data. International Journal of Remote Sensing, 34(14), 4900–4916. https://doi.org/10.1080/01431161.2013.781289
- Saura, S. (2004). Effects of remote sensor spatial resolution and data aggregation on selected fragmentation indices. Landscape Ecology, 19(2), 197–209. https://doi.org/10.1023/B:LAND.0000021724.60785.65
- Shannon, C.E. (1948). A mathematical theory of communication. The Bell System Technical Journal, 27(3), 379–423. https://doi.org/10.1002/j.1538-7305.1948.tb01338.x
- Sohl, T., Reker, R., Bouchard, M., Sayler, K., Dornbierer, J., Wika, S., Quenzer, R., & Friesz, A. (2016). Modeled historical land use and land cover for the conterminous United States. Journal of Land Use Science, 11(4), 476–499. https://doi.org/10.1080/1747423X.2016.1147619
- Sun, P., & Congalton, R.G. (2018). Using a similarity matrix approach to evaluate the accuracy of rescaled maps. Remote Sensing, 10(3), 487. https://doi.org/10.3390/rs10030487
- Sun, P., & Congalton, R.G. (2021). The impact of landscape characteristics on the performance of upscaled maps. Geocarto International, 36(17), 1905–1922. https://doi.org/10.1080/10106049.2019.1678681
- Sun, P., Congalton, R.G., Grybas, H., & Pan, Y. (2017). The impact of mapping error on the performance of upscaling agricultural maps. Remote Sensing, 9(9), 901. https://doi.org/10.3390/rs9090901
- Sun, P., Congalton, R.G., & Pan, Y. (2018). Improving the upscaling of land cover maps by fusing uncertainty and spatial structure information. Photogrammetric Engineering and Remote Sensing, 84(2), 87–100. https://doi.org/10.14358/PERS.84.2.87
- Sun, P., Pan, Y., & Zhang, J. (2019). Comparison of upscaling cropland and non-cropland map using uncertainty weighted majority rule-based and the majority rule-based aggregation methods. Geocarto International, 34(2), 149–163. https://doi.org/10.1080/10106049.2017.1377773
- Tan, S., Xu, Z., & Ti, P. (2015). A comparative study on effects of spatial aggregation for globeland30. In 2015 23rd International Conference on Geoinformatics (pp. 1–4). IEEE press. https://doi.org/10.1109/GEOINFORMATICS.2015.7378706
- Tesfaw, A.T., Pfaff, A., Golden Kroner, R.E., Qin, S., Medeiros, R., & Mascia, M.B. (2018). Land-use and land-cover change shape the sustainability and impacts of protected areas. Proceedings of the National Academy of Sciences, 115(9), 2084–2089. https://doi.org/10.1073/pnas.1716462115
- van Vliet, J., Verburg, P.H., Grădinaru, S.R., & Hersperger, A.M. (2019). Beyond the urban-rural dichotomy: Towards a more nuanced analysis of changes in built-up land. Computers, Environment and Urban Systems, 74, 41–49. https://doi.org/10.1016/j.compenvurbsys.2018.12.002
- Verburg, P.H., Neumann, K., & Nol, L. (2011). Challenges in using land use and land cover data for global change studies. Global Change Biology, 17(2), 974–989. https://doi.org/10.1111/j.1365-2486.2010.02307.x
- Wu, Y., Zhou, Y., Saveriades, G., Agaian, S., Noonan, J.P., & Natarajan, P. (2013). Local Shannon entropy measure with statistical tests for image randomness. Information Sciences, 222, 323–342. https://doi.org/10.1016/j.ins.2012.07.049
- Yang, W., Xu, K., Lian, J., Ma, C., & Bin, L. (2018). Integrated flood vulnerability assessment approach based on TOPSIS and Shannon entropy methods. Ecological Indicators, 89, 269–280. https://doi.org/10.1016/j.ecolind.2018.02.015
- Zen, M., Candiago, S., Schirpke, U., Egarter Vigl, L., & Giupponi, C. (2019). Upscaling ecosystem service maps to administrative levels: Beyond scale mismatches. Science of the Total Environment, 660, 1565–1575. https://doi.org/10.1016/j.scitotenv.2019.01.087
- Zhang, C., Wei, S., Ji, S., & Lu, M. (2019). Detecting large-scale urban land cover changes from very high resolution remote sensing images using CNN-Based classification. ISPRS International Journal of Geo-Information, 8(4), 189. https://doi.org/10.3390/ijgi8040189
- Zhang, J., Ren, M., Lu, X., Li, Y., & Cao, J. (2022). Effect of the belt and road initiatives on trade and its related LUCC and ecosystem services of central asian nations. Land, 11(6), 828. https://doi.org/10.3390/land11060828