
 ?Mathematical formulae have been encoded as MathML and are displayed in this HTML version using MathJax in order to improve their display. Uncheck the box to turn MathJax off. This feature requires Javascript. Click on a formula to zoom.
ABSTRACT
The abandonment of farmland is leading to a loss of production capacity in many agricultural systems. This article proposes a methodology for carrying out Joint Cropland Management (JCM) initiatives, which involve the cooperative use of land plots without affecting ownership, in areas with a fragmented land structure. Our framework combines a socioeconomic assessment of farmers with remote sensing and machine learning methods. Areas at risk of abandonment are located, based on which potential land groupings are proposed. The methodology was validated through a pilot test that identified 11 areas showing economic potential for JCM initiatives, comprising 647 abandoned plots, with 154 plots owned by members of an agricultural cooperative. The methodology is easily scalable for application to agricultural systems characterised by atomised land structures.
1. Introduction
Cropland abandonment represents a challenge because of its environmental, landscape and socioeconomic impacts (Arnaez et al., Citation2011; Lasanta et al., Citation2015; MacDonald et al., Citation2000; Perpiña Castillo et al., Citation2021; Quintas-Soriano et al., Citation2022). Abandoned land has fundamentally altered extensive rural landscapes in Europe and North America (S. Li & Li, Citation2017). In Europe, approximately 120 million hectares (Mha) of land have been abandoned since the 1990s (Levers et al., Citation2018) and the figure is projected to reach 183 Mha by 2030, with Spain and Poland being the most affected European countries. Spain is expected to lose more than 1 Mha of cropland between 2015 and 2030 (Perpiña Castillo et al., Citation2021). From a food security perspective, cropland abandonment represents an under-resourcing of farmland resources, leading to a reduction in agricultural productivity (Deng et al., Citation2021), a decrease in the capacity of land to assure food supply, and a decline in the livelihood of rural communities (Malek et al., Citation2018). Moreover, it poses a challenge for multifunctional landscapes (Quintas-Soriano et al., Citation2022).
Cropland abandonment is compromising the future of many farm cooperatives in Spain, which are suffering a direct loss of available produce linked to members’ retirement or land abandonment (Colombo & Perujo-Villanueva, Citation2017; Tudela-Marco & Garcia-Alvarez Coque, Citation2017). In Spain, an emerging response to this issue is the collective cultivation of land plots at risk of abandonment through Joint Cropland Management (JCM) initiatives, whereby agricultural cooperatives carry out the joint cultivation of leased or let land plots with no change in ownership (Garcia-Alvarez-Coque & Piñeiro, Citation2022). The abandonment of members’ plots has an obvious economic impact on agricultural cooperatives. The drop in production volume hinders the role of cooperatives as aggregators of supply, undermining their profitability and competitiveness, especially in the case of small-scale cooperatives.
Despite their convincing rationale, JCM initiatives have not been as successful as expected (Piñeiro et al., Citation2021). Cultural resistance and plot fragmentation increase the transaction costs associated with JCM initiatives (Garcia-Alvarez-Coque et al., Citation2021).
One challenge of JCM initiatives is the task of identifying eligible plots for joint cultivation. When it comes to the efficient and accurate selection of land plots, the collective entity or cooperative in charge faces the difficulty of predicting which farm plots will be abandoned in the near future. It is not simply a matter of locating abandoned plots; the socioeconomic characteristics of landowners must also be considered in the selection process. The main objective of this article is to provide a method to identify land plots that are suitable candidates for grouping, including both cultivated and abandoned plots, through the assessment of the socioeconomic characteristics of landowners and supported by geographical planning tools.
Land abandonment is the result of farmers’ characteristics including farm size, market expectations, age, and lack of potential successors (Keenleyside & Tucker, Citation2010; López-Iglesias et al., Citation2013; Plieninger et al., Citation2016). To leverage complementary layers of information, our methodology combines socioeconomic, remote sensing and machine learning methods to assess land plots, and thus optimise the sustainability and productivity of farming practices (Tey & Brindal, Citation2012). By incorporating a layer with areas that show socioeconomic potential for abandonment, this paper is aimed at enabling the efficient detection of abandoned plots, or plots at risk of becoming abandoned, thereby facilitating their recovery, and grouping. The methodology is validated by an empirical application to an agricultural area with weak farm structures, in Southern Europe.
The paper is organised as follows. Section 2 describes the JCM initiatives, while section 3 describes the studied area. Section 4 explains the research procedure for identifying eligible plots based on individual socioeconomic characteristics and risk of abandonment. Section 5 presents the empirical results of the pilot study. Sections 6 and 7 provide the discussion and conclusions, respectively, including management and research implications.
2. Joint cropland management initiatives and potential abandoned land
Excessive fragmentation is one of the main barriers to the profitability of agricultural production (Janus, Citation2020; J. Wang et al., Citation2022). JCM initiatives are targeted at improving farm structures in areas where they are atomised and fragmented. Plot grouping, with or without the exchange of ownership rights, is designed to increase farmers’ incomes, optimise farm size, and strengthen business structures through cost reduction and professional management. Such initiatives represent an alternative strategy to government-run land consolidation projects, which entail significant investment costs and a change or substitution of ownership rights (Gorgan & Bavorova, Citation2022; Haldrup, Citation2015). Indeed, JCM allows the voluntary grouping of land plots through flexible lease or cession contracts with landowners facilitating the collective cultivation (Garcia-Alvarez-Coque & Piñeiro, Citation2022). Agricultural cooperatives that choose to apply such a strategy take charge of mediating and managing cooperative members’ land (Garcia-Alvarez-Coque et al., Citation2021; Piñeiro et al., Citation2021). In short, this strategy provides ways to increase the scale of cultivation and reduce land fragmentation (Calafat-Marzal et al., Citation2022; Cervera et al., Citation2021; Tudela-Marco & Garcia-Alvarez Coque, Citation2017). JCM involves three types of actors: landowners, cooperatives (or grouping arrangements) and the people who cultivate the land, who may or may not be landowners or members of the cooperative. The implementation of this strategy requires substantial social capital and sound knowledge of landowners’ individual characteristics that can be used to predict the stock of abandoned land in the short or medium term.
Land use information must be available to enable data-driven decision-making, as this can help reduce the transaction costs of dealing with the landowners and cooperatives’ members and enable efficient operations in the area. Cooperatives or mediating entities can evaluate the socioeconomic characteristics of their members to identify land plots which can be proposed for collective farming.
In addition to individual farmer and landowner characteristics, precise territorial data provide information for the evaluation of cropland at risk of abandonment. Land use data can be collected from satellite images with high spatial resolution, employing sensors that measure spectral bands and allow vegetation indices to be calculated. Data are then processed and analysed using supervised classification machine learning techniques to classify agricultural plots (Gibson et al., Citation2020; Morell-Monzó et al., Citation2020, Citation2021; Segarra et al., Citation2020; Thanh Noi & Kappas, Citation2017), labelling the land as in production, abandoned, or at risk of being abandoned.
In the following sections we propose an integrated methodological framework, which can be applied to different contexts. The objective of the framework is threefold: 1) to assess the socioeconomic characteristics of landowners and identify a potential stock of land at risk of abandonment; 2) to identify the abandoned plots in the study area, also including land plots which are not owned by cooperative members; 3) to identify the best areas in which to propose JCM initiatives.
3. Study area
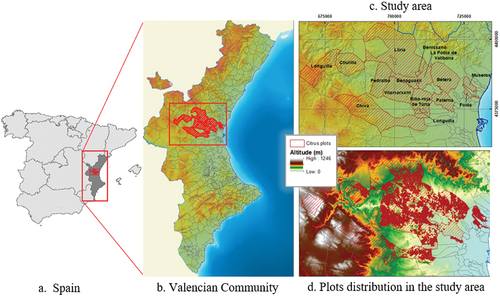
The methodology is validated through an empirical application to a fragmented agricultural area in the Valencian Community (VC), located in Eastern Spain (). It is a fairly urbanised region with three orographic areas: inland, intermediate, and coastal zones (Generalitat Valenciana, Citation2020). Common crops include fruit, particularly citrus, mainly under irrigation. Orchards are predominantly located in the intermediate and coastal zones, with citrus accounting for 51% of the total crop area. According to the last Agricultural Census (Citation2022), the average farm size is 6 ha (4 ha for citrus), but agricultural holdings are often scattered among several plots. In addition, 90% of the farms account for less than one annual work unit.Footnote1 Some conflicts in land use appear in the coastal zone, due to the spread of industry and tourism (Recatalá et al., Citation2000). Our study area is in the intermediate zone (), which includes towns, some rain-fed agriculture, and irrigated crops, such as the citrus areas covered by our case study.
Figure 1. Study area.
Lasanta et al. (Citation2017) conducted a thorough review the causes of agricultural land abandonment in Europe, categorising them into global and local causes (Lasanta et al., Citation2017; Quintas-Soriano et al., Citation2022). Our interest is in local factors that affect farmers’ choices. These include agri-environmental factors, such as soil, erosion, salinisation, climate, accessibility, and slope; as well as socioeconomic factors, which depend on the individual characteristics of family farms, and are closely related to the age of the farmer, size of land plots, and yields and profitability of the main crops.
Given the limited size of our study area (948 km2), the farm plots analysed share similar agri-environmental characteristics. All the land plots in the area are easily accessible from regular roads or highways and enjoy access to available water through irrigation. All plots are within the citrus land use classifications or irrigated mixed crop areas according to the Spanish Land Use Information System (SIOSE), forming part of the National Plan for Territory Observation (PNOT). In addition, the altitudes where the citrus plots are located are in the same range within the region’s intermediate zone (2 m to 500 m above sea level), and outside the inland areas of higher relief and steeper slopes (0 m to 1,246 m above sea level). 85% of the case study’s plots have an average altitude below 200 m with a slope below 3%. Individual farmers’ socioeconomic characteristics are considered a major land abandonment factor and deserve scrutiny. The study area has registered a significant rise in land abandonment due to the competition for space driven by urban development, the lack of generational renewal in farming activities, and the barriers to competitiveness posed by the small size of the cultivated plots (Arnaez et al., Citation2011; Cervera et al., Citation2021; Lasanta et al., Citation2015, Citation2017; MacDonald et al., Citation2000; Ruiz-Varona et al., Citation2022; Ustaoglu & Collier, Citation2018). Therefore, in our case study, the main cause of abandonment lies in structural socioeconomic factors. Environmental factors are not a key indicator for spatially distinguishing plots at risk of abandonment in the analysed area.
An agricultural cooperative works in the selected area, operating approximately 1,000 hectares in the municipality of Benaguasil, with 600 hectares of citrus orchards. In terms of capacity, the cooperative can harvest and pack 50,000 tonnes of citrus fruit per year; however, it currently handles an average of 25,000 tonnes per year (of which cooperative members produce 18,000 tonnes and the rest is purchased from neighbouring non-member farmers). This excess capacity is detrimental to cost performance, reducing profits, and discouraging cooperative members from continuing their agricultural activity. The cooperative’s managers estimate that it loses approximately 25 members each year. As a result, there has been a dramatic rise in the appearance of abandoned citrus plots in the region, prompting the need for a return to cultivation at an improved scale. We consider the case study as a relevant test of the proposed methodology, which can then be extended to other geographical contexts.
4. Methodology
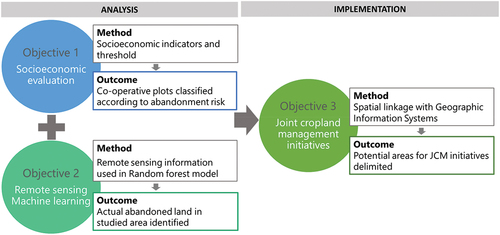
The proposed methodological framework (see ) has been designed to meet the three objectives defined in Section 2. For the first objective (to assess socioeconomic characteristics), information is collected on the characteristics of cooperative members, and performance thresholds are generated. For the second objective (to identify the abandoned plots), a random forest (RF) model is built based on remote sensing data to identify the plots that have been abandoned or are at risk of abandonment. Finally, for the third objective (to identify the best areas for JCM initiatives), the results of the two previous objectives are combined with Geographic Information Systems (GIS) to identify the areas eligible for plot grouping. Methods and data sources for each objective are detailed in the following sub-sections.
Figure 2. Methodological framework.
4.1. Objective 1: socioeconomic risk indicators
Our research pathway draws on the one suggested by Bürgi et al. (Citation2022), who propose anticipating land use change to support planning and policy. Identifying the conditions that favour system transformation can support planning and the formulation and implementation of appropriate actions.
Like many other Spanish cooperatives, the entity on which our case study focuses is a social economy business owned by its members, who are also its product suppliers, meaning it mostly depends on its own volumes, yields and qualities. It is important to know what cooperative members can offer to the business marketing plan. The conditions for predicting land use change are based on structural characteristics of the land plots reported by the cooperative’s members. The present and future capabilities of farm plots can be monitored and categorised through a ‘traffic-light’ approach (Cervera et al., Citation2021), where the colours refer to the likelihood that production will continue in the near future. Data supplied by the cooperative (January 2021) were used to build a database of the socioeconomic characteristics of the members and the land plots. By so doing, it is possible to anticipate the risk of abandonment and the productive potential of each plot. As noted in Section 3, although environmental and geographic factors can potentially influence the loss of agricultural land (Corbelle-Rico & Crecente-Maseda, Citation2014; Terres et al., Citation2015), the present study does not take these factors into consideration when categorising the plots in the area used by cooperative members. All the plots in the area have similar environmental and geographic characteristics (soil quality, water availability, climate, slope, etc.), and these factors do not act as key drivers of abandonment in the area. This does not mean that agri-environmental factors are not potentially relevant in other larger, more isolated, and hilly areas, which are environmentally less homogenous. The machine learning methodology proposed in this article could be easily extended to the assessment of such challenging agricultural areas. However, once the plot grouping initiatives have been identified, the agri-environmental indicators are checked to confirm the suitability of the selected plots.
The database contains the productive characteristics of the land plots (type of crop or variety, harvested area, planting year, yields, quality, among other characteristics) as well as the social characteristics of the cooperative’s members (age and likelihood of generational renewal) (Calafat-Marzal et al., Citation2022). From this database, the indicators that best predict land abandonment were selected (Corbelle-Rico & Crecente-Maseda, Citation2014; Terres et al., Citation2015). Indicators refer to: (i) farmer’s age, which is generally acknowledged as an important driver of land abandonment; (ii) size of farm plots, with larger plots raising the likelihood of succession and exploitation of economies of scale; (iii) productivity of yields, depending on the age of planting, since yield declines with age generating lower profitability after 20 years (Pérez-Salas et al., Citation2012; Ribal et al., Citation2017); and (iv) commercial quality, which means more income for farmers and affects individual land use strategies (Wilson, Citation2014).
Land plots were classified into three groups according to their expected land use change: ‘green’ (high potential for continuing cultivation); ‘red’ (high risk of abandonment); and ‘amber’ (moderate risk of abandonment).
Thresholds for each category were established to delimitate desirable levels of the selected variables, which are considered compatible with a high likelihood of a plot continuing production.
Proposals for the thresholds were based on consultation with a panel of experts, formed by members of the ‘Operational Group of Social Innovation in Land Management’ – Innoland— of the European Innovation Partnership for agriculture and agricultural productivity (EIP-AGRI). The group contained eight experts, including representatives from agronomic research, public agriculture administration, credit institutions and cooperative firms and federations. includes the selected thresholds for the analysed cooperative based on experts’ and the cooperative’s expertise as well as socioeconomic factors specific to the agricultural context. The traffic-light consultation was completed by April 2021. The thresholds are considered suitable for the study area and could be adapted, through specific investigation and suitable expert assessment, when the method is applied to other zones.
Table 1. Indicators and thresholds for the ‘traffic-light’ land use tool established by the expert panel.
After determining the thresholds, land plots were classified into the three categories, according to the criteria presented in , which were also proposed by the expert panel. For the classification of the land plots, a value is assigned for each category.
Table 2. Classification of the socioeconomic characteristics of members and land plots.
4.2. Objective 2: plot identification through satellite information and machine learning
Abandoned farm plots in the area, regardless of whether or not they are owned by cooperative members, were located using remote sensing information. The reason for doing so is to identify the areas where the cooperative can offer contractual arrangements to cultivate abandoned plots.
This phase of the study begins by obtaining satellite images provided by Sentinel-2. Data are processed and integrated using GIS to generate the database with the spectral bands and vegetation indices, which are then used to classify the plots, through the application of the RF algorithm. depicts the methodological workflow followed in this phase of the study. The plot detection and classification steps are explained in more detail in the following sections.
Figure 3. Workflow followed to classify the plots.
4.2.1 Pre-processing database
Three sources were used to generate the database with the information on the agricultural plots in the study area:
Spectral bands and vegetation indices from Sentinel-2’s images.
GIS for the identification of agricultural plots (SIGPAC).
Spanish National Orthophotography Plan (PNOA). This plan is a geographic information program of reference for the National Plan for Territory Observation (PNOT). Its objective is the acquisition of aerial orthophotos of the entire Spanish territory, with an image resolution of at least 25 or 50 cm. The images are obtained from a digital photogrammetric flightFootnote2 and data processing based on technical specifications that comply with the premises and guidelines of the Infrastructure for Spatial Information in the European Community (INSPIRE) Directive (Directive 2007/2/EC). Data are open access available from the Spanish Cartographical Institute (IGN) website. The photogrammetric flight was performed in 2020.
Satellite data from the Sentinel-2 mission were chosen for their medium spatial resolution. Its radiometry includes three vegetation red edge bands. These two characteristics make the Sentinel-2 data particularly suitable for land use and land cover mapping (Abdi, Citation2020). The Sentinel-2 images for the study area were obtained in July 2020 (Sensor: MSI; Level 2A, relative orbit 051) through CopernicusFootnote3 at the L2A level for the atmospherically corrected bands B02 (Blue), B03 (Green), B04 (Red) and B08 (near infrared-NIR), following the studies by Morell-Monzó et al (Citation2020, Citation2021);. Saini and Ghosh (Citation2018); Thanh Noi and Kappas (Citation2017), where bands are used at a resolution of 10 m for the classification of agricultural plots.
Four spectral vegetation indices were calculated from Sentinel-2A images () using map algebra tools provided by the ArcGIS software toolbox (Esri, U.S.A.).
Table 3. References and equations of the spectral vegetation indices evaluated in this study.
The Normalised Difference Vegetation Index (NDVI) is one of the most used vegetation indices in studies on vegetation land use and land cover classification, as it reflects changes in crop growth. However, it is easily disturbed by soil reflectance when the canopy density is low, and it is easily saturated with dense vegetation. The Soil-Adjusted Vegetation Index (SAVI) can compensate for the influence of soil background and the Enhanced Vegetation Index (EVI) can correct the saturation effect (X. Li et al., Citation2021).
TTVI is a transformation of the NDVI and is used because it removes negative values and often transforms NDVI histograms into a more normal distribution (Araya et al., Citation2021).
The second information source used is the Land Plot Identification System (LPIS). In Spain, this is provided by the Spanish Geographical Information System for Agricultural Plots (SIGPAC), which assigns a unique land use to each plot. The SIGPAC allows the geographical identification of the plots declared by farmers, under any subsidy scheme related to the area cultivated or targeted at livestock breeding.
The third information source is PNOA, with open access data available from the Spanish Cartographical Institute (IGN) website. The data were obtained through a photogrammetric flight performed in 2020.
SIGPAC identified 37,340 citrus plots in the study area in 2020. The layer was created in vector format and was overlaid and photo-interpreted with a mosaic of high-resolution aerial orthorectified images from the PNOA.
Each plot contains several pixels with the information on the spectral bands and vegetation indices. Pixels close to the boundary may have different characteristics, so a ten-metre buffer was drawn around the inner boundary of the plot and removed, before averaging the values for each plot (Morell-Monzó et al., Citation2020).
The database with the plots of the study area (37,340 citrus plots) to be classified includes the following data: the geographical description of the SIGPAC plots and the average pixel values used for the spectral bands (B02, B03, B04 and B08) and vegetation indices (NDVI, EVI, TTVI and SAVI).
4.2.2 Statistical analysis
The database was divided into two sets (): one with plots classified by photo interpretation (sample) and the other with the remaining unclassified plots. The sample is composed of plots that, in addition to containing all the data in the database, have been classified into categories. These sample plots are used to build and validate the RF model. The rest of the plots in the database remain unclassified until the prediction model is obtained.
The sample has 1,417 plots (4% of all the plots in the study area), which are divided into four categories ():
Figure 4. Categories of plots classified according to the type of land cover.Where: a) in production with large trees, b) in production with small trees, c) Not in production, d) Abandoned land.
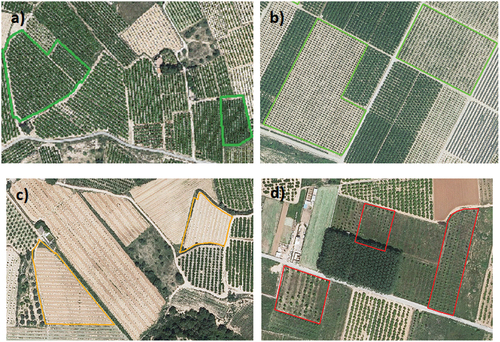
- In production: Plots with trees in production. In this category, the trees cover most of the surface.
o With large tree size: Plots with trees in full production. Here, areas of bare soil are not visible due to the variety and size of the trees ().
o With small tree size: Plots with a large area of bare soil. The smaller size of the trees is due to the planted varieties or because they are not in full production ().
- Not in production: Plots with bare soil covering most of the surface. These plots are in replacement periods. In this category, there may be planted trees, but they are non-productive ().
- Abandoned land: Plots with wild vegetation, with or without trees ().
The sample plots were selected by photointerpretation (visual interpretation). To ensure the quality and accuracy of this selection, the information provided by aerial photography was cross-checked against the available multispectral images. Each category has different spectral characteristics, and it is necessary to have samples of pixels so that the areas of interest are adequately represented when the classification step is carried out. Accordingly, the selection of sample plots includes plots from all areas and at different points within each area.
We chose to use 4% of total plots because this percentage is large enough for the plots to be adequately dispersed across the study area and does not exhaust available computing power (Abdi, Citation2020). As mentioned above, the sample contains 1,417 plots: 355 abandoned, 341 not in production, 354 in production with large trees, and 367 in production with small trees. The sample database includes the plots with the classification and the band values and spectral indices.
4.2.2.1. Machine learning analysis
Machine learning algorithms offer effective and efficient classification power, as they are capable of handling high-dimensional data and modelling complex non-linear relationships (Thanh Noi & Kappas, Citation2017). Support Vector Machine (SMV) and RF are usually the most accurate algorithms and are insensitive to noise and overtraining (Thanh Noi & Kappas, Citation2017). In this study, RF was applied for the classification algorithm because it provided better true classification rates.
RF models (Breiman, Citation2001) have been widely applied to analyse the complex mechanisms in earth-surface processes in natural and social coupling systems (Adane & Bewket, Citation2021). In our study, we used the Random Forest package of R software (2021.09.1). RF is a non-parametric supervised classification algorithm, consisting of a bootstrap combination of aggregate classifiers, which runs n-decision tree algorithms with the input data. Each decision tree yields a given classification, and the resulting output is the one with the most votes from each class (Abdi, Citation2020). The number of trees processed was 500.
The data introduced into the RF model were the sample data (355 abandoned plots, 341 not in production, 354 in production with large trees, 367 in production with small trees). The sample was divided into two sets: 75% for training (1,062 plots) and the remaining 25% for model validation (355 plots). After validating the model, the rest of the plots were classified using the predict function of R (35,923 unclassified plots).
The confusion matrix allows us to visualise the performance of a supervised learning algorithm. Each column of the matrix represents the number of predictions of each class, while each row represents the actual class, and reveals the accuracy of our model and the errors it makes when going through the learning process with the data. From the confusion matrix, we can determine the values of sensitivity, specificity, accuracy, and precision. A confusion matrix for a binary problem () is a 2 × 2 matrix. Assuming that one class is ‘positive’ and the other is ‘negative’ we obtain four possible combinations of predicted vs. actual class: True Positive (TP), False Positive (FP), True Negative (TN), False Negative (FN).
Table 4. Confusion matrix (2×2).
Based on the confusion matrix, for any RF model, several indicators that reflect feature importance can be calculated. One indicator based on the out-of-bag (OOB) error is called Mean Decrease Accuracy (MDA). This indicator randomly breaks the eigenvalues of the OOB sample data and then re-evaluates the OOB error for each generated tree. Therefore, MDA is the average of the difference between two OOB test errors, and it indicates how much the model accuracy decreases if we drop the variable in question (Zhang & Ma, Citation2012). The other metric is called Mean Decrease Gini (MDG), and it assesses the difference between the Gini index before and after classification (Nembrini et al., Citation2018). The MDA and MDG indicators enable the assessment of the importance of a feature within the RF model (Calle & Urrea, Citation2011). High values indicate a greater degree of importance of the feature. Both indicators are based on the results of the classification task, that is, they are a posteriori metrics of the classification stage.
The validation of the success and predictive performance of the model was based on the receiver operating characteristic (ROC) curves. The vertical axis of the ROC curve represents the actual positive percentage (sensitivity), and the horizontal axis is the false positive percentage (specificity). In the ROC curve, the Area Under Curve (AUC) served as the performance metric of the validation model. The estimated AUC values range between 0.50 and 1.00 and can be classified based on a quantitative – qualitative classification scheme as follows: 0.5–0.6 (poor), 0.6–0.7 (average), 0.7–0.8 (good), 0.8–0.9 (very good), and 0.9–1 (excellent) (Jet & O H, Citation2017).
Lastly, RF draws a multidimensional scaling (MDS) plot. MDS is a tool that can be used to obtain quantitative estimates of similarity among groups of items. More formally, MDS refers to a set of statistical techniques that are used to reduce the complexity of a data set, allowing a visual appreciation of the underlying relational structures contained therein (Hout et al., Citation2013). The MDS plot projects a high-dimensional measure onto a 2D surface, depicting the similarities among plots and their respective categories.
4.3. Objective 3: selecting plot groupings
The results of the two previous phases were combined to propose areas eligible for JCM initiatives. The vector layers were added using spatial join tools in ArcGIS software, combining:
o The database with the ‘traffic-light’ data and categories for the cooperative members’ plots. The corresponding plots constitute the ‘red’ and ‘amber’ areas at risk of abandonment.
o The database resulting from the supervised classification based on the RF algorithm.
The unique identifier of each plot is used to represent the georeferenced data from both databases. In this way, the most suitable areas for plot grouping are detected.
Using the spatial location tools, several interactions were carried out to select plots classified as abandoned and bordering or close to the red or amber cooperative plots. In the first iteration, those that fulfilled the location conditions with respect to the cooperative plots were selected, and in successive iterations, those that fulfilled the location conditions with respect to the ones selected in the previous iteration were selected. The iterations were carried out until a considerable number of abandoned plots had been selected, but it should be noted that this number could increase, as the objective was to locate areas with clusters of plots measuring more than 5 ha, which is the minimum viable size for a farm, having been identified by the panel of experts as the feasibility threshold for citrus. To identify the clusters based on the geographical position of the selected abandoned plots, 10-metre buffers were drawn around each plot, and intersections were generated between them. Finally, the cooperative plots near each cluster were selected and the number of plots and the total areas of abandoned and cooperative plots were calculated for each one. Each cluster of plots with a minimum area of 5 ha constitutes a possible JCM project; the panel of experts (see Objective 1) deemed 5 ha to be a reasonable size for a productive citrus plot.
5. Results
5.1. Traffic light classification
shows the results of the ‘traffic-light’ land use tool applied to the cooperative in our case study. Of the 1,472 plots owned by cooperative members, only 0.68% were classified in the red group, while 8.83% were classified in the green group (). A total of 90.49% of the cooperative’s plots were classified as ‘amber’, with this classification being mainly due to a problem of plot size (84.14%).
Table 5. ‘Traffic-light’ results for the cooperative in the case study.
With regard to the area covered by the groups, the red group accounts for only 0.31%, while the green group accounts for 32.79%. The amber group, on the other hand, represents 66.90% of the total area of the plots owned by the cooperative’s members, with the most critical subgroup being plot size (49.54%).
shows the territorial location of the members’ plots categorised through the ‘traffic-light’ approach.
Figure 5. Distribution of the plots of cooperative members according to the “traffic-light” approach.
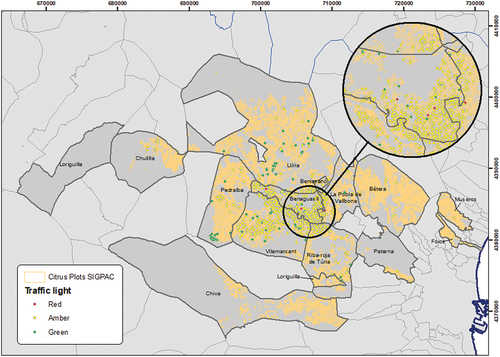
Red plots are at substantial risk of abandoning production. Conversely, green plots have ideal characteristics for ongoing productive activity. As for amber plots, most of them are at risk of abandonment and the cooperative must offer an action plan. The action can be targeted at the characteristics of each plot, but one possibility is plot grouping within a JCM initiative. The previous completion of the research objectives 2 and 3 offer the complementary data needed to identify land plots with the potential to be grouped within JCM initiatives.
5.2. Remote sensing identification and machine learning classification
5.2.1. Results of random forest
The database consists of a total of 37,340 citrus plots, from which 1,417 plots were extracted as a sample and the rest were unclassified. The 35,923 unclassified plots were associated with the values of the spectral bands and vegetation indices. Data from the 1,417 sample plots (355 abandoned, 341 not in production, 354 in production with large trees, 367 in production with small trees), along with the values of the bands and spectral indices, were used for the statistical analysis. The sample was split in two: 75% for training (1,062 plots) and the remaining 25% for model validation.
The number of decision trees used was 500, the same value as that indicated in the creation of the model. The number of variables tried at each split was two, as the number that minimises the out-of-bag (OOB) error rate. The OOB error was 13.75%, which was estimated by classifying the OOB observations that were not included in the bootstrap training data set. This indicates that the correct classification rate of the OOB observations was 85.63%. presents the confusion matrix for the model training data set and for the validation set.
Table 6. Obtained Confusion Matrix.
shows in descending order the values calculated with the MDA and MDG metrics. The most important features are those with the highest index values in the two metrics. These features are the vegetation indices (TTVI, NDVI, SAVI and EVI) and the B8 band (near infrared-NIR). The results of the area under the ROC curve (AUC) obtained from the validation set (), which indicates the specificity and sensitivity in terms of the classification of the pairs of classes. The multiclass AUC is 85.2% (very good), indicating that the specificity and sensitivity of the algorithm increases.
Figure 6. Random Forest results.
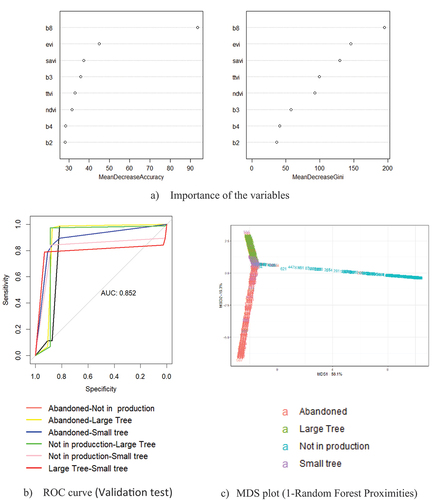
includes the MDS plot with samples. The x-axis accounts for 56.1% of the variation in the distance matrix. The y-axis only accounts for 16.3% of the variation in the matrix. That means that the big distance is along x-axis. The plots classified as abandoned plots are clearly separate from those plots are not in production, and the other categories, while there is small distance between those categories in production (large and small trees); the distance between the plots is on the y-axis. Therefore, the model has correctly separated the abandoned plots, which is the objective of this analysis.
5.2.2. Abandoned plots resulting from the predicted model
The predictive analysis applied to the citrus plots in the study area is summarised in .
Table 7. Number of plots, surface area, and percentages of classification.
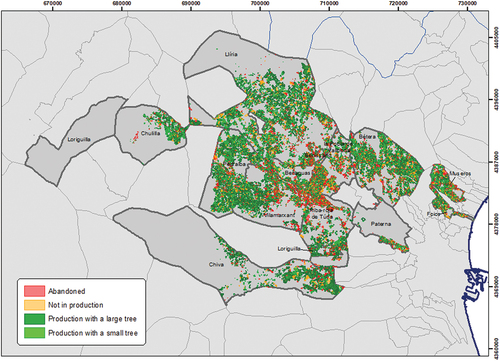
In the study area, 19% of the plots were identified as abandoned, representing 12% of the citrus area. The remaining 68% of the plots were classified as in production, of which half have large trees (full production) and half have small trees. While 10% of the plots are not in production, tillage operations have been carried out there. details the classification of plots resulting from the predicted model. The territorial distribution clearly identifies where the red plots are leading the abandonment process, causing a significant loss of production for the cooperative.
Figure 7. Map resulting from predicted model.
5.3. Priority areas for joint cropland management
The results highlight the areas with the greatest potential to form part of a JCM initiative. Specifically, attention must be paid to the south of the municipality of Benaguasil and to the north of the neighbouring Riba-roja, due to the estimated high density of plots that are not in production or abandoned. It is also the area with the greatest presence of member-owned plots allocated to the red and amber groups.
Likewise, other neighbouring areas may also be suitable for JCM initiatives, specifically in the south of the municipality of Pobla de Vallbona or in the centre of the municipality of Vilamarxant, where abandoned plots, or ones at risk of abandonment, lie alongside plots classified as ‘green’ and could potentially be grouped for joint cultivation.
A minimum viable scale for grouped cropland is essential. This scale depends on the type of crop, the location, and other factors. The panel of experts (see Objective 1) deemed 5 hectares to be a reasonable size for a productive citrus plot. This scale can be achieved by aggregating high and moderate risk (red and amber) plots with some other abandoned plots in the area. The application of our method indicates that a total of 11 JCM initiatives can be established in the area by grouping the eligible plots ().
Figure 8. Potential JCM Initiatives.
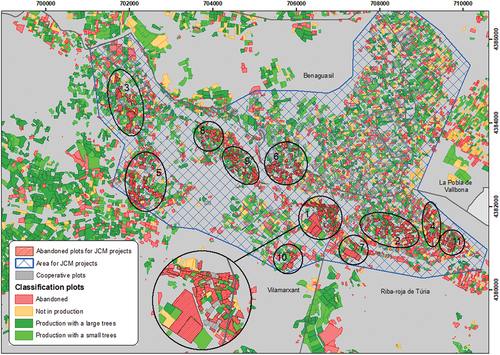
The productive characteristics of the plots to be considered for grouping are shown in . Together they would constitute an area of over 197 hectares, thanks to the combination of 647 abandoned plots with 154 plots owned by cooperative members.
Table 8. Main productive characteristics of JCM initiatives.
The final selection of JCM initiatives depends on agronomic factors (water availability, type of irrigation system, type of soil, orientation, etc.), which makes it possible to prioritise varieties, quantities and qualities that are suitable for the market at the best possible price.
6. Discussion
A socioeconomic assessment is carried out to locate plots at risk within the cooperative’s area of influence (objective 1). Abandoned areas were then identified in the operational territory, inside or outside the cooperative (objective 2). Eligible areas and prioritised areas for action were finally specified (objective 3). Our method supports data-driven decision-making to improve farm structures, which is generally advised to guide agricultural practices (Lioutas & Charatsari, Citation2020).
There is a growing need for accurate and up-to-date data and technologies (Lioutas et al., Citation2021), and our methodology deals with the lack of data and the methodology used for its efficient use. The methodology proposed offers a way to transform ‘messy’ information into visual databases to be used by agribusiness to develop JCM initiatives.
A collective approach for the recovery of abandoned plots can yield greater benefits than the partnerships between individual farmers proposed in studies such as Colombo and Perujo-Villanueva (Citation2017) and Wardhana et al. (Citation2020). Both studies advise the clustering of plots to increase farm size and exploit economies of scale, but JCM initiatives have a different configuration and involve different relationships between actors. Colombo and Perujo-Villanueva (Citation2017) report evidence of contradictions in farmers’ willingness to participate in land pooling due to different perceptions of transaction costs and expected disutility related to their loss of freedom to manage their farms. The JCM approach would help to mitigate these issues, due to three fundamental aspects:
Social capital supported by collaboration. The cooperative or aggregating association becomes a decision-making facilitator and mediating agent, which is appropriate for areas where small holdings are common (Takahashi et al., Citation2018) and do not need a change in land ownership. Furthermore, external stakeholders, such as universities, foundations, or cooperative federations, can support the process, giving it greater substance and credibility (Garcia-Alvarez-Coque et al., Citation2021). Moreover, collaboration among small landowners is guided under a common plan that fosters the modernisation of production systems and higher added-value production, which together helps to attract young people, encourage generational replacement, and improve professionalisation (Calafat-Marzal et al., Citation2022; Cervera et al., Citation2021; Piñeiro et al., Citation2021; J. Wang et al., Citation2022). While our example is based on a cooperative enterprise, our methodology does not rule out possible applications to other types of farmers’ associations.
Improved performance. The proposed methodology constitutes a practical way to optimise the business and commercial structures of agri-food cooperatives, which are at a disadvantage in situations where there is a lack of local produce due to land abandonment (Cervera et al., Citation2021; Garcia-Alvarez-Coque et al., Citation2021; Piñeiro et al., Citation2021; Tudela-Marco & Garcia-Alvarez Coque, Citation2017). The application of a ‘traffic-light’ approach incorporates social, productive, and commercial aspects in the selection of eligible plots for JCM initiatives.
Recovery of abandoned plots. Even for non-commercial purposes, the maintenance and recovery of abandoned plots has clear social, productive, and environmental consequences. At the local level, abandonment leads to change of landscape, poor plant health, soil cover deterioration and progressive damage to productive infrastructures (Arnaez et al., Citation2011; Keenleyside & Tucker, Citation2010; Lasanta et al., Citation2017; MacDonald et al., Citation2000; Ustaoglu & Collier, Citation2018). Regionally, crop abandonment is associated with increased fire risk, massive environmental degradation, and soil erosion (Arnaez et al., Citation2011; Keenleyside & Tucker, Citation2010; Lasanta et al., Citation2017; MacDonald et al., Citation2000; Ustaoglu & Collier, Citation2018).
An innovative element of this research is that it provides tools for monitoring land abandonment and transforming this problem into an opportunity, while opening the door to further applications to other crop systems. Another noteworthy aspect is the proposed methodology for the detection of abandoned plots. Although the combination of GIS techniques and machine learning-based classification (RF model) has been used in other studies for the detection of abandoned plots, our approach introduces socioeconomic characteristics that apply to areas of small agricultural holdings where property fragmentation is one of the main barriers to profitability (Colombo & Perujo-Villanueva, Citation2017; Janus, Citation2020; X. Wang et al., Citation2016). In these fragmented areas with small plot sizes, a problem affecting remote sensing is the significant influence that the plot boundaries exert on the classification, where there are no trees, giving rise to models that misclassify many plots. This difficulty has been resolved through the prior selection of representative pixels of the plots, which eliminates the influence of plot boundaries and has allowed a classification of plots with a lower error rate than in other studies under similar conditions (Abdi, Citation2020; Morell-Monzó et al., Citation2020; Thanh Noi & Kappas, Citation2017).
The methodology presented here requires professionals trained in new digital skills, which will surely attract young people and promote generational renewal in an increasingly ageing sector (Charatsari et al., Citation2022). In short, the implementation of JCM initiatives requires in-depth internal and external knowledge, but the application of our methodology provides opportunities to implement efficient productive strategies and address agricultural abandonment.
7. Conclusion
The abandonment of farmland has been a worrying phenomenon in recent years, with potentially devastating environmental effects, and equally important consequences for rural economies. Land abandonment is not an isolated event, as many other factors feed into the process; it can thus be better anticipated by improving the knowledge about social characteristics of small holders. Cooperatives and farmers’ associations can play the role of mediator and aggregator to pursue efficient and sustainable management.
This article points to innovative formulas to tackle the declining trend in cooperatives’ membership. These new strategies form part of the process of the professionalisation and digitalisation of agriculture.
The application of the proposed methodology to a specific case study of tree crops in Southern Europe demonstrates its potential for scalability to other atomised areas. Decision-making based on socioeconomic and territorial data will increasingly become a fundamental tool for cooperatives and smart farms.
The socioeconomic evaluation makes it possible to categorise plots according to the risk of abandonment by cooperatives’ members, while remote sensing and machine learning make it possible to identify abandoned plots. The combination the socioeconomic and the technological evaluation form the basis for providing valuable information aimed at reactivating uncultivated land.
The stepwise methodology presented here can be a useful tool for agri-food marketing cooperatives, with a focus on achieving economies of scale. The pilot study presented in the article represents a limitation of the results because it focuses on a single cooperative, but the application of the methodology can be equally beneficial for public administrations and policymakers in helping them to draw up sectoral strategic plans. Our case study is limited to an agricultural area with homogenous agroclimatic conditions, and it focuses on local socioeconomic characteristics as a factor driving land abandonment. However, the method could be enriched and extended to other areas where agri-environmental conditions vary significantly and become a more relevant predictor of land abandonment. The socioeconomic thresholds used to define feasibility thresholds are also worth discussing and can be further specified and adjusted in response to experts’ assessment, on a case-by-case basis. Several potential obstacles to successful collective cultivation can be also identified. They include the need for an innovative governance in agri-food cooperatives, the availability of resources for accessing new technologies and financing investments, such as new plantations, and the transaction costs incurred in the signing of lease contracts with landowners from outside and inside the cooperative.
Acknowledgments
The authors acknowledge the support received from the Universitat Politècnica de València through the research project “Young people and social and organizational innovation in areas with demographic risk” integrated in the research line “Socio-economic analysis of innovation in sustainable agri-food systems (SAS)”. We also thank the two reviewers for their suggestions to improve the paper.
Disclosure statement
No potential conflict of interest was reported by the author(s).
Notes
1. An Agricultural Work Unit (AWU) represents the work carried out by a person engaged full-time for one year in agricultural activity.
2. The mosaic of orthophotographs, covering the Valencian Community and elaborated at 25 cm resolution, is based on the digital photogrammetric flight carried out during the period from 13/05/2021 to 15/08/2021. The orthophotography is distributed by sheets 1:5.000.
3. See Copernicus website: <https://scihub.copernicus.eu/>
References
- Abdi, A.M. (2020). Land cover and land use classification performance of machine learning algorithms in a boreal landscape using Sentinel-2 data. GIScience and Remote Sensing, 57(1), 1–20. https://doi.org/10.1080/15481603.2019.1650447
- Adane, A., & Bewket, W. (2021). Effects of quality coffee production by smallholders on local land use and land cover in Yirgacheffe, southern ethiopia. Journal of Land Use Science, 16(2), 205–221. https://doi.org/10.1080/1747423X.2021.1893844
- Araya, S.N., Fryjoff-Hung, A., Anderson, A., Viers, J.H., & Ghezzehei, T.A. (2021). Advances in soil moisture retrieval from multispectral remote sensing using unoccupied aircraft systems and machine learning techniques. Hydrology and Earth System Sciences, 25(5), 2739–2758. https://doi.org/10.5194/hess-25-2739-2021
- Arnaez, J., Lasanta, T., Errea, M.P., & Ortigosa, L. (2011). Land abandonment, landscape evolution, and soil erosion in a Spanish Mediterranean mountain region: The case of Camero Viejo. Land Degradation and Development, 22(6), 537–550. https://doi.org/10.1002/LDR.1032
- Breiman, L. (2001). Random forests. Machine Learning, 45(1), 5–32. https://doi.org/10.1023/A:1010933404324
- Bürgi, M., Celio, E., Diogo, V., Hersperger, A.M., Kizos, T., Lieskovsky, J., Pazur, R., Plieninger, T., Prishchepov, A.V., & Verburg, P.H. (2022). Advancing the study of driving forces of landscape change. Journal of Land Use Science, 17(1), 540–555. https://doi.org/10.1080/1747423X.2022.2029599
- Calafat-Marzal, C., Cervera, F.J., Piñeiro, V., & Nieto-Alemán, P.A. (2022). Survey data on joint cropland management among agri-food cooperatives in Mediterranean Spanish Regions. Data in Brief, 41, 107885. https://doi.org/10.1016/J.DIB.2022.107885
- Calle, M.L., & Urrea, V. (2011). Letter to the editor: Stability of random forest importance measures. Briefings in Bioinformatics, 12(1), 86–89. https://doi.org/10.1093/bib/bbq011
- Cervera, F.J., Tudela-Marco, L., & Garcia-Alvarez Coque, J.-M. (2021). Caja de herramientas para la gestión de tierras en cooperativas agroalimentarias. Noticias de La Economía Pública, Social y Cooperativa, 67, 46–52.
- Charatsari, C., Lioutas, E.D., Papadaki-Klavdianou, A., Michailidis, A., & Partalidou, M. (2022). Farm advisors amid the transition to Agriculture 4.0: professional identity, conceptions of the future and future-specific competencies. Sociologia Ruralis, 62(2), 335–362. https://doi.org/10.1111/SORU.12364
- Colombo, S., & Perujo-Villanueva, M. (2017). Analysis of the spatial relationship between small olive farms to increase their competitiveness through cooperation. Land Use Policy, 63, 226–235. https://doi.org/10.1016/J.LANDUSEPOL.2017.01.032
- Corbelle-Rico, E., & Crecente-Maseda, R. (2014). Evaluating IRENA indicator “risk of farmland abandonment” on a low spatial scale level: The case of Galicia (Spain). Land Use Policy, 38, 9–15. https://doi.org/10.1016/J.LANDUSEPOL.2013.10.013
- Deng, X., Lian, P., Zeng, M., Xu, D., & Qi, Y. (2021). Does farmland abandonment harm agricultural productivity in hilly and mountainous areas? evidence from China. Journal of Land Use Science, 16(4), 433–449. https://doi.org/10.1080/1747423X.2021.1954707
- Garcia-Alvarez-Coque, J.M., Martinez-Gomez, V., & Tudela-Marco, L. (2021). Multi-actor arrangements for farmland management in Eastern Spain. Land Use Policy, 111, 105738. https://doi.org/10.1016/J.LANDUSEPOL.2021.105738
- Garcia-Alvarez-Coque, J.M., & Piñeiro, V. (2022). Using collective farming to improve farm structures and drive generational Renewal in spain. EuroChoices, 21(2), 35–42. https://doi.org/10.1111/1746-692X.12361
- Gibson, R., Danaher, T., Hehir, W., & Collins, L. (2020). A remote sensing approach to mapping fire severity in south-eastern Australia using sentinel 2 and random forest. Remote Sensing of Environment, 240(December 2019), 111702. https://doi.org/10.1016/j.rse.2020.111702
- Gorgan, M., & Bavorova, M. (2022). How to increase landowners’ participation in land consolidation: Evidence from North Macedonia. Land Use Policy, 123, 123. https://doi.org/10.1016/j.landusepol.2022.106424
- Haldrup, N.O. (2015). Agreement based land consolidation - in perspective of new modes of governance. Land Use Policy, 46, 163–177. https://doi.org/10.1016/j.landusepol.2015.01.027
- Hout, M.C., Papesh, M.H., & Goldinger, S.D. (2013). Multidimensional scaling. WIREs Cognitive Science, 4(1), 93–103. https://doi.org/10.1002/wcs.1203
- Huete, A.R. (1988). A soil-adjusted vegetation index (SAVI). Remote Sensing of Environment, 25(3), 295–309. https://doi.org/10.1016/0034-4257(88)90106-X
- Janus, J. (2020). A new approach to calculating distances to parcels: A way to increase the accuracy of farm efficiency analyses and the assessment of land consolidation projects. Computers and Electronics in Agriculture, 175(June), 105512. https://doi.org/10.1016/j.compag.2020.105512
- Jet, A., & O H, J. (2017). Supervised machine learning algorithms: Classification and comparison. International Journal of Computer Trends and Technology, 48(3), 128–138. https://doi.org/10.14445/22312803/IJCTT-V48P126
- Jiang, Z., Huete, A.R., Didan, K., & Miura, T. (2008). Development of a two-band enhanced vegetation index without a blue band. Remote Sensing of Environment, 112(10), 3833–3845. https://doi.org/10.1016/j.rse.2008.06.006
- Keenleyside, C., & Tucker, G. (2010). Farmland abandonment in the EU: An assessment of abandonment in the eu: an assessment of trends and prospects a report for WWF Netherlands Clunie Keenleyside and Graham Tucker with contributed data from tiffany key abandonment in the EU: An assessment of. September 2014. www.ieep.eu
- Lasanta, T., Arnáez, J., Pascual, N., Ruiz-Flaño, P., Errea, M.P., & Lana-Renault, N. (2017). Space–time process and drivers of land abandonment in Europe. Catena, 149, 810–823. https://doi.org/10.1016/j.catena.2016.02.024
- Lasanta, T., Nadal-Romero, E., & Arnáez, J. (2015). Managing abandoned farmland to control the impact of re-vegetation on the environment. The state of the art in Europe. Environmental Science and Policy, 52, 99–109. https://doi.org/10.1016/j.envsci.2015.05.012
- Levers, C., Schneider, M., Prishchepov, A.V., Estel, S., & Kuemmerle, T. (2018). Spatial variation in determinants of agricultural land abandonment in Europe. Science of the Total Environment, 644, 95–111. https://doi.org/10.1016/j.scitotenv.2018.06.326
- Li, S., & Li, X. (2017). Global understanding of farmland abandonment: A review and prospects. Journal of Geographical Sciences, 27(9), 1123–1150. https://doi.org/10.1007/s11442-017-1426-0
- Lioutas, E.D., & Charatsari, C. (2020). Big data in agriculture: Does the new oil lead to sustainability? Geoforum, 109, 1–3. https://doi.org/10.1016/J.GEOFORUM.2019.12.019
- Lioutas, E.D., Charatsari, C., & De Rosa, M. (2021). Digitalization of agriculture: A way to solve the food problem or a trolley dilemma? Technology in Society, 67, 101744. https://doi.org/10.1016/J.TECHSOC.2021.101744
- Li, X., Yang, C., Zhang, H., Wang, P., Tang, J., Tian, Y., & Zhang, Q. (2021). Identification of abandoned jujube fields using multi-temporal high-resolution imagery and machine learning. Remote Sensing, 13(4), 1–19. https://doi.org/10.3390/rs13040801
- López-Iglesias, E., Sineiro-García, F., & Lorenzana-Fernández, R. (2013). Processes of farmland abandonment: Land use change and structural adjustment in Galicia (Spain). Research in Rural Sociology and Development, 19, 91–120. https://doi.org/10.1108/S1057-1922(2013)0000019007
- MacDonald, D., Crabtree, J.R., Wiesinger, G., Dax, T., Stamou, N., Fleury, P., Gutierrez Lazpita, J., & Gibon, A. (2000). Agricultural abandonment in mountain areas of Europe: Environmental consequences and policy response. Journal of Environmental Management, 59(1), 47–69. https://doi.org/10.1006/jema.1999.0335
- Malek, Ž., Verburg, P.H., R Geijzendorffer, I., Bondeau, A., & Cramer, W. (2018). Global change effects on land management in the Mediterranean region. Global Environmental Change, 50, 238–254. https://doi.org/10.1016/j.gloenvcha.2018.04.007
- Ministerio de Agricultura y Desarrollo Rural. (2022). Censo Agrario 2022. Resultados y análisis.
- Morell-Monzó, S., Estornell, J., & Sebastiá-Frasquet, M.T. (2020). Article comparison of sentinel-2 and high-resolution imagery for mapping land abandonment in fragmented areas. Remote Sensing, 12(12), 2062. https://doi.org/10.3390/RS12122062
- Morell-Monzó, S., Sebastiá-Frasquet, M.T., & Estornell, J. (2021). Land use classification of vhr images for mapping small-sized abandoned citrus plots by using spectral and textural information. Remote Sensing, 13(4), 1–18. https://doi.org/10.3390/rs13040681
- Nembrini, S., König, I.R., Wright, M.N., & Valencia, A. (2018). The revival of the Gini importance? Bioinformatics, 34(21), 3711–3718. https://doi.org/10.1093/bioinformatics/bty373
- Pérez-Salas, J.L., Marqués, I., & Segura, B. (2012). La rentabilidad de las plantaciones de cítricos en la Comunidad Valenciana. Análisis de su evolución en el periodo 1984-2010. XIII Congreso Nacional de Ciencias Hortícolas, 141–145. http://www.sech.info/ACTAS/Acta no 60. XIII Congreso Nacional de Ciencias Hortícolas/Economía/La rentabilidad de las plantaciones de cítricos en la Comunidad Valenciana. Análisis de su evolución en el periodo 1984-2010.pdf#:~:text=No obstante estos result
- Perpiña Castillo, C., Jacobs-Crisioni, C., Diogo, V., & Lavalle, C. (2021). Modelling agricultural land abandonment in a fine spatial resolution multi-level land-use model: An application for the EU. Environmental Modelling & Software, 136(December 2020). https://doi.org/10.1016/j.envsoft.2020.104946
- Piñeiro, V., Martinez-Gomez, V., Meliá-Martí, E., & Garcia-Alvarez Coque, J.-M. (2021). Drivers of joint cropland management strategies in agri-food cooperatives. Journal of Rural Studies, 84, 162–173. https://doi.org/10.1016/J.JRURSTUD.2021.04.003
- Plieninger, T., Draux, H., Fagerholm, N., Bieling, C., Bürgi, M., Kizos, T., Kuemmerle, T., Primdahl, J., & Verburg, P.H. (2016). The driving forces of landscape change in Europe: A systematic review of the evidence. Land Use Policy, 57, 204–214. https://doi.org/10.1016/j.landusepol.2016.04.040
- Quintas-Soriano, C., Buerkert, A., & Plieninger, T. (2022). Effects of land abandonment on nature contributions to people and good quality of life components in the Mediterranean region: A review. Land Use Policy, 116, 106053. https://doi.org/10.1016/j.landusepol.2022.106053
- Recatalá, L., Ive, J.R., Baird, I.A., Hamilton, N., & Sánchez, J. (2000). Land-use planning in the Valencian Mediterranean region: Using LUPIS to generate issue relevant plans. Journal of Environmental Management, 59(3), 169–184. https://doi.org/10.1006/jema.2000.0350
- Ribal, J., Ramírez-Sanz, C., Estruch, V., Clemente, G., & Sanjuán, N. (2017). Organic versus conventional citrus. Impact assessment and variability analysis in the Comunitat Valenciana (Spain). The International Journal of Life Cycle Assessment, 22(4), 571–586. https://doi.org/10.1007/s11367-016-1048-2
- Rouse, J.W., Haas, R.H., Schell, J.A., & Deering, D.W. (1973). Monitoring the vernal advancement and retrogradation (green wave effect) of natural vegetation. Progress Report RSC 1978-1.
- Ruiz-Varona, A., García Martín, F.M., Temes-Cordovez, R., García-Mayor, C., & Casas-Villarreal, L. (2022). Harmonization of land-cover data to assess agricultural land transformation patterns in the peri-urban Spanish Mediterranean Huertas. Journal of Land Use Science, 17(1), 523–539. https://doi.org/10.1080/1747423X.2021.2022793
- Saini, R., & Ghosh, S.K. (2018). Crop classification on singled. The International Archives of the Photogrammetry, Remote Sensing and Spatial Information Sciences, XLII–5(November), 683–688. https://doi.org/10.5194/isprs-archives-XLII-5-683-2018
- Segarra, J., Buchaillot, M.L., Araus, J.L., & Kefauver, S.C. (2020). Remote sensing for precision agriculture: Sentinel-2 improved features and applications. Agronomy, 10(5), 1–18. https://doi.org/10.3390/agronomy10050641
- Takahashi, D., Chang, T., & Shobayashi, M. (2018). The role of formal and informal institutions in farmland consolidation: The case of Shiga Prefecture, Japan. International Journal of the Commons, 12(2), 80–107. https://doi.org/10.18352/ijc.829
- Terres, J.M., Scacchiafichi, L.N., Wania, A., Ambar, M., Anguiano, E., Buckwell, A., Coppola, A., Gocht, A., Källström, H.N., Pointereau, P., Strijker, D., Visek, L., Vranken, L., & Zobena, A. (2015). Farmland abandonment in Europe: Identification of drivers and indicators, and development of a composite indicator of risk. Land Use Policy, 49, 20–34. https://doi.org/10.1016/j.landusepol.2015.06.009
- Tey, Y.S., & Brindal, M. (2012). Factors influencing the adoption of precision agricultural technologies: A review for policy implications. Precision Agriculture, 13(6), 713–730. https://doi.org/10.1007/s11119-012-9273-6
- Thanh Noi, P., & Kappas, M. (2017). Comparison of random forest, k-nearest neighbor, and support vector machine classifiers for land cover classification using sentinel-2 imagery. Sensors (Basel, Switzerland), 18(2), 18. https://doi.org/10.3390/s18010018
- Thiam, A.K. (1998). Geographic information systems and remote sensing methods for assessing and monitoring land degradation in the Sahel region: The case of southern Mauritania. Book. https://doi.org/info:doi/
- Tudela-Marco, L., & Garcia-Alvarez Coque, J.-M. (2017). Innovación en la gestión de tierras bajo la fórmula cooperativa. XI Congreso de La Asociación Española de Economía Agraria Sistemas Alimentarios y Cambio Global Desde El Mediterráneo, 365–367.
- Ustaoglu, E., & Collier, M.J. (2018). Farmland abandonment in Europe Farmland abandonment in Europe: An overview of drivers, consequences, and assessment of the sustainability implications. Environmental Reviews, 26(4), 396–416. https://doi.org/10.1139/er-2018-0001
- Valenciana, G. (2020). Informe del sector agrario valenciano.
- Wang, J., CAO, Y., Fang, X., Li, G., & Cao, Y. (2022). Does land tenure fragmentation aggravate farmland abandonment? Evidence from big survey data in rural China. Journal of Rural Studies, 91, 126–135. https://doi.org/10.1016/j.jrurstud.2022.03.013
- Wang, X., Wu, X., Yan, P., Gao, W., Chen, Y., & Sui, P. (2016). Integrated analysis on economic and environmental consequences of livestock husbandry on different scale in China. Journal of Cleaner Production, 119, 1–12. https://doi.org/10.1016/j.jclepro.2016.01.084
- Wardhana, D., Ihle, R., & Heijman, W. (2020). Farmer cooperation in agro-clusters: Evidence from Indonesia. Agribusiness, 36(4), 725–750. https://doi.org/10.1002/agr.21637
- Wilson, P. (2014). Farmer characteristics associated with improved and high farm business performance. International Journal of Agricultural Management, 3(4). https://doi.org/10.22004/AG.ECON.236912
- Zhang, C., & Ma, Y., Eds. (C. Zhang & Y. MA). (2012). Ensemble machine learning. Springer New York. https://doi.org/10.1007/978-1-4419-9326-7