
ABSTRACT
Introduction
Cardiopulmonary exercise testing (CPET) quantitates and qualitates the integrated physiological response of a person to incremental exercise and provides additional information compared to static lung function tests alone.
Areas covered
This review covers rationale for the use of CPET parameters beyond the usual parameters like peak oxygen uptake and peak minute ventilation in children with respiratory disease.
Expert opinion
CPET provides a wealth of data from rest, submaximal and maximal exercise and data during recovery from exercise. In this review, an interpretative approach is described for analyzing CPET data in children with respiratory disease.
KEYWORDS:
1. Introduction
Cardiopulmonary exercise testing (CPET) quantitates and qualitates the integrated physiological response of a person to incremental exercise. In this review, we discuss the physiologic responses to exercise in children with respiratory diseases.
CPET provides additional information compared to static lung function tests alone for children with respiratory (obstructive) diseases such as cystic fibrosis (CF) [Citation1]. Static lung function tests are useful for diagnosis and management of children with respiratory diseases. However, these tests are not inclusive to measure respiratory abilities to perform exercise, which is considered as very important for the physical and psychosocial development of children.
Several studies have shown a very scattered relationship between static lung functions and exercise capacity in children with respiratory disease, indicating that static lung function indices are not able to predict exercise capacity of an individual patient [Citation2,Citation3].
2. Testing equipment and protocols
When testing children, one has to take the equipment into consideration. For small children, a small cycle ergometer is required or an exercise test can be performed on a treadmill. Treadmills do not have a height limit. Similarly, small facemasks/mouth pieces, electrocardiogram (ECG) electrodes, blood pressure cuffs, and oxygen saturation probes, as well as sensitive airflow meters, are required when testing children.
Pulse oximeters are useful in monitoring the efficacy of interventions, assessing the disease severity, and determining whether supplemental oxygen is needed during exercise in patients with respiratory diseases [Citation4,Citation5]. During exercise SpO2 can change rapidly, for this reason continuous monitoring by pulse oximetry may be desirable and new oximeters have system of enhanced signal processing algorithms and ability to reduce sensitivity to motion and variations in perfusion. It is important to note that forehead sensors have a better precision compared to finger sensors [Citation6]. Forehead sensors are less affected by motion and are less prone to measurement artifacts [Citation6]. Therefore, the forehead is the preferred site for measurement during CPET. In addition, the testing environments and personnel should be child friendly, especially when testing young children.
Testing protocols should be adapted to the ability of the subject. If the goal of CPET is to obtain a reproducible V̇O2peak, the preferred duration for a CPET is between 6 and 10 min in children and between 8 and 12 min in adolescents [Citation7,Citation8]. When testing clinical populations with low V̇O2peak values, an exercise protocol in which the work rate increases with small increments (so-called ramp protocol) is preferred. If the work rate increments are too big, the exercise test may be terminated prematurely, without actual maximally stressing the cardio-pulmonary and metabolic systems [Citation9,Citation10].
Patients with CF are able to perform a reliable CPET [Citation11]. For instance, we and others found that the V̇O2peak measured during CPET seems to reflect the ‘true’ V̇O2peak in adolescents with CF as measured using a supramaximal verification test [Citation11,Citation12]. A supramaximal verification phase after the CPET is currently recommended not to perform in the recent European Respiratory Society statement [Citation6].
As described in this article, much of the information on the respiratory response to exercise is obtained from submaximal exercise data, and not from V̇O2peak alone.
It is our opinion that adding the supramaximal verification procedures to the already demanding CPET does not add significantly to the information obtained from the CPET in children with respiratory disease.
3. Respiratory response to exercise
During exercise, there are many physiologic changes in the human body to accommodate the increase oxygen demand and increased carbon dioxide (CO2) production amongst others. When testing children with respiratory disorders, there are many respiratory variables that are important to consider in the analysis of a CPET.
First, there are several important ‘general’ CPET parameters to consider: (i) peak Heart Rate (HRpeak), this is the highest heart rate observed during an incremental exercise test (ii); Respiratory Exchange Ratio (RER), this is the ratio between V̇CO2 and V̇O2; (iii) Ventilatory Anaerobic Threshold (VAT), this is the point where anaerobic metabolism sets in during incremental exercise, (iv) Respiratory Compensation Point (RCP), this is the onset of hyperventilation (extra CO2 production for the buffering of lactate [H+] with bicarbonate) during incremental exercise; (v) Oxygen pulse, this is the ratio between oxygen uptake and heart rate and is an index of stroke volume; (vi) Maximum/Peak Oxygen Uptake (V̇O2max/V̇O2peak), this is the highest oxygen uptake during incremental exercise. Usually, this is taken over a period of 30–60 sec.
In the following paragraphs, we will address the ventilatory CPET parameters that can be of interest when evaluating a CPET performed in a child with respiratory disease.
3.1. Ventilation and ventilatory reserve
In healthy humans of all ages, the ventilatory response to exercise of up to some 10 to 20 fold greater than resting levels is achieved with remarkable precision and efficiency in terms of both CO2, O2 and pH regulation of arterial blood and economy of effort on the part of the respiratory muscles. The key primary drivers of this increased ventilation which are tightly and mysteriously linked to respiratory CO2 exchange have been narrowed to a central command, feedforward stimulus with parallel recruitment of both locomotor and respiratory muscles and a feedback stimulus involving thiny myelinated afferents from contracting locomotor muscles [Citation13].
From childhood to adolescence, specific developmental aspects occur regarding ventilation during exercise. With growth, an increase in minute ventilation (V̇E) and efficiency of V̇E increases. This change in efficiency can be explained by an increasing in tidal volume (VT), coinciding with a decreasing in breathing frequency (BF) [Citation5,Citation11].
The performance of the respiratory system during standard pediatric CPET is generally assessed by the ventilatory response to the increasing metabolic demand along with assessment of the ventilatory reserve (VR) at peak exercise. Studies have shown that highly fit subjects achieved expiratory airflows that reached their volume-specific maximum during high-intensity exercise. It was observed that highly fit endurance athletes can reach a maximum exercise ventilation that is comparable to their maximum voluntary ventilation (MVV) [Citation14]. During training, lung function does not improve in contrast to circulatory and muscular function. As a consequence, the higher fit a person becomes, increases the importance of an optimal pulmonary mechanics [Citation15].
It is generally conceived that in the steady state both alveolar ventilation and V̇E increase as a linear function of V̇CO2 (rather than V̇O2) and, consequently, PaCO2 is regulated at or very close to its resting value.
V̇E = 863 × V̇CO2/PaCO2 × (1-VD/VT)
where VD is the dead space ventilation and VD/VT is the physiological dead space fraction of a breath. Consequently, the ventilatory response to exercise is increased when PaCO2 is low or VD is high or VT is low [Citation15].
The calculation of the VR at peak exercise is used to evaluate whether ventilatory limitation affects exercise tolerance [Citation10,Citation16]. The VR at peak exercise compares the attained V̇Epeak during a CPET with the maximal capacity of the ventilatory system. The calculated MVV is a better surrogate of maximum ventilatory capacity in pediatrics than the measured MVV, as shown by significant correlation to other ventilatory parameters during CPET [Citation17]. MVV which can be estimated by multiplying forced expiratory volume in 1 s (FEV1) by a coefficient (values ranging from 30 to 40 have been proposed for children; we recommend 35 for children and 37.5 for CF) [Citation18,Citation19].
VR at peak exercise can then calculated via the following equation:
VR = 100 – ((V̇Epeak(measured)/MVV(calculated)) × 100).
where ‘VR’ is the ventilatory reserve at peak exercise (%), V̇Epeak represents the minute ventilation at peak exercise (L∙min−1), ‘MVV’ is the calculated maximal voluntary ventilation (FEV1 × 40 in L∙min−1). In healthy adolescents, VR is seldom less than 30% when tested at sea level [Citation20]. In healthy males, the VR varies and could be as low as 10–15% [Citation10]. However, it has become clear the VR tells little about the specific reason(s) for ventilatory constraint during exercise [Citation21].
In pediatric patients with respiratory disease, an association between pulmonary function (FEV1) and VR is observed (see ). Patients with an FEV1 below 70% seem to have a chance to have almost no or a negative ventilatory reserve. This is in agreement with data from young adult CF patient, where a cuff-off value of 68% of FEV1 was suggested to have a ventilatory limitation for performing exercise [Citation22].
Figure 1. The relationship between FEV1 and ventilatory reserve in pediatric CF patients. Unpublished data.
3.1.1. Tidal volume (VT)
During the initial stages of exercise, healthy subjects recruit inspiratory and expiratory reserve volumes to increase VT. Next, as exercise continues, they increase the BF. The augmented V̇E with increasing exercise intensity is caused by both an increased VT and BF. VT is increased by decreasing the inspiratory reserve volume and to a lesser extent by decreasing the expiratory reserve volume [Citation16]. This can be accomplished by increasing the flow rate at a given inspiratory time or by lengthening inspiratory time at a given flow rate [Citation17].
In children with cystic fibrosis, as the severity of diseases increases, rapid shallow of breathing is observed due to the increased work of breathing. According to the Campbell diagram, increased work of breathing leads to an increase in VT. Patients develop an adaptation to reduce the work of breathing and VT with increased minute ventilation [Citation18,Citation23]. Williams et al. also stated that there is an increase in breathing frequency to maintain gas exchange as a result of limiting the VT in pediatric CF patients [Citation19] [Citation24].
The maximal VT during exercise is usually between 50% and 60% of the resting vital capacity of a participant [Citation25]. The VT/VC ratio indicated the depth of breathing is the same or lower at submaximal exercise and lower at maximal exercise in children as compared to adults [Citation26]. VT at peak exercise depends on growth (size dependent and proportional to increase in body mass and height) with higher values seen in older children [Citation26]. During exercise, VT can increases two to five times from rest to peak exercise in children and adolescents, respectively [Citation26].
3.1.2. Breathing frequency (BF)
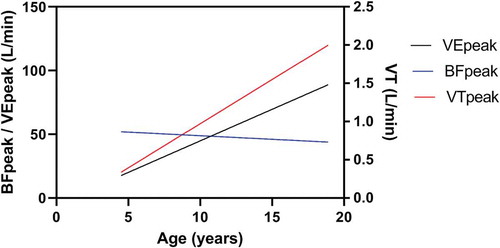
The increase in BF seen in exercise is achieved through a decrease in both inspiratory time and expiratory time [Citation27]. At exercise intensities beyond 70% to 80% of peak exercise, increases in BF are mainly accountable for further increases in V̇E [Citation20]. In pre-pubertal children, the BF at peak exercise was two to four times the resting BF and similar in boys and girls. The attained BF at peak exercise decreases with age, associated with an increase in both inspiratory time and expiratory time [Citation20]. The age-related decline in breathing frequency is compensated by an even greater increase in VT so that absolute V̇E at peak exercise increases significantly with growth [Citation23,Citation24,Citation27,Citation28]. Also in patients with CF, the age-related decline in breathing frequency and the increase in VT is observed as depicted in .
Figure 2. The V̇E, VT, and BF at peak exercise in relation to age in pediatric CF patients. Unpublished data.
Regardless of the exercise test protocol, the inflection (or plateau) in the VT response and increased BF marked the point where dyspnea intensity rises abruptly and is a transition in the dominant qualitative descriptor choice from ‘work and effort’ to ‘unsatisfied inspiration.’ Intensity and quality of dyspnea evolve separately and are strongly influenced by mechanical constraints on the increase in VT during exercise in COPD [Citation29].
3.2. Exercise flow-volume loops
Measuring the tidal exercise flow-volume loops during a CPET and plotting them within the maximal flow-volume envelope, gives more specific information on the sources (and degree) of ventilatory constraint. This includes the extent of expiratory flow limitation, inspiratory flow reserve, alterations in the regulation of end expiratory lung volume (dynamic hyperinflation), end-inspiratory lung volume relative to total lung capacity (or tidal volume/inspiratory capacity). Children have smaller lungs than adults. Due to structural properties of children’s lungs, flow-volume loops may reveal ventilatory limits during peak exercise in children. Breathing at higher lung volume eliminates expiratory flow limitation but greater work to overcome greater elastic force is needed. It can lead to ventilatory constraint and dynamic hyperinflation [Citation30,Citation31]. By assessing these types of changes, the degree of ventilatory constraint can be quantified and a more thorough interpretation of the CPET response is possible [Citation30]. One should realize, however, that in the youngest age groups measurement of FEV1 is often challenging, because most young children are unable to perform the required full forced expiration during a total second; consequently, plotting exercise-flow-volume loops is often quite challenging as well [Citation26,Citation32]. VT at peak exercise depends on growth (size dependent and proportional to increase in body mass) with higher values observed in older children [Citation27,Citation28].
Patients with chest hyperinflation (such as the children with CF) are unable to recruit significant inspiratory and expiratory reserve volumes, and therefore, maintain a relatively high respiratory rate during exercise. When these patients have to increase ventilation, they can neither increase their expiratory flow nor decrease their end expiratory lung volume. In general, patients with CF and a normal spirometry results do not exhibit expiratory flow limitation during exercise and are able to decrease end expiratory lung volume in a manner similar to healthy subjects [Citation33]. Not only does this decrease in end expiratory lung volume optimize diaphragm length but, in addition, the abdominal wall recoil following expiration aids inspiration. In contrast, patients with CF with severe lung disease exhibit expiratory flow limitation both at rest and during exercise, despite the progressive increase in end expiratory lung volume (dynamic hyperinflation) [Citation34]. An important mechanical consequence of dynamic hyperinflation is the severe restriction of VT expansion during exercise: to increase VE, the patient must rely on increasing their BF. However, as a result, this tachypnea causes further dynamic hyperinflation in a vicious cycle.
3.3. The ventilatory equivalent for oxygen uptake and carbon dioxide exhalation
The ventilatory equivalent for oxygen (V̇E/V̇O2) represents the ventilatory response to the aerobic metabolic requirements of exercise. Usually, the lowest point or the point at the VAT is taken. More specifically, it represents the average number of liters of air that a child has to ventilate in order to take up, transport, and utilize 1 l of oxygen. A higher V̇E/V̇O2 is an indication of a less efficient ventilation and can be caused by non-physiological hyperventilation, increased VD/VT, or irregular breathing [Citation35]. It has been found that ventilatory efficiency improves with age during childhood [Citation36,Citation37]. Hence, children attain higher values for the V̇E/V̇O2 than adolescents and adults.
Other ways to express this relationship is to calculate the Oxygen Uptake Efficiency Slope (OUES) using the relation between V̇O2 and the common logarithm of the V̇E [Citation38]. However, it was previously shown that the OUES is not a valid CPET parameter in children with CF [Citation39].
The fact that children ventilate more for a certain aerobic metabolic demand compared to adolescents and adults might be the result of a higher dead space ventilation and a lower PaCO2 set point, which can be estimated by the PETCO2 in children and adolescents. Higher PETCO2 values as well as higher V̇E/V̇CO2-slopes were found during exercise in children compared to adolescents [Citation36,Citation40]. The less efficient ventilation in children results in a greater oxygen cost of ventilation, which might partly explain the relatively high metabolic demands during sub-maximal exercise in children compared to adults [Citation41].
The ventilatory equivalent for carbon dioxide exhalation (V̇E/V̇CO2) represents the ventilatory response to the production of carbon dioxide during exercise. Usually, this is expressed as the slope of the relation between the V̇E and V̇CO2 (V̇E/V̇CO2-slope) or as the lowest V̇E/V̇CO2 value during a CPET.
V̇E increases linearly with V̇CO2 during CPET, even throughout the period of isocapnic buffering which is preceded by the VAT. At exercise intensities above the RCP, V̇E increases excessively due to the metabolic acidosis, resulting in the loss of linearity in the relation between V̇E and V̇CO2 [Citation42]. The RCP is usually between 60% and 90% of an individual’s V̇O2max. In a group of healthy children, Vandekerckhove et al. found that the RCP appeared at 89.3 ± 4.6 of their V̇O2max [Citation43]. In children who show an RCP during CPET, a significant lung disease is unlikely.
In children with CF, an increased ventilatory response during exercise is often observed (). This is merely observed in an increased V̇E/V̇O2 during submaximal exercise with a normal V̇E/V̇CO2 ratio during exercise [Citation44]. This pattern can be explained by an increased muscular CO2 production [Citation44]. An increased RER during (sub-)maximal exercise is frequently reported in patients with CF [Citation45,Citation46]. The higher RER in patients with CF is suggested to reflect a higher reliance on glucose oxidation and/or anaerobic glycolysis to meet energy demands during exercise [Citation29,Citation30]. The higher CO2 production might explain the ventilatory inefficiency (higher V̇E/V̇O2) in pediatric CF, with a normal ventilatory response to CO2 production (V̇E/V̇CO2).
Figure 3. The V̇E/V̇CO2 ratio in adolescents with CF and healthy subjects. Figure drawn after data from [Citation44].
![Figure 3. The V̇E/V̇CO2 ratio in adolescents with CF and healthy subjects. Figure drawn after data from [Citation44].](/cms/asset/4296cf2e-ef7d-49c6-acec-91ecdd0476a5/ierx_a_1752195_f0003_oc.jpg)
3.4. Rapid shallow breathing index (RSBI)
RSBI is a parameter that is infrequently reported in CPET, but maybe of interest when testing patients with respiratory disease (hyperinflation). RSBI is calculated by dividing breathing frequency (BF) by tidal volume (VT) [Citation47]. Patients that are hyperventilating in rest and during exercise tend to breathe rapidly (high frequency) and shallowly (low tidal volume), and have therefore a high RSBI. Rapid shallow breathing has a lower energetic cost than deep breathing but is less efficient in terms of alveolar ventilation due to the relative increase in dead space ventilation [Citation48].
The age-related decline in BF at peak exercise, accompanied by the age-related increase in VT at peak exercise results in an age-related decline of the RSBI at peak exercise.
A reduction in RSBI at peak exercise is also observed in pediatric patients with CF (See ). The result of a decrease in BF and a concomitant increase in VT.
Figure 4. The age-related decline in RSBI at peak exercise in adolescents with CF. Unpublished data.
Expiratory flow limitation is the pathophysiologic hallmark of obstructive pulmonary disease, but dyspnea (breathlessness) is its most prominent and distressing symptom [Citation27,Citation49]. Dynamic lung hyperinflation is a mechanistic consequence of expiratory flow limitation and has serious mechanical and sensory consequences of the respiratory system. It is associated with excessive loading of inspiratory muscles, and with restriction of normal VT expansion during exercise. There is a strong correlation between the intensity of dyspnea, at a standardized point during exercise, the end-expiratory lung volume, and the increased ratio of inspiratory effort to volume displacement (VT as a % of predicted VC) [Citation49].
3.5. Exercise-induced bronchoconstriction (EIB)
EIB is defined as a transient narrowing of the airways that follows vigorous physical activity or exercise [Citation50–Citation52]. EIB occurs in 70% to 90% of patients with asthma and it is present in 10% to 15% of healthy children [Citation51,Citation53–Citation58].
EIB is classified by a fall in post-exercise FEV1 of ≥10% to 15% from baseline, in very young children however, an exercise-induced decrease in FEV0.5 of 13% or greater from baseline is being used to classify EIB [Citation52]. FEV1 in young children is likely to be less reliable than FEV0.5 because most young children are unable to perform the required full forced expiration during a total second. EIB starts typically 2 to 4 min after exercise, peaking at 5 to 10-min post-exercise and disappearing spontaneously within 20 to 40 min. In some cases, it may be sustained for more than 1 h [Citation59,Citation60].
Constant intensity exercise at an intensity of 70% to 85% of V̇O2peak triggers bronchoconstriction the most. The duration of exercise is of influence in the emergence of EIB. The optimal exercise duration seems to be of 6 to 8 min to induce bronchoconstriction [Citation5].
EIB is often observed in children with respiratory diseases. It is known that bronchoconstriction is one of the features of asthma [Citation61]. Studies indicated that 40–60% of asthmatic children had EIB [Citation62,Citation63]. Park et al. also showed that asthmatic children with EIB had decreased pulmonary function after exercise [Citation64]. Joshi et al. observed that EIB was common in school-aged children who have had chronic lung disease in infancy [Citation65].
3.6. Minute ventilation to work rate ratio
The minute ventilation to work rate ratio (V̇E/WR) corresponds to the ventilatory response in relation to the WR:
V̇E/WR= (V̇E×1,000)/WR
where ‘V̇E/WR’ represents the absolute minute ventilation to work rate ratio (mL∙min−1∙W−1), ‘V̇E’ stands for the minute ventilation (L∙min−1), ‘1,000ʹ represents the multiplying factor to convert L∙min−1 to mL∙min−1, and ‘WR’ is the work rate (Watt). It represents the ventilatory demand for the generated muscle power output (work rate, exercise intensity). Godfrey et al. found a resting V̇E of roughly 10 L∙min−1 and an increase in V̇E of 9.4 L∙min−1 for each increase in work rate of 25 W in children [Citation66]. The authors underlined that children ventilated more at any work rate than adolescents; however, they reported no large differences. In healthy children, V̇E increases by 0.36 L∙min−1 for each W (Watt) increase in work rate. This results in the following equation:
V̇E/WR%pred. = (V̇E×)/(9 + (0.36 ×WR))
where ‘V̇E/WR%pred.’ stands for the ventilatory response in relation to the applied work rate (% of predicted, based on the ‘rule of nine’ by Rühle), ‘V̇E’ represents the measured minute ventilation (L∙min−1), ‘100ʹ is the multiplying factor to convert the ventilatory response in relation to the applied work rate to a percentage of predicted, ‘9ʹ represents the minute ventilation at rest, ‘0.36ʹ represents the increase in minute ventilation for each W (Watt) increase in WR (L∙min−1), and ‘WR’ represents the measured work rate (W).
In adolescents with mild-to-moderate CF, it was found that V̇E/WR ratio values were significantly higher in CF during the entire range of the CPET compared to healthy peers (see ) [Citation44]. However, this was without any apparent signs of pulmonary insufficiency [Citation44].
Figure 5. V̇E/WR relationship during exercise in pediatric CF patients compared to healthy peers. Redrawn after Bongers et al. [Citation44].
![Figure 5. V̇E/WR relationship during exercise in pediatric CF patients compared to healthy peers. Redrawn after Bongers et al. [Citation44].](/cms/asset/8947346b-3d5d-46c3-b3ae-d55e6bcd8e24/ierx_a_1752195_f0005_oc.jpg)
3.7. Saturation
Metabolic requirements increase with the intensity of work and muscles need oxygen during the increase of these requirements. If oxygen is not adequate, production of lactate increases and tissues release lactate into the plasma [Citation67]. The products of metabolism remove through circulation and oxygen transports from lung to the tissues and carried by the hemoglobin. The arterial oxygen saturation (SaO2) presents the percentage of the binding sides on hemoglobin [Citation68,Citation69]. Pulse oximetry is often used in clinical settings to provide an estimate of SaO2; the peripheral oxygen saturation (SpO2).
A ≥ 5% fall in SpO2 during CPET is defined as an exercise-induced hypoxemia [Citation6]. A fall below 85% or 80% is considered as an indication to stop an exercise test [Citation6]. Desaturation is observed in children with serious lung diseases. It is known that oxygen desaturation is seen in children with CF had decreased pulmonary function as FEV1 < 50% and DLCO<60% [Citation67]. Bader et al. also stated that decreased arterial oxygen desaturation and increased transcutaneous CO2 tension were observed in children with bronchopulmonary dysplasia (BPD) due to the pulmonary limitation to exercise, even if the V̇O2peak was the same in children with BPD as compared to healthy children [Citation67]. Santuz et al. showed that although oxygen saturation was 98% or more in BPD patients at rest, 4% or more decline occurred in oxygen saturation at peak exercise [Citation67].
3.8. Symptom perception
The modified Borg scale is the most used method in assessing a person’s rating of perceived exertion. It is a vertical scale that evaluates dyspnea and fatigue perception between 0 (nothing at all) – 10 points (very very strong). The verbal descriptions can help to choose a number describing how the body feels during exercise [Citation70]. Higher scores indicate that dyspnea and fatigue are more severe [Citation70]. This scale must be perceived by the individuals and responses to the scale change in different ages. The Borg scale can be used in children older than 9 years old because of the cognitive capacity for perceiving the exertion. It may be difficult to respond to the scales such as Borg scale in children and adolescents because Borg developed the original scale for adults [Citation70]. There are some scales specifically developed for use in children and adolescents, the OMNI scale is one of the most used scales in children [Citation71]. OMNI includes verbal and visual descriptors. It evaluates the perceived exertion between 0 (not tired at all) and 10 points (very, very tired) [Citation71].
Children with respiratory diseases such as CF have increased ventilatory demand, physical and airflow limitation, and peripheral muscle abnormalities amongst others. Due to these causes, symptoms such as dyspnea and increased fatigue perception are seen during and after exercise [Citation72]. Arikan et al. [Citation73] compared the symptom perception before and after functional capacity test between children with CF and healthy children. It was observed that children with CF had a higher dyspnea perception compared to healthy children [Citation71,Citation73]. Simsek et al. showed that perceived dyspnea and fatigue after exercise capacity test were higher in children with primary ciliary dyskinesia (PCD) than healthy peers [Citation71,Citation74]. Basso et al. [Citation75] assessed dyspnea and leg fatigue perception before and after exercise capacity testing in asthmatic children, and found that leg fatigue was higher in asthmatic children as compared to healthy children. Malo et al. also indicated that breathlessness was associated with severity of disease [Citation76].
4. Interpretation/analysis CPET
It is advised that after performing the CPET, the CPET results are written down in a clear report. Because of the wealth of CPET data, and the various reference values of each parameter, this is not always very easy to do [Citation77]. Therefore, a systematic approach is very helpful for the interpretation of CPET data. Further, the interpretation is facilitated when the person who writes the report also assisted in performing the actual CPET. He can have a clue how the subject performed and behaved during the test. A proper execution of the CPET helps in the interpretation of the CPET data.
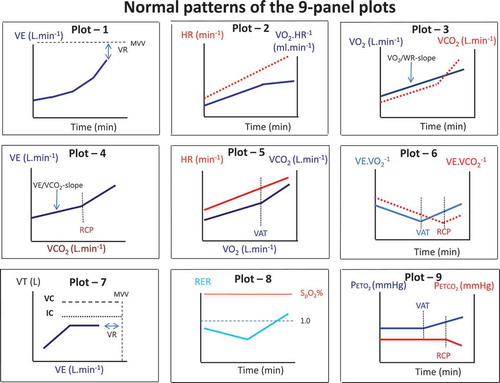
A correct interpretation of the CPET parameters requires knowledge about the normal response to exercise of these parameters. The 9-panel plot of Wasserman can help with the visual inspection of the normalcy of the exercise response [Citation78]. An example with typical responses is shown in . Normal responses of trajectories during exercise are important in this regard, because they provide the frame of reference for a normal response to exercise [Citation77]. Recently we have reviewed the most recently published CPET parameters for both children and adults [Citation79]. One should use appropriate pediatric reference values for proper interpretation of the CPET data [Citation79]. This is important since we have outlined above that children’s physiological response to exercise differs from that of adults. Growth, gender, and geographical region are important Each exercise laboratory must select an appropriate set of reference values that best reflect the characteristics of the (patient) population tested, and equipment and methodology utilized [Citation79].
Figure 6. Typical responses of CPET data.
In addition, we have developed a systematic approach for the analysis of pediatric CPET data (see ) [Citation80]. First, when a patient is referred for a CPET there should be a clear rationale for doing the test. Secondly, a check on technical and systematic errors should be done and potential errors should be reported (e.g. malfunctioning saturation probe, talking during the test, a non-steady cadence during cycling, etc.).
Figure 7. The seven-step interpretative strategy for a pediatric CPET.
Thirdly, one should check whether the patient performed a maximal effort. In children with respiratory disease, the peak heart rate is often below 195 bpm because of the ventilatory limitation. RERpeak is an important parameter to check, it should be at least 1.0 at peak exercise in children.
Fourthly, the determination of the aerobic fitness is the next step. The V̇O2peak is of great clinical relevance as it uncovers the (patho)physiological mechanisms impairing this parameter. Both V̇O2peak and V̇O2peak/kg should be considered. Patients with overweight/obesity will have a relatively better V̇O2peak and a lower V̇O2peak. Patients with a low body mass have a better V̇O2peak/kg relative to V̇O2peak. In case of a submaximal effort, conclusions concerning aerobic fitness based on V̇O2peak cannot be drawn and these CPET data should be interpreted with caution.
The fifth step is the determination of physiological limitations. The analysis of the data includes the question of which physiological limitation contributes most dominantly to exercise capacity. The potential limitations can be subdivided into respiratory responses, gas-exchange, cardiovascular responses, and muscle metabolism responses. Additionally, deconditioning should also be included as a possible exercise-limiting factor as this is often inherent to a chronic medical condition.
The sixth step is symptom perception of a child during exercise. Symptom perception is an important element that should be done when performing a CPET (See paragraph 3.8).
Seventhly, a complete and clear report including 9-panel plots (see below) is necessary to provide specific feedback and information on the conclusions and physiological findings of the test. The format of the report follows the above described steps.
Normal responses during exercise are often displayed using a graphical approach, the so-called 9-panel plots [Citation78]. In plot 1: ventilation versus time is displayed. Also from this graph, the VR can be seen since this is the difference between the V̇Epeak and MVV. In plot 2, the heart rate and oxygen pulse (= V̇O2/HR) against time are displayed. Heart rate should increase toward the predicted value (± 195 bpm in healthy children). The peak heart rate might be somewhat lower in children with a ventilatory limitation. VR might be reached before the cardiac function reaches its maximum. The oxygen pulse should increase with exercise and might plateau during sub-maximal exercise intensity. In plot 3: V̇O2 en V̇CO2 vs time are shown. V̇O2 should increase linearly with exercise intensity, while the V̇CO2 should display a breakpoint.
Near maximal exercise V̇CO2 should become higher than V̇O2. From this graph, the V̇O2/WR-slope can be calculated as well. In plot 4 ventilation vs V̇CO2 is depicted. From this graph, the V̇E/V̇CO2-slope can be calculated. An increased V̇E/V̇CO2-slope is indicative of hyperventilation and/or a ventilation perfusion mismatch. In plot 5 heart rate vs V̇O2 and V̇CO2 vs V̇O2 are depicted. Using the V-slope method, the VAT can be determined in this graph [Citation81]. Also the normalcy of the heart rate increase for exercise intensity (VO2) can be observed. In plot 6, the V̇E/V̇O2 and V̇E/V̇CO2 are depicted over time. Ventilatory efficiency as well as the VAT and RCP can be appreciated form this graph. In plot 7, the VT is displayed against ventilation. Exercise-induced bronchoconstriction can be seen in this graph as a sudden decrease in VT during exercise. Also VR can be appreciated from this graph. In plot 8 the RER and saturation are displayed over time. When exercise start, RER decreases somewhat from resting value. Usually resting RER is between 0.7 and 0.9. With increasing exercise intensity, RER is also increasing. In children, a minimal RER of 1.0 should be reached if the child does not have a ventilatory limitation. Saturation should be stable between 96% and 100% during exercise. In plot 9, the PETCO2 en PETO2 versus time is displayed. From this graph, the VAT (point where PETO2 is increasing) and RCP (point where PETCO2 is decreasing) can be appreciated. In the case of hyperventilation, PETO2 values are high, with low PETCO2 values.
Efforts to standardize CPET reports have previously been made [Citation27]. In our experience with physicians referring children for a CPET, the most important information they would like to receive is regarding the normalcy of exercise responses, whether dominant limiting physiological systems or even pathophysiological patterns can be observed, and whether their clinical question(s) can be answered. Although not all CPET parameters make sense to physicians, a comprehensive and standardized pediatric CPET report including a clear interpretation of the exercise data is indispensable to provide specific feedback about the CPET results [Citation27].
5. Conclusions and future directions
The respiratory response to exercise is very informative to study during growth and development. Many patients who are referred for exercise-induced respiratory complaints, only experience these complaints during exercise when the respiratory system is challenged. Studying the exercise response using a CPET can help to identify and quantify the limitations during exercise and evaluate/treat to minimize these limitations.
However, many of the ventilatory CPET parameters are not commonly reported in scientific publications. Moreover, parameters are calculated and reported using different methods. This impedes the comparison between studies and the establishment of a database with reference values. There is a strong call for pediatric CPET data harmonization [Citation82].
6. Expert opinion
CPET is still an underused testing modality. Many clinicians are not yet familiar with the diagnostic and prognostic possibilities of cardiopulmonary exercise testing. However, CPET is increasingly being recognized as a supplementary diagnostic and evaluative tool in the clinic. Cardiorespiratory fitness has been recognized by the American Heart Association as a vital sign [Citation83].
CPET is an important instrument to identify the causes of unexplained dyspnea on exertion or exercise intolerance in children with respiratory diseases. Many different parameters can be obtained during a CPET. More information beyond the V̇O2max and the V̇Emax can be obtained from the test. Ventilatory reserve is one of them. It is an important parameter to assess the ventilatory demands and ventilatory capacity. Children have smaller lungs compared to adults. When they breathe at higher lung volume, it requires a greater work to overcome the increased elastic force. The length–tension relationship can be impaired in children with respiratory diseases because of the dynamic hyperinflation in rest and during exercise. Correct interpretation of ventilatory responses during exercise can help to guide a respiratory and/or physical therapy treatment program.
In this review, we have described the response of many ventilatory parameters and its change during growth and development. In addition, we have provided an approach for the systematic interpretation of CPET data. However, as CPET results are influenced by age, gender, body composition, and physical activity level, ethnicity/nationality, etc., we need to address these factors in our reference values [Citation79]. We therefore need to have more and better reference values to assess the normalcy of CPET results. A lot of work is still required for this. In addition, many reference values are lacking for young children between 4 and 8 years of age. In this age group, there are many children with respiratory complaints and reference values for respiratory parameters are very welcome.
Article highlights
Cardiopulmonary exercise testing (CPET) provides a wealth of information especially regarding the respiratory response and/or limitations to exercise;
Growth and development have a significant impact on respiratory response to exercise;
CPET can help to identify the pathophysiology of unexplained dyspnea or exercise intolerance in children with respiratory diseases;
A systematic approach is advised for the analysis of CPET data.
Declaration of interest
The authors have no relevant affiliations or financial involvement with any organization or entity with a financial interest in or financial conflict with the subject matter or materials discussed in the manuscript. This includes employment, consultancies, honoraria, stock ownership or options, expert testimony, grants or patents received or pending, or royalties.
Reviewer disclosures
Peer reviewers on this manuscript have no relevant financial or other relationships to disclose.
Additional information
Funding
References
- Radtke T, Hebestreit H, Gallati S, et al. CFTR genotype and maximal exercise capacity in cystic fibrosis: a cross-sectional study. Ann Am Thorac Soc. 2018 Feb;15(2):209–216.
- Klijn P, van der Net J, Kimpen J, et al. Longitudinal determinants of peak aerobic performance in children with cystic fibrosis. Cardiopulmonary Phys Ther J. 2004;15(1):27–28.
- Orenstein DM, Nixon PA. Exercise performance and breathing patterns in cystic fibrosis: male‐female differences and influence of resting pulmonary function. Pediatr Pulmonol. 1991;10(2):101–105.
- Mengelkoch LJ, Martin D, Lawler J. A review of the principles of pulse oximetry and accuracy of pulse oximeter estimates during exercise. Phys Ther. 1994 Jan;74(1):40–49.
- Silverman MAS. Standardization of exercise tests in asthmatic children. Arch Dis Child. 1972;47:882–889.
- Radtke T, Crook S, Kaltsakas G, et al. ERS statement on standardisation of cardiopulmonary exercise testing in chronic lung diseases. Eur Respir Rev. 2019 Dec 31;28(154):180101.
- Hebestreit H. Exercise testing in children - what works, what doesn’t, and where to go? Paediatr Respir Rev. 2004;5:S11–S14.
- Takken T, Bongers B, van Brussel M, et al. Cardiopulmonary exercise testing in pediatrics. Ann Am Thorac Soc. 2017;14:S123–S128.
- Midgley AW, Bentley DJ, Luttikholt H, et al. Challenging a dogma of exercise physiology: does an incremental exercise test for valid VO 2 max determination really need to last between 8 and 12 minutes? Sports Med. 2008;38(6):441–447.
- Wasserman K, Hansen JE, Sue DY, et al. Principles of exercise testing and interpretation. Vol. 3. Philadelphia: Lippincott Williams & Wilkins; 2005.
- Saynor ZL, Barker AR, Oades PJ, et al. Reproducibility of maximal cardiopulmonary exercise testing for young cystic fibrosis patients. J Cyst Fibros. 2013 Dec;12(6):644–650.
- Werkman MS, Hulzebos HJ, van de Weert-van Leeuwen PB, et al. Supramaximal verification of peak oxygen uptake in adolescents with cystic fibrosis [Research Support, Non-U.S. Gov’t]. Pediatr Phys Ther. 2011 Spring;23(1):15–21.
- Dempsey JA, Smith CA. Pathophysiology of human ventilatory control. Eur Respir J. 2014 Aug;44(2):495–512.
- Johnson BD, Saupe KW, Dempsey JA. Mechanical constraints on exercise hyperpnea in endurance athletes. J Appl Physiol (1985). 1992 Sept;73(3):874–886.
- Whipp BJ. Ventilatory control during exercise in humans. Annu Rev Physiol. 1983;45:393–413.
- ATS/ACCP. Statement on cardiopulmonary exercise testing. Am J Respir Crit Care Med. 2005;167:211–277.
- Colwell KL, Bhatia R. Calculated versus measured MVV-surrogate marker of ventilatory capacity in pediatric CPET. Med Sci Sports Exerc. 2017 Oct;49(10):1987–1992.
- Godfrey S. The response of normal children to exercise. London: Exercise testing in children WB Saunders C; 1974. p. 68.
- Fulton JE, Pivarnik JM, Taylor WC, et al. Prediction of maximum voluntary ventilation (MVV) in African‐American adolescent girls. Pediatr Pulmonol. 1995;20(4):225–233.
- Bongers B, van Brussel M, Hulzebos H, et al. Pediatric norms for cardiopulmonary exercise testing. In relation to sex and age; 2014.
- Borel B, Leclair E, Thevenet D, et al. Mechanical ventilatory constraints during incremental exercise in healthy and cystic fibrosis children. Pediatr Pulmonol. 2014;49(3):221–229.
- Doeleman WR, Takken T, Bronsveld I, et al. Relationship between lung function and modified shuttle test performance in adult patients with cystic fibrosis: a cross-sectional, retrospective study. Physiotherapy. 2016 June;102(2):184–188.
- Hart N, Polkey MI, Clement A, et al. Changes in pulmonary mechanics with increasing disease severity in children and young adults with cystic fibrosis. Am J Respir Crit Care Med. 2002 July 1;166(1):61–66.
- Williams CA, Wedgwood KCA, Mohammadi H, et al. Cardiopulmonary responses to maximal aerobic exercise in patients with cystic fibrosis. PLoS One. 2019;14(2):e0211219.
- Jones NL, Rebuck AS. Tidal volume during exercise in patients with diffuse fibrosing alveolitis. Bull Eur Physiopathol Respir. 1979 Mar–Apr;15(2):321–328.
- Rowland T. Ventilation responses. In: Th. W. Rowland. editor. Children’s exercise physiology. Champaingn, Ill, USA: Human Kinetics2005. p. 135–147.
- Mercier J, Varray A, Ramonatxo M, et al. Influence of anthropometric characteristics on changes in maximal exercise ventilation and breathing pattern during growth in boys. Eur J Appl Physiol Occup Physiol. 1991;63(3):235–241.
- Rowland TW, Cunningham LN. Development of ventilatory responses to exercise in normal white children: a longitudinal study. Chest. 1997;111(2):327–332.
- Laveneziana P, Webb KA, Ora J, et al. Evolution of dyspnea during exercise in chronic obstructive pulmonary disease: impact of critical volume constraints. Am J Respir Crit Care Med. 2011 Dec 15;184(12):1367–1373.
- Johnson BD, Weisman IM, Zeballos RJ, et al. Emerging concepts in the evaluation of ventilatory limitation during exercise: the exercise tidal flow-volume loop. Chest J. 1999;116(2):488–503.
- Nourry C, Deruelle F, Fabre C, et al. Evidence of ventilatory constraints in healthy exercising prepubescent children. Pediatr Pulmonol. 2006 Feb;41(2):133–140.
- Gallagher C, Brown E, Younes M. Breathing pattern during maximal exercise and during submaximal exercise with hypercapnia. J Appl Physiol. 1987;63(1):238–244.
- Keochkerian D, Chlif M, Delanaud S, et al. Breathing pattern adopted by children with cystic fibrosis with mild to moderate pulmonary impairment during exercise. Respiration. 2008;75(2):170–177.
- Aliverti A, Macklem PT. How and why exercise is impaired in COPD. Respiration. 2001;68(3):229–239.
- Atsma DE. Tissue doppler imaging for detection of myocardial ischemia: are we there yet? Int J Cardiovasc Imaging. 2003 Aug;19(4):323–324.
- Cooper DM, Kaplan MR, Baumgarten L, et al. Coupling of ventilation and CO2 production during exercise in children. Pediatr Res. 1987 June;21(6):568–572.
- Giardini A, Odendaal D, Khambadkone S, et al. Physiologic decrease of ventilatory response to exercise in the second decade of life in healthy children. Am Heart J. 2011 June;161(6):1214–1219.
- Baba R, Nagashima M, Goto M, et al. Oxygen uptake efficiency slope: a new index of cardiorespiratory functional reserve derived from the relation between oxygen uptake and minute ventilation during incremental exercise. J Am Coll Cardiol. 1996 Nov 15;28(6):1567–1572.
- Bongers BC, Hulzebos EH, Arets BG, et al. Validity of the oxygen uptake efficiency slope in children with cystic fibrosis and mild-to-moderate airflow obstruction [Research Support, Non-U.S. Gov’t Validation Studies].. Pediatr Exerc Sci. 2012 Feb;24(1):129–141.
- Nagano Y, Baba R, Kuraishi K, et al. Ventilatory control during exercise in normal children. Pediatr Res. 1998 May;43(5):704–707.
- Bar-Or O, Rowland TW. Pediatric exercise medicine. from physiologic principles to health care application. Champaing (Ill): Human Kinetics; 2004.
- Milani RV, Lavie CJ, Mehra MR, et al. Understanding the basics of cardiopulmonary exercise testing. Mayo Clin Proc. 2006 Dec;81(12):1603–1611.
- Vandekerckhove K, Coomans I, Moerman A, et al. Characterizing cerebral and locomotor muscle oxygenation to incremental ramp exercise in healthy children: relationship with pulmonary gas exchange. Eur J Appl Physiol. 2016 Dec;116(11–12):2345–2355.
- Bongers BC, Werkman MS, Takken T, et al. Ventilatory response to exercise in adolescents with cystic fibrosis and mild-to-moderate airway obstruction. Springerplus. 2014;3:696.
- Nguyen T, Obeid J, Baker JM, et al. Reduced fat oxidation rates during submaximal exercise in boys with cystic fibrosis. J Cyst Fibros. 2014 Jan;13(1):92–98.
- Hebestreit H, Hebestreit A, Trusen A, et al. Oxygen uptake kinetics are slowed in cystic fibrosis. Med Sci Sports Exerc. 2005 Jan;37(1):10–17.
- Karthika M, Al Enezi FA, Pillai LV, et al. Rapid shallow breathing index. Ann Thorac Med. 2016 July–Sept;11(3):167–176.
- Younes M, Burks J. Breathing pattern during and after exercise of different intensities. J Appl Physiol (1985). 1985 Sept;59(3):898–908.
- O’Donnell DE. Hyperinflation, dyspnea, and exercise intolerance in chronic obstructive pulmonary disease. Proc Am Thorac Soc. 2006 Apr;3(2):180–184.
- Akinbami L, Schoendorg KC. Trends in childhood asthma: prevalence, health care utilization, and mortality. Pediatrics. 2002;110:315–322.
- Joyner BL, Fiorino EK, Matta-Arroyo E, et al. Cardiopulmonary exercise testing in children and adolescents with asthma who report symptoms of exercise-induced bronchoconstriction. J Asthma. 2006;43:675–678.
- van Leeuwen J, Driessen J, de Jongh F, et al. Measuring breakthrough exercise-induced bronchoconstriction in young asthmatic children using a jumping castle. J Allergy Clin Immunol. 2013;131:1427–1428.
- Bardagi S, Agudo A, Gonzalez C, et al. Prevalence of exercise-induced airway narrowing in schoolchildren from a Mediterranean town. Amer Rev Respir Dis. 1993;147:1112.
- Frischer T, Meinert R, Karmaus W, et al. Relationship between atopy and frequent bronchial response to exercise in school children. Pediatr Pulmonol. 1994;17(5):320–325.
- Haby M, Anderson S, Peat J, et al. An exercise challenge protocol for epidemiological studies of asthma in children: comparison with histamine challenge. Eur Respir J. 1994;7(1):43–49.
- LaRussa J, Wang-Dohlman A, Bartolucci AA. Screening adolescent athletes for exercise-induced asthma. LWW. Clin J Sport Med. 1996;6: 119–123.
- Rupp NT, Guill MF, Brudno DS. Unrecognized exercise-induced bronchospasm in adolescent athletes. Am J Dis Children. 1992;146(8):941–944.
- Milgrom H, Taussig L. Keeping children with exercise-induced asthma active. Pediatrics. 1999;104:e38.
- Bar-Or O, Rowland T. Pulmonary diseases. In: O. Bar-Or and T.W. Rowland, editors. Pediatric exercise medicine. From physiologic principles to health care application. USA: Human Kinetics; 2004. p. 139–175.
- Godfrey S, Springer C, Noviski N, et al. Exercise but not methacholine differentiates asthma from chronic lung disease in children. Thorax. 1991;46:488–492.
- de Aguiar KB, Anzolin M, Zhang L. Global prevalence of exercise-induced bronchoconstriction in childhood: a meta-analysis. Pediatr Pulmonol. 2018 Apr;53(4):412–425.
- Lodrup Carlsen KC, Haland G, Devulapalli CS, et al. Asthma in every fifth child in Oslo, Norway: a 10-year follow up of a birth cohort study. Allergy. 2006 Apr;61(4):454–460.
- Vilozni D, Bentur L, Efrati O, et al. Exercise challenge test in 3- to 6-year-old asthmatic children. Chest. 2007 Aug;132(2):497–503.
- Park HK, Jung JW, Cho SH, et al. What makes a difference in exercise-induced bronchoconstriction: an 8 year retrospective analysis. PLoS One. 2014;9(1):e87155.
- Joshi S, Powell T, Watkins WJ, et al. Exercise-induced bronchoconstriction in school-aged children who had chronic lung disease in infancy. J Pediatr. 2013 Apr;162(4):813–818 e1.
- Godfrey S, Davies CT, Wozniak E, et al. Cardio-respiratory response to exercise in normal children. Clin Sci. 1971 May;40(5):419–431.
- Moxnes JF, Sandbakk O. The kinetics of lactate production and removal during whole-body exercise. Theor Biol Med Model. 2012 Mar 13;9:7.
- Burtscher M. Exercise limitations by the oxygen delivery and utilization systems in aging and disease: coordinated adaptation and deadaptation of the lung-heart muscle axis - a mini-review. Gerontology. 2013;59(4):289–296.
- Collins JA, Rudenski A, Gibson J, et al. Relating oxygen partial pressure, saturation and content: the haemoglobin-oxygen dissociation curve. Breathe (Sheff). 2015 Sept;11(3):194–201.
- Borg GA. Psychophysical bases of perceived exertion. Med Sci Sports Exerc. 1982;14(5):377–381.
- Robertson RJ, Goss FL, Boer NF, et al. Children’s OMNI scale of perceived exertion: mixed gender and race validation. Med Sci Sports Exerc. 2000 Feb;32(2):452–458.
- Gibson RL, Burns JL, Ramsey BW. Pathophysiology and management of pulmonary infections in cystic fibrosis. Am J Respir Crit Care Med. 2003 Oct 15;168(8):918–951.
- Arikan H, Yatar I, Calik-Kutukcu E, et al. A comparison of respiratory and peripheral muscle strength, functional exercise capacity, activities of daily living and physical fitness in patients with cystic fibrosis and healthy subjects. Res Dev Disabil. 2015;45–46:147–156.
- Simsek S, Inal-Ince D, Cakmak A, et al. Reduced anaerobic and aerobic performance in children with primary ciliary dyskinesia. Eur J Pediatr. 2018 May;177(5):765–773.
- Basso RP, Jamami M, Pessoa BV, et al. Assessment of exercise capacity among asthmatic and healthy adolescents. Rev Bras Fisioter. 2010 May–June;14(3):252–258.
- Male I, Richter H, Seddon P. Children’s perception of breathlessness in acute asthma. Arch Dis Child. 2000 Oct;83(4):325–329.
- Paap D, Takken T. Reference values for cardiopulmonary exercise testing in healthy adults: a systematic review. Expert Rev Cardiovasc Ther. 2014 Dec;12(12):1439–1453.
- Dumitrescu D, Rosenkranz S. Graphical data display for clinical cardiopulmonary exercise testing. Ann Am Thorac Soc. 2017 July;14(Supplement_1):S12–S21.
- Takken T, Mylius CF, Paap D, et al. Reference values for cardiopulmonary exercise testing in healthy subjects - an updated systematic review. Expert Rev Cardiovasc Ther. 2019 June;17(6):413–426.
- Van Brussel M, Bongers BC, Hulzebos EHJ, et al. A Systematic Approach to Interpreting the Cardiopulmonary Exercise Test in Pediatrics. Pediatr Exeric Sci. 2019 May 1;31(2):194–203.
- Beaver WL, Wasserman K, Whipp BJ. A new method for detecting anaerobic threshold by gas exchange. J Appl Physiol (1985). 1986 June;60(6):2020–2027.
- Ashish N, Bamman MM, Cerny FJ, et al. The clinical translation gap in child health exercise research: a call for disruptive innovation. Clin Transl Sci. 2015 Feb;8(1):67–76.
- Ross R, Blair SN, Arena R, et al. Importance of assessing cardiorespiratory fitness in clinical practice: a case for fitness as a clinical vital sign: a scientific statement from the American heart association. Circulation. 2016 Dec 13;134(24):e653–e699.