
ABSTRACT
Background
Several methods exist to reduce the number of arterial blood gases (ABGs). One method, Roche v-TAC, has been evaluated in different patient groups. This paper aggregates data from these studies, in different patient categories using common analysis criteria.
Research design and methods
We included studies evaluating v-TAC based on paired arterial and peripheral venous blood samples. Bland-Altman analysis compared measured and calculated arterial values of pH, PCO2, and PO2. Subgroup analyses were performed for normal, chronic hypercapnia and chronic base excess, acute hyper- and hypocapnia, and acute and chronic base deficits.
Results
811 samples from 12 studies were included. Bias and limits of agreement for measured and calculated values: pH 0.001 (−0.029 to 0.031), PCO2 −0.08 (−0.65 to 0.49) kPa, and PO2 0.04 (−1.71 to 1.78) kPa, with similar values for all sub-group analyses.
Conclusion
These data suggest that v-TAC analysis may have a role in replacing ABGs, avoiding arterial puncture. Substantial data exist in patients with chronic hypercapnia and chronic base excess, acute hyper- and hypocapnia, and in patients with relatively normal acid−base status, with similar bias and precision across groups and across study data. Limited data exist for patients with acute and chronic base deficits.
1. Introduction
Arterial blood gases (ABGs) are considered the reference method for the assessment of acid−base status. Arterial punctures are, however, associated with complications such as hematoma and pain [Citation1–4]. Currently, ABGs are most widely used in pulmonary, emergency, and intensive care (ICU) departments. For patients without indwelling arterial catheters, the majority of ABGs are from arterial punctures. They are used to evaluate acute exacerbations of chronic obstructive pulmonary disease (COPD), to titrate noninvasive ventilation (NIV) or long-term oxygen therapy (LTOT), or to evaluate other gas exchange or metabolic disturbances [Citation5]. Guidelines related to the initiation or maintenance of NIV rely on arterial values of pH and PCO2 [Citation6,Citation7], requiring repeated measurements, and therefore painful ABG punctures up to multiple times a day. In addition, current practice suggests that ABGs are at times drawn unnecessarily [Citation3,Citation8], with a recent study showing one-third of arterial samples are unsuccessful in the first attempt, compared to the success rates for venous samples of almost 90% [Citation9].
Several methods have been suggested to reduce the number of ABGs. These include replacing ABGs with venous blood gases analyses [Citation10] and using mathematical models to calculate ABG values from venous measurements [Citation11–14]. These models are often based on statistical correlations [Citation11,Citation13,Citation14] derived from specific patient populations, limiting their generalizability. The method by Rees et al. [Citation12] was developed using physiology-based mathematical models which transform venous blood gas values into calculated arterial values (commercially called Roche v-TAC™). This method has been evaluated in numerous patient populations [Citation9,Citation15–25] and could therefore allow clinicians to interpret arterial values of acid−base and oxygenation status using a peripheral venous sample and without the discomfort or side-effects of arterial puncture, potentially replacing ABGs with arterialized values calculated by v-TAC.
v-TAC has been validated multiple times over the past 15 years in different centers, patient groups, and using different criteria for evaluating the validity of the measured data. If this method is to be used routinely in clinical practice, it is important to understand the breadth and quality of evidence. The aim of this paper is to aggregate data from all validation studies, reporting the level of agreement between v-TAC and measured ABG values in different patient groups, using common criteria for analysis.
2. Patients and methods
This paper includes data from all available previous studies that have evaluated the use of v-TAC against concurrent ABG values. The study design was conducted with reference to the PRISMA 2020 checklist [Citation26] without registration. Studies were identified by searching for publications citing the v-TAC method, starting from the first publication of the method by Rees et al. 2006 [Citation12] up to June 2023, and following up with the citation lists of each of the relevant and eligible studies included in this paper. In addition, relevant scientific databases were searched for publications using the search term ‘v-TAC.’ Studies were included if the aim was an evaluation of the physiology-based transformation of venous blood gas values to arterialized equivalents using the v-TAC method, where comparison was based on paired arterial and peripheral venous blood samples and had at least 15 sample pairs. The corresponding authors of the respective papers were contacted and requested to share their original datasets prior to the exclusion of data, if any. All authors responded and contributed to their data.
2.1. V-TAC
The v-TAC method calculates arterialized values of venous blood, using mathematical models to simulate the transport of venous blood back through the tissues until a calculated arterial oxygenation matches that measured by pulse oximetry (SpO2) [Citation12,Citation27]. In this simulation, oxygen is added to, and carbon dioxide removed from, venous blood using a constant value of the respiratory quotient selected to be 0.82 to represent an average aerobic metabolism. In addition, the model assumes no strong acid is added or removed from the blood on its simulated passage from the veins to the arteries. Further details of the method are described in the online supplementary material.
2.2. Data handing
All sample pairs from the studies were collected, including samples originally excluded from analysis using different criteria in each individual study. These were then evaluated using common inclusion and exclusion criteria, as detailed below, to prevent analysis bias from individual studies. v-TAC conversions were performed for each venous sample, calculating arterialized values of acid−base and oxygenation status. We used the commercially available v-TAC software for analysis (Roche v-TAC, Roche Diagnostics International, Switzerland).
2.3. Sample eligibility criteria
Comparing two methods for the estimation of acid−base status, requires the elimination of any factors that might affect any of the measurements in question. In this case, the elimination of erroneous sampling may affect both the arterial and the venous measurements, clouding a true comparison of the results. Therefore, eligibility criteria are based on pairs of arterial and venous samples. Sample pairs were included if there were a full set of arterial and venous acid−base and oxygenation values (pH, PCO2, PO2, sO2), arterial and venous hemoglobin (Hb), and SpO2 readings. Samples were only included if technical or analytical errors were not present. These were identified as arterial to venous Hb differences, (i.e. Hb (a-v) > 1 mmol/l indicative of sample sedimentation) and SpO2 – SaO2 ≥15% indicative of venous contamination of the arterial blood sample.
In keeping with prior publication [Citation9], rules were applied to exclude clearly erroneous samples related to physiological implausibility (e.g. an attempted arterial sample that was, in hindsight, a mixed arterial-venous sample). These samples were identified where the difference in pH (a-v) ≥ 0.09 or PCO2(v-a) >2.5 kPa [Citation9]. In addition, although it is physiologically implausible for pH (a-v), PCO2 (v-a), or PO2 (a-v) to be less than zero, values were only excluded if pH (a-v) ≤ −0.01, PCO2 (v-a) ≤ −0.2 kPa, or PO2 (a-v) ≤ −0.2 kPa so as to account for the noise due to possible analytical errors.
In addition to this, the commercially available v-TAC software performs input and output checks on data validity: input values were excluded if they were outside the analyzer’s range of analysis, SpO2 <80%, SpO2 < SvO2 − 4%, v-TAC calculated base excess greater than + 20 or less than −20 mmol/L, v-TAC calculated 2,3-diphosphoglyceric acid (DPG) outside the physiologically plausible range (1–12 mmol/L).
2.4. Statistical analysis
Agreement between v-TAC values of pH, PCO2, PO2, and the corresponding measured arterial values were evaluated using Bland-Altman analysis, expressed as the mean systematic difference (bias) and 95% limits of agreement (LoA). An output feature of v-TAC is that all calculated PO2 values above 10 kPa are reported as ‘greater than 10 kPa’ and these datapoints were set to PO2vtac = 10 kPa for further analysis. Since the v-TAC output for PO2 is limited to 10 kPa, the x-axis on the Bland-Altman plot for PO2 was also limited.
In addition, data were divided into subgroups for further analysis. As the diagnostic criteria for each patient could vary based on the different centers and over time, we chose to analyze each sample pair based solely on their acid−base status. For this, arterial pH and PCO2 were plotted on the Siggaard-Andersen acid−base chart [Citation28], and depending on the location of the points on the chart, these were classified as ‘Normal,’ ‘Chronic hypercapnia and chronic base excess,’ ‘Acute hyper and hypocapnia,’ and ‘Acute and chronic base deficit.’ Classifications are visualized in where colored boxes are illustrated to define the subgroups, along with the predefined black circle for normal values. In the subgroups, arterialized values of pH, PCO2, and PO2 were compared to the corresponding measured arterial values, reporting systematic difference and 95% LoA.
3. Results
For this review, we identified 12 studies, details summarized in , with a total number of 987 samples available for inclusion. From the available sample pairs, 908 were included for analysis. In addition to the exclusions described earlier in the paper (n = 88), v-TAC in- and output checks (n = 9) were applied. The total number of samples analyzed following these combined criteria amounted to 811, with details on sample eligibility summarized in .
Figure 1. Flowchart describing data selected for analysis based on various inclusion and exclusion criteria. *not mutually exclusive.
Table 1. Summary of the publications that have evaluated the use of v-TAC to transform venous acid−base and oxygenation status to arterialized equivalents.
displays arterial values of pH and PCO2 plotted on the Siggaard-Andersen acid−base chart divided into subgroups: ‘Normal’ (black, n = 191), ‘Chronic hypercapnia and chronic base excess’ (blue, n = 430), ‘Acute hyper- and hypocapnia’ (green, n = 151), and ‘Acute and chronic base deficit’ (red, n = 39). illustrates the Bland-Altman comparisons of arterial and v-TAC converted values of pH, PCO2, and PO2 colored for each subgroup (Bias and LoAs for individual subgroups are described in ). Separate Bland-Altman plots for the individual subgroups are available in the ESM. In addition, Figure S2 (in the supplementary material) replots the Bland-Altman plots of , color coding the samples outside LoA, per the included study.
Figure 2. Siggaard-Andersen acid−base chart depicting the different subgroups analyzed in this paper, along with the Bland-Altman plots for the entire dataset color-coded for the different subgroups. a) Arterial blood pH and PCO2 plotted on the Siggaard-Andersen acid−base chart and divided into subgroups based on their location. Black represents the ‘Normal’ group; Blue represents the ‘Chronic hypercapnia and chronic base excess’ group; Green represents the ‘acute hyper- and hypocapnia’ group; and Red represents the group with ‘acute and chronic base deficit.’ n = 811. The vertical panel depicts Bland-Altman plots for pH (b), PCO2; (c) and PO2; (d; n = 475) comparing v-TAC values to the corresponding measured arterial values for the entire dataset, where the datapoints are colored to represent the subgroups defined using the Siggaard-Andersen chart. Bias (solid lines) and limits of agreement (LoA; dotted lines) are shown, with the confidence intervals on the LoAs shown as a shaded area around each dotted line. Exact values are found in . Note: for clarity, one sample point on the PO2 plot (d) where PaO2 was 23.3 kPa and PO2 vtac was 9.4 kPa was not plotted, to allow for better visualization of the remainder of the data. Background chart © Siggaard-Andersen O. Scand. J. Clin. Lab. Invest. 1971; 27: 239, Radiometer Medical ApS. All rights reserved. Used with permission.
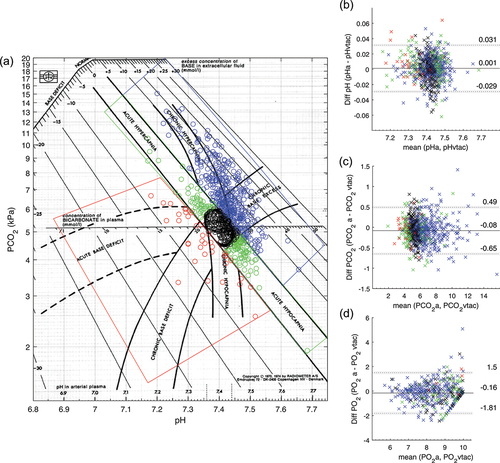
Table 2. Comparison of the v-TAC converted values with the measured arterial values of pH, PCO2, and PO2 for the population as a whole and detailed within each subgroup defined based on the Siggaard-Andersen acid−base chart. Bias (Limits of Agreement) calculated from the Bland-Altman plots are reported for pH, PCO2, and PO2. For comparison of PO2, only samples with PO2vtac ≤10 kPa were included in the analysis. Individual Bland-Altman plots were included in the electronic supplementary material.
4. Discussion
This work aggregates data from publications related to v-TAC over the past 15 years across different medical centers and patient groups and is the first publication providing a review or meta-analysis of the v-TAC method. The major result of this work is to highlight that the accuracy and precision of v-TAC are similar across the data as a whole, across time, and across clinical subgroups. This is despite the large heterogeneity across patient groups in the studies included, from those with acute respiratory complications, to patients with chronic acid−base problems with substantial compensation. It has been appropriate to use common inclusion and exclusion criteria when combining and analyzing data. When doing so, it is encouraging that the bias and LoA obtained here across all patients are similar to the individually published studies, with little effect, for example, of sampling times between arterial and venous blood in the individual studies. The fact that results are similar over a period of 15 years illustrates the robust nature of physiological approaches of venous to arterial conversions.
Similar results were found in the groups classified into chronic hypercapnia and chronic base excess, acute hyper- and hypocapnia, acute and chronic base deficit, and normal (Bland-Altman plots in ESM). The greatest weight of evidence from this analysis is in the chronic hypercapnia and chronic base excess group. While these results are a reflection of the studies included in this paper, it also corresponds to the high frequency of ABGs taken in this group of patients using arterial punctures. Those with chronic hypercapnia, and some with chronic base excess, are likely to be suffering from COPD, where treatment with NIV or other forms of assisted ventilation are common clinical practice. Initiating treatment or adjusting the NIV settings and daily monitoring require ABGs, especially since treatment guidelines are based on arterial values only [Citation6,Citation29]. The narrow confidence intervals over the LoAs of the Bland-Altman plots for this subgroup (ESM) provide an indication that clinically useful levels of accuracy and precision can be obtained if v-TAC is used when monitoring patients who present with this common clinical scenario.
Substantial evidence also exists for those with acute respiratory changes and in those with relatively normal acid−base status, typical of emergency medicine. In contrast, for those presenting with very low pH values or metabolic acidosis, evidence for the use of v-TAC is limited, although it appears that results are similar to other groups. However, in such cases, as well as in severe hypoxia, results should be interpreted with care until further evidence is obtained. Interestingly, these patients are often those presenting in the ICU with indwelling arterial catheters and as such, problems with arterial puncture are limited.
There are several potential uses of the method. In departments of emergency medicine, sampling of venous blood is frequent, and conversion to arterial values could be used to screen for respiratory abnormalities. In departments of pulmonary medicine, the method might be useful in the evaluation of outpatients, for daily analysis of acid−base status prior to morning rounds, for monitoring of exacerbation status, and for evaluation of the need and application of NIV. The method might also be useful in patients recovering from critical illness, where cardiovascular status is such that indwelling arterial catheters are no longer required. In all situations, sampling of venous blood is relatively easy, with limited pain, and can be performed by nurses along with recording of pulse oximeter SpO2. Application in the most severely ill critical care patients, who often have indwelling arterial catheters, may not be appropriate, particularly in situations where oxygenation is challenging and accurate values of PO2 are required. To understand the potential clinical use of the v-TAC method, it is important to understand the situations where the difference between v-TAC and arterial samples is clinically significant. These were defined as the 52 sample points where differences in calculated and measured arterial pH or PCO2 were greater than 0.03 or 0.5 kPa, respectively. Figure S2 in the supplementary material replots the BA plots of , color coding the outliers per study. There are three possible explanations for these outliers: measurement error in any of the blood gases; poor estimation of arterial values; and physiological changes that act upon arterial and venous samples differently. Measurement error is not insignificant. It has previously been shown that rapidly taken repeated arterial samples can vary as much as 0.3 kPa in PCO2 [Citation30], a significant fraction of the 0.5 kPa used here as a cutoff value. Errors in the v-TAC method may be due to the appropriateness of assumptions, including that there is no transport of strong acid or base across the venous to the arterial sampling site. All of these studies document sampling from a warm well-perfused extremity and as such, we do not expect there to be significant anaerobic metabolism. Physiological changes that act upon arterial and venous samples differently may be important. It has recently been shown that short, transient, ventilatory changes over periods of 30s result in acid−base changes in arterial and not peripheral venous blood, altering arterial PCO2 by as much as 0.5 kPa [Citation25,Citation30], and suggesting that v-TAC values may provide a more stable representation of arterial status than measured ABG values in patients with unstable ventilation [Citation30]. Forty-two percent of outliers (Figure S2, ESM) were from two studies [Citation19], where patients were either on or being evaluated for NIV and therefore prone to unstable ventilation. In addition, 24% of the 50 outliers come from subgroup B of the study [Citation17] which included a systematic delay in the sampling time between venous and arterial measures (Figure S2, ESM), meaning that physiological changes may occur between samples. Taken together, outliers in patient groups in NIV studies [Citation19] and those with systematic delay [Citation17], account for 34 of the 50 outliers, with the remaining 16 representing only 2% of the data set as a whole.
4.1. Limitations
The major limitation of the method is that the exact value of PO2 above 10 kPa is not reported by v-TAC. This is the effect of using the oxygen dissociation curve in the modeling of v-TAC. For values of saturation > 97%, the flat shape of the curve does not allow the calculation of accurate values of PO2 and indeed, errors in the calculation of PO2 increase with higher absolute levels as seen in . Although a value of PO2 above 10 kPa confirms the lack of hypoxia, it did lead to a loss of sample pairs used to analyze the agreement of PO2. In addition, it limits the use of the method to detect hyperoxemia which may be present in patients receiving supplementary oxygen.
Common exclusion criteria have been applied to ensure a correct comparison between calculated and measured arterial values. The inclusion of erroneous data would provide an incorrect description of the usefulness of the method. To avoid this, we have used a single set of exclusion criteria applied across all studies to ensure high-quality paired arterial and venous samples, necessary for the correct evaluation of the method. Exclusion accounts for the potential impact of unstable ventilation, as described in the post-hoc analysis of Davies et al. [Citation9], this being justified according to the known variation of arterial gas values on transient changes in ventilation [Citation25,Citation30]. It is important that the need for high-quality data for scientific comparison is not confused with the known effects of poor sampling in clinical practice. Poor sampling will inevitably lead to erroneous interpretation, whether performed from venous, v-TAC converted venous, or arterial blood samples.
5. Conclusions
v-TAC has been evaluated by different groups, in different countries, multiple hospitals, multiple patient groups, and different setups (analyzers and protocols). Substantial data exist describing its evaluation in patients with chronic hypercapnia, acute hyper- and hypocapnia, and in patients with relatively normal acid−base status, with similar bias and precision across these groups and across study data. Limited data exist for patients with acute and chronic base deficit and severe hypoxemia. In total, these data suggest a role for peripheral venous sampling and v-TAC in replacing ABG performed by arterial puncture.
Points for clinical practice and questions for future research
The v-TAC method can be used for assessing acid−base status in a broad selection of patients.
Using peripheral venous blood and v-TAC, arterial sampling may be avoided in several patients in emergency and pulmonary departments.
Future research may investigate clinical decisions based on v-TAC, for example, NIV titration.
Declaration of interest
The institution of L Shastri, L Thomsen, S Andreassen, and S Rees have received research grants for two PhD projects within the field of blood gas testing but not related to the current work. S Andreassen and S Rees have previously had financial involvement in a company that owned the rights to the method presented; however, this has not been true since early 2020. The authors have no other relevant affiliations or financial involvement with any organization or entity with a financial interest in or financial conflict with the subject matter or materials discussed in the manuscript apart from those disclosed.
Reviewer disclosures
Peer reviewers on this manuscript have no relevant financial or other relationships to disclose.
Author contributions
L Shastri, LP Thomsen, and SE Rees conceived and designed the study, which was discussed with all authors. Analysis and interpretation of data were performed by L Shastri, LP Thomsen, and SE Rees. All authors were involved in drafting or revising the paper, and all authors agreed to be accountable for all aspects of the work.
vtac_combined_data_2024_suplementary.docx
Download MS Word (3.3 MB)Supplementary material
Supplemental data for this article can be accessed online at https://doi.org/10.1080/17476348.2024.2378021
Additional information
Funding
References
- Matheson L, Stephenson M, Huber B. Reducing pain associated with arterial punctures for blood gas analysis. Pain Manag Nurs. 2014;15(3):619–624. doi: 10.1016/j.pmn.2013.06.001
- Giner J, Casan P, Belda J, et al. Pain during arterial puncture. Chest. 1996;110(6):1443–1445. doi: 10.1378/chest.110.6.1443
- Muakkassa F, Rutledge R, Fakhry S, et al. ABGs and arterial lines: the relationship to unnecessarily drawn arterial blood gas samples. The J Trauma Inj Infect Crit Care. 1990;30(9):1087–1095. doi: 10.1097/00005373-199009000-00004
- Skiendzielewski J. Arterial puncture complications. JACEP. 1977;6(8):382–383. doi: 10.1016/S0361-1124(77)80181-0
- Raffin TA. Indications for arterial blood gas analysis. Ann Intern Med. 1986;105(3):390. doi: 10.7326/0003-4819-105-3-390
- Celli BR, Macnee W, Agusti A, et al. Standards for the diagnosis and treatment of patients with COPD: a summary of the ATS/ERS position paper. Eur Respir J. 2004;23(6):932–946. doi: 10.1183/09031936.04.00014304
- Davidson C, Banham S, Elliot M, et al. BTS/ICS guidelines for the ventilatory management of acute hypercapnic respiratory failure in adults. Thorax. 2016;71(Suppl 2):ii1–ii35. doi: 10.1136/thoraxjnl-2015-208209
- DellaVolpe JD, Chakraborti C, Cerreta K, et al. Effects of implementing a protocol for arterial blood gas use on ordering practices and diagnostic yield. Healthcare. 2014;2(2):130–135. doi: 10.1016/j.hjdsi.2013.09.006
- Davies MG, Wozniak DR, Quinnell TG, et al. Comparison of mathematically arterialised venous blood gas sampling with arterial, capillary, and venous sampling in adult patients with hypercapnic respiratory failure: a single-centre longitudinal cohort study. BMJ Open Respir Res. 2023;10(1):e001537. doi: 10.1136/bmjresp-2022-001537
- Kelly AM. Can venous blood gas analysis replace arterial in emergency medical care. Emerg Med Australasia. 2010;22(6):493–498. doi: 10.1111/j.1742-6723.2010.01344.x
- Chu Y, Chen C, Lee C, et al. Prediction of arterial blood gas values from venous blood gas values in patients with acute respiratory failure receiving mechanical ventilation. J Formos Med Assoc. 2003;102:539–543.
- Rees SE, Toftegaard M, Andreassen S. A method for calculation of arterial acid–base and blood gas status from measurements in the peripheral venous blood. Comput Methods Programs Biomed. 2006;81(1):18–25. doi: 10.1016/j.cmpb.2005.10.003
- Boulain T, Garot D, Vignon P, et al. Predicting arterial blood gas and lactate from central venous blood analysis in critically ill patients: a multicentre, prospective, diagnostic accuracy study. Br J Anaesth. 2016;117(3):341–349. doi: 10.1093/bja/aew261
- Bahmani Bohloli HR, Nazarian S, Habibi M, et al. Prediction of arterial blood gas factors from venous blood gas factors in intensive care unit admitted patients. Arch Iran Med. 2018;21:246–250.
- Toftegaard M, Rees SE, Andreassen S. Evaluation of a method for converting venous values of acid-base and oxygenation status to arterial values. Emerg Med J. 2009;26(4):268–272. doi: 10.1136/emj.2007.052571
- Rees SE, Hansen A, Toftegaard M, et al. Converting venous acid-base and oxygen status to arterial in patients with lung disease. Eur Respir J. 2009;33(5):1141–1147. doi: 10.1183/09031936.00140408
- Tygesen G, Matzen H, Grønkjær K, et al. Mathematical arterialization of venous blood in emergency medicine patients. Eur J Emerg Med. 2012;19(6):363–372. doi: 10.1097/MEJ.0b013e32834de4c6
- Rees SE, Rychwicka-Kielek BA, Andersen BF, et al. Calculating acid-base and oxygenation status during COPD exacerbation using mathematically arterialised venous blood. Clin Chem Lab Med. 2012;50(12):2149–2154. doi: 10.1515/cclm-2012-0233
- Kelly AM, Klim S, Rees SE. Agreement between mathematically arterialised venous versus arterial blood gas values in patients undergoing non-invasive ventilation: a cohort study. Emerg Med J. 2013;31(e1):e46–e49. doi: 10.1136/emermed-2013-202879
- Manuel A, Wordingham-Baker S, Angus R, et al. A method for calculation of arterial blood gas values from measurements in the peripheral blood (v-TAC): the first UK study. Eur Respir J. 2017;50:A4734.
- Kamperidis P, Ranmuthu S, Archer P, et al. Optimizing acute non-invasive ventilation care in the NHS; the v-TAC approach optimising acute non-invasive ventilation care in the NHS; the v-TAC approach. Thorax. 2018;73:A250.
- Lumholdt M, Damgaard KA, Christensen EF, et al. Mathematical arterialisation of peripheral venous blood gas for obtainment of arterial blood gas values: a methodological validation study in the clinical setting. J Clin Monit Comput. 2019;33(4):733–740. doi: 10.1007/s10877-018-0197-1
- Ekström M, Engblom A, Ilic A, et al. Calculated arterial blood gas values from a venous sample and pulse oximetry: clinical validation. PLOS ONE. 2019;14(4):e0215413. doi: 10.1371/journal.pone.0215413
- Thomsen LP, Klein A-C, Vitali-Serdoz L, et al. Evaluation of mathematical arterialization of venous blood in intensive care and pulmonary ward patients. Respiration. 2021;100(2):164–172. doi: 10.1159/000512214
- Shastri L, Kjaergaard S, Thyrrestrup, et al. Mathematically arterialised venous blood is a stable representation of patient acid–base status at steady state following acute transient changes in ventilation. J Clin Monit Comput. 2022;36(5):1333–1340. doi: 10.1007/s10877-021-00764-3
- Moher D, Liberati A, Tetzlaff J, et al. Preferred reporting items for systematic reviews and meta-analyses: the PRISMA statement. J Clin Epidemiol. 2009;62(10):1006–1012. doi: 10.1016/j.jclinepi.2009.06.005
- Rees SE, Andreassen S. Mathematical models of oxygen and carbon dixide storage and transport: the acid-base chemistry of blood. Crit Rev Biomed Eng. 2005;33(3):209–264. doi: 10.1615/CritRevBiomedEng.v33.i3.10
- Siggaard-Andersen O. The acid-base status of the blood. 4th ed. Copenhagen: Munksgaard; 1974.
- Rochwerg B, Brochard L, Elliott MW, et al. Official ERS/ATS clinical practice guidelines: noninvasive ventilation for acute respiratory failure. Eur Respir J. 2017;50(2):1602426. doi: 10.1183/13993003.02426-2016
- Shastri L, Kjærgaard S, Thyrrestrup PS, et al. Is venous blood a more reliable description of acid-base state following simulated hypo- and hyperventilation? Scand J Trauma Resusc Emerg Med. 2021;29(1):1–6. doi: 10.1186/s13049-021-00848-8