?Mathematical formulae have been encoded as MathML and are displayed in this HTML version using MathJax in order to improve their display. Uncheck the box to turn MathJax off. This feature requires Javascript. Click on a formula to zoom.
ABSTRACT
This paper describes the modelling process of soft-linking two system dynamics models of the automotive ecosystem: the Powertrain Technology Transition Market Agent model and the Transport, Energy, Economics, Environment model. The objective of this work is to explore future battery electric and plug-in hybrid electric powertrain deployment in key electro-mobility markets: China, European Union, India, Japan, Norway and the United States. In the “Alternative” scenario, a combined stock of almost 130 million electric cars in 2030 is simulated. Yet, conventional car technology continues to dominate the car-mix. By soft-linking the two models and adding information from the electric bus market, a more realistic representation of the historical battery price evolution is obtained. Due to the uncertain evolution of the battery price, sensitivity analyses are performed. We conclude that the battery price remains a crucial explanatory variable for annual electric car sales in simulation exercises.
1. Introduction
1.1. Background
In 2015, the transport sector emitted 7.7 gigatonnes of CO2 (GtCO2) emissions globally, accounting for 24% of total CO2 emissions from fuel combustion. While road transport activity was responsible for almost 75% of transport CO2 emissions in that year (IEA, Citation2017), almost one-quarter of those emissions can be attributed to cars in the European Union (EU), Japan and the United States (US) (UNFCCC, Citation2016). To mitigate CO2 emissions from cars, governments and industry are promoting low- and zero-emission tailpipe powertrain technologies. Specifically, the Paris Declaration on Electro-Mobility and Climate Change mentions the deployment of 100 million electric cars worldwide in 2030 (COP21, Citation2016). This would entail a significant increase from the 3.1 million electric cars in use globally in 2017 (EVI, Citation2018).
With the emphasis on understanding modes of behaviour rather than on point-to-point prediction, the objective of this work is to explore the transition from conventional vehicles (petrol and diesel) to electric vehicles (EVs) in key markets until 2030 by means of simulation. To this end, a modelling exercise involving the coupling of two system dynamics models was carried out: the Powertrain Technology Transition Market Agent Model (PTTMAM) and the Transport, Energy, Economics, Environment (TE3) model. Neither of them model the oil price endogenously and both of them contain a learning curve affecting the battery cost. According to a leading vehicle manufacturer, the battery is responsible for 20–30% of the cost of EV materials (VW, Citation2019). Whereas the PTTMAM simulates EV uptake in European countries, TE3does so for China, India, Japan and the US. Thus, the models can be seen as complementary. The rationale for soft-linking these models arises from the expectation that, by enlarging the number of countries considered, a more realistic representation of the battery price evolution, a crucial EV component, and resulting EV deployment may be achieved.
The focus of this study is primarily on passenger cars and to a lesser extent on buses. In particular, we examine electric car powertrain technology: battery electric vehicles (BEVs) and plug-in hybrid electric vehicles (PHEVs). Fuel cell vehicles (FCVs) are beyond the scope of this study, as they have been analysed in other recent work (see section 2). Assuming a strong policy package supportive of FCVs would result in less EV deployment than reported in this paper.
The main contribution of this paper is to describe how the linkage between the two models was done as well as to highlight model-based results on EV deployment internationally. In addition to the EU Member States, the following countries (henceforth non-EU) were included: China, India, Japan, Norway and the US. Thus, thirty-three markets were modelled in total. In 2017, these countries accounted for 76% of total new car sales (OICA, Citation2018) and 97% of electric car sales (EAFO, Citation2018) (EVI, Citation2018).
The structure of the paper is as follows: an overview of the existing literature is provided in section 2, section 3 describes the methodology, in section 4 the model-based results are shown, conclusions are drawn and further research opportunities are communicated in section 5. Finally, the appendix highlights reporting issues.
1.2. Overview of the simulation models used
PTTMAM is a comprehensive SD model covering the EU car and light commercial vehicle (LCV) markets. It models the interactions among four agent groups: users, manufacturers, infrastructure providers and authorities. In the model, CO2 emission targets set by the authorities have a strong impact on manufacturers’ decisions to support certain powertrains and their associated attractiveness for users and profitability for infrastructure providers. The model has been applied in various studies, including Harrison and Thiel (Citation2017a), and is documented in Harrison et al. (Citation2016). In this study, only the car sector of PTTMAM was used as LCVs are not available in the TE3 model and uptake has been much slower to date (the EU28 stock of electric LCVs had almost 81,000 units in 2018, compared to almost one million electric cars (EAFO, Citation2019)).
TE3 is a system dynamics model focusing on the impact of cars on energy demand and greenhouse gas (GHG) emissions in China, France, Germany, India, Japan and the US. The model distinguishes between new car sales that are made for the first-time and repeated sales (see e.g., De Wolff (Citation1938)). It segments consumers into four groups: innovators, utility maximisers, low-cost buyers and habit-oriented purchasers. The endogenisation of the battery cost via cumulative battery manufacturing experience through learning by doing as a result of policy measures that favour electric car deployment is the defining aspect of this model. A recent application of the TE3 model, which reports scenario-based simulations of GHG emissions, is J. J. Gómez Vilchez and Jochem (Citation2020). A detailed description of each of the nine modules composing the TE3 model can be found in J. J. Gómez Vilchez (Citation2019a) (see also the Appendix).
The main features and differences of both models are shown in . Whilst PTTMAM is highly detailed in authorities’ CO2 emission targets and vehicle manufacturer’s strategies, TE3 includes consumer segmentation and has a stronger focus on the dynamics of energy demand and GHG emissions. Due to the high detail in both models it was not possible at this stage to simply absorb one model into the other. As shown in , not only the structure but also the size of each model (i.e. number of variables disregarding subscripted elements) is different. Thus, model integration is a non-trivial task. In this regard, the soft-linking exercise can be conceived as a preliminary step towards model integration, allowing us to elucidate a reasonable path towards integration in future work.
Table 1. Key features of the applied model
In addition, two small stand-alone SD models were employed in the modelling exercise: (i) the “Bus” model introduced by J. J. Gómez Vilchez (Citation2019b) focusing on the electric bus market, and (ii) the Norwegian market model built on a stand-alone version of PTTMAM and reported by Deuten et al. (Citation2020). We reasoned that the countries where electric car sales have been high (recall section 1.1) contributed to bringing battery cost down. However, battery capacity must have also played a role. Thus, we hypothesised that past battery cost reductions were achieved partially thanks to the bus market. As will become clear in section 3.2, these models were needed to derive a more realistic battery cost curve. The output of these two models are shown in the Appendix. A key finding of this study is that the electric bus market played a pivotal role in bringing lithium-ion battery costs down. The novelty of this work arises from having taken this market into account in the modelling process to simulate the battery price.
2. Literature review
The number of studies modelling the market penetration of EVs has increased in recent years (see for instance, the reviews by Al-Alawi and Bradley (Citation2013) and Jochem et al. (Citation2018)). The latter reviewed applications of four methods in this type of studies: agent-based simulation (ABS), econometrics (including discrete choice (DC)), general equilibrium modelling and system dynamics (SD). After classifying these methods into bottom-up and top-down, those authors concluded that a trend towards hybridisation of modelling approaches is emerging, facilitated by the increasing recognition of the need to consider both individual and system behaviour and availability of big data.
In this paper, we focus on SD models without fully disregarding possible combinations with other methods. The rationale for coupling SD with other methods comes from the possibility of exploiting methodological synergies and gaining new insights along the process. For instance, the oil price is considered to be an important variable for the car market and, as indicated in section 1, it is modelled exogenously in PTTMAM and TE3. For this reason and as shown in , these models were coupled with energy system optimisation models in past modelling exercises. The use of SD to model transport problems in general and alternative fuel vehicles (AFVs) take-up in particular was reviewed by Shepherd (Citation2014). In this particular context, the main assumptions of twelve SD models were reviewed by J. J. Gómez Vilchez and Jochem (Citation2019). In our view and based on these reviews, four SD models stand out in the literature on this topic for their originality, comprehensiveness, dissemination and influence: Automotive Market Simulator (AMaSi), ASsessment of TRAnsport Strategies (ASTRA), Driving the Future (DtF) and the model by Struben and Sterman (Citation2008). First, AMASi (Kieckhäfer et al., Citation2016) is an adaptation of the model described by Kieckhäfer et al. (Citation2014). This model is of interest to the simulation community because, as done also by Shafiei et al. (Citation2013), it integrates ABS and SD. In our view, AMaSi stands out for its originality in modelling vehicle manufacturers’ response to emission standards. Second, the ASTRA model (see Schade (Citation2005), Krail (Citation2009), and Fiorello et al. (Citation2010) as well as Krail and Schade (Citation2016)) is a transport model with a vehicle fleet module of interest to the present work because it encompasses thirty European countries (for more details see http://www.astra-model.eu/). In our view, ASTRA stands out for its comprehensiveness and level of modal and vehicle type disaggregation. Third, DtF is based on a model originally developed by Keith (Citation2012) which has evolved into a management flight simulator (Keith et al., Citation2017) available at: https://forio.com/app/mit/afv/. In our view, the DtF model stands out for being disseminated as a gaming and learning tool with a robust interface. Fourth, the “Struben and Sterman model” was adapted by Shepherd et al. (Citation2012) and interestingly incorporated the results of the DC model by Batley et al. (Citation2004). A more recent example is Oliveira et al. (Citation2019), who extended the “Struben and Sterman model” to investigate dynamic consumer preferences towards AFVs in the Portuguese market “by including two sets of utility functions for each attribute” (p. 88). In our view, the “Struben and Sterman model” stands out for its influence in the research community, reflected also in the number of citations. On the basis of this literature, we identified the following gap: of these models only ASTRA models the bus market. However, to our knowledge it neither considers explicitly the influential Chinese electric bus market nor vehicle manufacturers’ strategies (the latter is taken into account by the other models). The purpose of this study is to attempt to reduce this gap by presenting a modelling exercise in which vehicle manufacturers’ behaviour is partially considered and the role of the electric bus uptake in China is taken into account. It also allows the comparison of results from applying the TE3 model together with either ASTRA (Heitel et al. (Citation2020)) or PTTMAM (this paper).
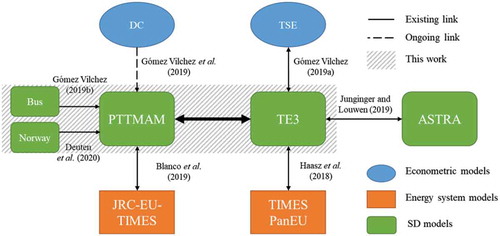
The ASTRA model is shown, together with the two main SD models used in this work, in . As can be seen, ASTRA and TE3 were soft-linked in the work reported by Heitel et al. (Citation2020). The TE3 model had already been soft-linked with a time-series econometric (TSE) model (see J. J. Gómez Vilchez (Citation2019a)) and with The Integrated Market allocation Energy flow optimisation System (TIMES-PanEU) model (see Haasz et al. (Citation2018)). The key outcome of the present study is the soft-linking of TE3 with another large European model: PTTMAM. This model had already been soft-linked with the Joint Research Centre (JRC)-EU-TIMES energy system optimisation model (see Blanco et al. (Citation2019)) to examine FCVs and is in the process of being updated with the amalgamation of the DC model reported in Gómez Vilchez et al. (Citation2019). In our case, the reason for soft-linking SD models is to enlarge the number of countries considered in the field of electro-mobility, which is expected to influence the battery cost development and electric car deployment as endogenously determined by the model.
Figure 1. SD models used in this work and linkages with other models, by method
The present exercise builds upon previous research reported by J. J. Gómez Vilchez (Citation2018), though it deviates from that work in three significant ways: (i) it disregards battery resource material constraints (see section 5); (ii) it includes electric bus cumulative sales and their impact on learning by doing in battery manufacturing; and (iii) it stresses the evolution of the battery costs and country-specific electric car sales and stocks.
3. Methodology
3.1. The system dynamics method
Both PTTMAM and TE3 are grounded on SD, which emphasises the feedback structures of complex systems and their associated dynamic behaviour (refer to Forrester (Citation1961)). In general, SD is a suitable method to investigate dynamic problems characterised by nonlinearities and delay processes (see Sterman (Citation2000)). We consider that SD is an appropriate method to be applied in transport not only because of its concern with policy design and analysis (Abbas & Bell, Citation1994), but also because it allows us to capture the main feedback processes that are present in the complex automotive ecosystem. The structure of both models relies on stock-and-flow ageing-chains formulations of the car market and feedback mechanisms between electric car demand and battery manufacturing. Furthermore, interactions between agent groups, not individual agents, are modelled. To solve the system of ordinary differential equations contained in each model, Euler numerical integration is used.
The issue of validation is treated for each model separately. With regards to PTTMAM, extreme data analysis, reality checks and sensitivity testing were carried out at the model development phase (Pasaoglu et al., Citation2016). Validation of the model and replication of policies in two case studies were described in more detail in Harrison et al. (Citation2016) and Harrison and Thiel (Citation2017b), respectively. Concerning TE3, the outcomes of dimensional consistency checks, integration error and sensitivity tests as well as model fit with historical data can be found in J. J. Gómez Vilchez (Citation2019a).
3.2. Brief description of the soft-linking process
Although the PTTMAM and TE3 models rely on the same method, they differ in model boundaries. For this reason, we favoured a soft-linking process instead of a hard-linking or model integration process. However, the question of whether the attainable results will be meaningful remains. We argue that, although the output of each model will not be fully comparable, meaningful results can be obtained if a crucial variable behaves in the same way in both models and the policy inputs used are similar. The crucial variable in this case is the battery cost.
The starting point of the soft-linking process is a comparison of electric car stocks under the “Base” scenario of each model (see section 3.3). The end point of the process is a comparison between the model results without and with soft-linking (these outcomes are shown in section 4.1.1).
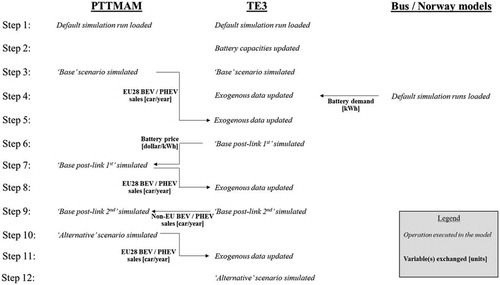
provides a summarised description of the process of coupling PTTMAM and TE3. The process chart shows the sequence of steps that are carried out in each of the models. Iterations were needed for the models to converge (see section 3.3). A more detailed description of each of the steps comprising the model coupling procedure is given in the Appendix.
Figure 2. Soft-linking process chart
3.3. Scenario construction
Although two main scenarios (“Base” and “Alternative”) were constructed, due to the nature of the methodology used in this work, several simulation runs are relevant:
Default simulation
This is the simulation run available by default in the models. It corresponds to “Base 02_03 c” in PTTMAM and “RS” in TE3. As indicated in the Appendix, these can be reproduced by the interested reader.
Base pre-link
The “Base” scenario builds on the default simulation run of each model. In PTTMAM, the “Base” scenario is created by setting purchase subsidies (the “authorities vehicle subsidy proportion” variable) equal to zero in 2011 and 2012 and by excluding FCVs from subsidies. In TE3, the “Base” scenario is constructed by updating the PHEV and BEV battery capacities, in addition to assuming no battery replacement.
Base post-link
The soft-linking process introduces two variants of the “Base” scenario. These are named “Base pre-link” and “Base post-link”. The latter emphasises the coupling of PTTMAM and TE3. Two iterations of “Base post-link” are carried out: without (“Base post-link 1st”) or with (“Base post-link 2nd”) non-EU sales input from TE3.
Alternative scenario
Our interest is not only in comparing the two variants of the “Base” scenario (that is, without and with soft-linking) but also in comparing “Base post-link 2nd” with a more ambitious electric car deployment scenario that already reflects the effect of model coupling. This ambitious scenario is named the “Alternative” scenario and differs from the “Base” scenario in the numerical assumptions of policies. Specifically CO2 emission targets and/or electric car purchase incentives are considered (see in section 3.4). Depending on the combinations of policy inputs, several variants of the “Alternative” scenario are constructed (see the Appendix).
Table 2. Main assumptions
Table 3. PHEV and BEV battery capacities
Table 4. CO2 emission targets [gCO2/km], by level of policy ambition
3.4. Main assumptions in this study
With respect to previous work, the main assumptions adopted in this study are related to the battery cost and price, battery capacity per car, battery demand from electric buses, CO2 emission targets and electric car purchase incentives. These are listed in and described in the next sub-sections.
3.4.1. Battery cost and price
shows the simulated battery cost in PTTMAM and TE3 prior to soft-linking, with the following remarks: (i) PTTMAM calculation based on an average 30 kilowatt hour (kWh) battery capacity and an exchange rate 1 euro equal to 1.2 dollars; (ii) at the time of TE3 model development, (EVI, Citation2016) was used as a data source, which defers slightly from the more recent (Bloomberg New Energy Finance [BNEF], Citation2017); and (iii) since (BNEF, Citation2017) reports the price, not the cost, a 10% mark-up has been assumed. The most striking difference between the plotted curves is the initial section of the PTTMAM curve and its relatively slowly declining behaviour. Nevertheless, this run captures well the 2012–2014 period.
Figure 3. Battery cost before model linkage, data versus simulation
We update the battery price using EquationEquations 1(1)
(1) –Equation7
(7)
(7) (see also Figure A3 in the Appendix). As can be seen, the battery price depends on the cost which is affected by the industry experience, in turn influenced by the number of batteries manufactured and their capacity. We estimate a time lag of 3 years for experience to translate into market cost. We further assume one battery pack per car,
equal to 15.5%, initial battery production of 100 and 400 for respectively PHEV and BEV as well as an initial battery cost, in real terms, of 1,000 dollars per kWh.
where: = expected industry experience [kWh];
= battery capacity [kWh/battery];
= cumulative battery production [battery];
= sales rate [car/year];
= exogenous car data [battery];
= exogenous bus data [battery];
= pack [battery/car];
= expected aggregate industry experience [kWh];
= learning curve [dmnl]; dmnl = dimensionless;
= cost reduction fraction [dmnl];
= battery cost [dollar/kWh];
= gross domestic product deflator;
= battery price [dollar/kWh];
= industry margin. Superscripts:
= nominal;
= United States. Subscripts:
= country;
= type of EV;
= time. Note that dt is 0.25 and 1 for PTTMAM and TE3 respectively and that [battery] refers to the number of batteries.
3.4.2. Battery capacity
Neither PTTMAM models the battery capacity explicitly nor TE3 disaggregates cars by size (recall ). In the former, we assigned a certain battery capacity to each car size (see ). In the latter, the default assumptions on battery capacity are 8–24 kWh (2000–2019) and 16–30 kWh (2020–2030), respectively for PHEV and BEV. As can be seen in the table, we work with the same average values for both models to ensure consistency. The 30 kWh average value is in line with our own analysis of 2015 weighted sales using (EAFO, Citation2018) data. Following the ongoing trend of increasing battery capacity in response to a declining battery cost, so that electric range can be extended, we assume that the average battery capacity increases to 14 kWh and 40 kWh for PHEVs and BEVs, respectively (the timing is tested in section 4.2). For electric buses, the values are inferred from available data and assumed to remain constant.
3.4.3 Battery demand from electric buses
Although the main focus of this paper are electric cars, electric buses (which feature batteries with very high capacity) have played an important role in reducing battery cost through extra cumulative manufacturing experience and should therefore be considered in our simulation exercise. To explore this market, a small model was developed (see J. J. Gómez Vilchez, Citation2019b). As the vast majority of electric buses in use are in China (EVI, Citation2018), the model included not only the EU but also the Chinese market. Another major vehicle market, North America, was neglected as it experienced only less than 500 electric bus sales in 2017 (McKinsey, Citation2018) and expectations for rapid deployment are rather low, at least in the US (Reuters, Citation2017).
reflects our understanding of EV battery demand once battery capacity is taken into account. The supply curve is based on Avicenne (Citation2018). We estimate that battery demand was greater from electric buses than from electric cars in 2015 and 2016.
Figure 4. Electric vehicle battery market: estimated annual supply and demand, by type
3.4.4. CO2 emission targets
Unlike in the other countries, EV support measures in EU countries reflect not only national policies but also EU legislation such as the CO2 emissions standards. Electric car deployment can be supported by setting stricter CO2 emission targets for the average new car sold. shows the numerical values assumed for this variable under three differing levels of policy ambition. Whereas the “low ambition” values are used in the “Base” scenario, the “Alternative” scenario relies on the “medium ambition” values. For the EU, the input values reflecting the CO2 emissions standards are based on EU (Citation2009) and, post-2020, on the recent proposal by the European Commission (EU, Citation2017): 80 grams of CO2/km by 2025 and 66 grams of CO2/km in 2030. For the EU, a highly ambitious scenario is available using values from Blanco et al. (Citation2019).
3.4.5. Electric car purchase incentives
Electric car purchase subsidies are available for the period 2020–2024 under the “Alternative” scenario. In all the regions, the level of incentives is assumed to remain constant over that period at 4,000 euros for BEVs and 3,000 euros for PHEVs in the European countries. Though not necessarily representative of all countries, we consider this level of incentives to be realistic for two reasons: (i) the evidence suggests that incentives tend to be higher for BEVs (which have zero tailpipe emissions) than for PHEVs (which require oil products and emit more); and (ii) the assumed values correspond to the actual subsidies that prevailed in Germany for many months until they were recently increased. For remaining countries, the values are 4,000 dollars for BEVs and 3,000 dollars for PHEVs (the assumed constant exchange rates are 8.3 yuan/dollar, 45 rupee/dollar and 108 yen/dollar).
4. Results
4.1. Model-based results
4.1.1. “Base” scenario
shows the pre-linkage model results on annual electric car sales. Importantly, this chart reflects the de-activation of the Rest of the World (RoW) sales link in PTTMAM (the default run with RoW sales provides a better fit to historical data). As can be seen, EU electric car sales grew very little between 2015 and 2016 (EAFO, Citation2018). This can be partially explained by a strong decline in PHEV sales in the Netherlands and anaemic growth in Germany in that period. With regards to electric car sales, both models seem to exhibit faster growth in their default runs than historical data suggests. The gap in TE3 can be partially explained by Japanese sales (see the Appendix).
Figure 5. Annual electric car sales before model linkage, data versus simulation
When compared to (note the shift in the “data” curve as cost was reported there), the results of are satisfactory as they are closer to the historical evidence and in line with the trajectories recently reported by Tsiropoulos et al. (Citation2018) under their “moderate” scenario.Footnote1 This fit improvement can in part be explained by having taken into account the results of the “Bus” model and by the 3-year lag we estimated (recall and EquationEq. 5(5)
(5) , respectively). The battery price curve is simulated in TE3 for two runs: “Base post-link 1st” and “Alternative”. In the latter, the effect of endogenising the EU electric car market is visible towards the end of the simulation period. In 2030, the battery price is simulated to range between 81 and 108 dollars per kWh.
Figure 6. Battery price after model linkage, data and trajectory versus simulation
shows annual electric car sales after model linkage, both for the first and the second model iteration under the “Base” scenario. The process of soft-linking leads to an overall improvement on historical fit (recall ), particularly for EU electric car sales for the first iteration. The second iteration, however, does not yield in TE3 significative results.
Figure 7. Annual electric car sales after model linkage, data versus simulation
4.1.2. Alternative scenario
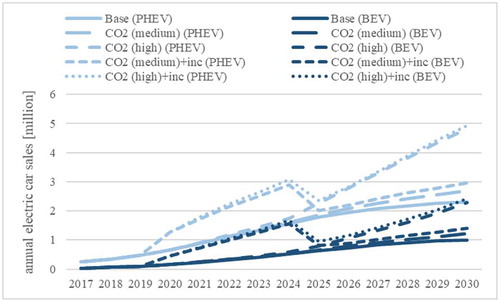
The results of implementing the variants of the “Alternative” scenario in PTTMAM are shown in . As can be seen, electric car sales in the EU are simulated to reach slightly over 3 million in 2030 under the “Base” scenario, more than doubling under the most ambitious scenario. The effect of purchase incentives (inc) on PHEV and BEV sales is clearly visible. Interestingly, post-2025 sales are only slightly lower under the “CO2 (high)” run than under the “CO2 (high)+inc” run, suggesting that incentives might have a rather low long-term effect. The CO2 constraint is more influential than the incentives. This is in line not only with previous work carried out with each model separately but also with other studies. That vehicle energy efficiency improvement is the most effective instrument to reduce GHG emissions had already been recognised by Sperling and Gordon (Citation2009) over a decade ago. The incentives in the “Alternative” scenario are rather low and short in duration, when compared with one of the leading countries in terms of EV deployment (Norway) (Deuten et al., Citation2020). Incentives do not necessarily translate in proportional price reductions for consumers as other market players may reap part of the incentives (Lévay et al., Citation2017). This latter effect has also been shown for other technologies, for example, photovoltaics (Nemet, Citation2019).
Figure 8. Annual electric car sales in the EU, by simulation run
Turning to TE3, two possible ways of simulating the “Alternative” scenario for the non-EU markets are: (i) introduce pro-electric car policy measures (recall –) only in TE3; and (ii) introduce the aforementioned policy measures in both models. The results of simulating these, respectively named “Alternative (Alt.) [TE3]/Base [PTTMAM]” and “Alt. [TE3]/Alt. [PTTMAM]”, are visible in . The figure shows the sum of the electric car stocks in China, India, Japan and the US until 2030. As can be seen, electric car stock is simulated to be substantially larger under the “Alternative” scenario than under the “Base” scenario. Interestingly, simulating the “Alternative” scenario corresponding to each model together has a synergetic effect on non-European stock towards the end of the simulation period. In this case, non-European electric car stock is almost 90 million in 2030 (ca. 11 million larger than under “Alternative (Alt.) [TE3]/Base [PTTMAM]”). This is mainly due to greater BEV deployment in China as a result of a lower battery price corresponding to faster EU deployment (recall the curve for “Alternative” in ). The results reported in the next section build on this second run.
Figure 9. Electric car stock in non-European countries, by simulation run
4.2. Sensitivity and robustness analysis
The increase in a car’s battery capacity (recall section 3.4.2) by scale-up (adding more cells) leads to a higher purchase price of electric cars, ceteris paribus. This has a negative effect, partially offset by increased electric range, on users’ perceived attractiveness for BEVs. Rather than focusing on the cost reduction fraction of the learning curve associated with battery manufacturing or modelling explicitly energy density gains due to battery improvements, we examine in this paper the sensitivity of an increase in battery capacity depending on the assumed year in which it occurs.
The variable “test timing battery increase” is created in TE3, linking a target battery capacity with the battery cost relative to the initial year. From a default value equal to 0.24, a sensitivity test is carried out by assuming for this new variable a uniform probability distribution with values ranging from 0.30 to 0.06. These correspond to an increase in the BEV battery capacity from 30 kWh to 40 kWh in a given year over the period 2017–2027. Univariate Monte Carlo simulation is performed for a thousand runs. The results on non-European car stock are shown in the left chart of . The estimated confidence bounds suggest that delaying the increase in battery capacity is likely to lead to faster electric car deployment in these markets. In contrast, the right chart of shows the sensitivity test after having de-activated European electric car sales (i.e. without model coupling). As can be seen, there is a noticeable difference between the two charts both in the nature of the upper and lower curves and in the weight of each confidence bound, which highlights the effect of soft-linking the models.
Figure 10. Monte Carlo simulation of non-European electric car stock: with model coupling (left) and without (right) [M =million]
![Figure 10. Monte Carlo simulation of non-European electric car stock: with model coupling (left) and without (right) [M =million]](/cms/asset/883b08b3-9df9-4399-9391-886fbf727969/tjsm_a_1781556_f0010_oc.jpg)
The resulting car-mix for all the countries considered in this study under the “Alternative” scenario is shown in . The car-mix is not reported for the “Base” scenario because electric car market penetration occurs much slower (recall and ). The aggregate car stock is, both in PTTMAM and TE3, lower than the data reported by OICA (Citation2016). We simulate that almost 900 million cars are in use in these countries by 2030, with the majority of this growth attributable to China and India. The left chart shows the simulated car-mix under the “Alternative” scenario, with PHEV and BEV reaching 53 and 76 million units in 2030. The sum of these numbers is greater than the deployment goal defined in the aforementioned Paris Declaration on Electro-Mobility and Climate Change. Given the uncertain impact of the battery price, a second run is reported (chart on the right) in that figure. Based on our sensitivity analysis, we identified the run that delays battery capacity increase until 2027 as the one leading to faster electric car deployment. Under this sensitivity-based run, the car mix becomes more diversified over the next decade, with BEV dominating over PHEVs.
Figure 11. Car-mix in key markets: “Alternative” [left] and sensitivity-based run [right]
![Figure 11. Car-mix in key markets: “Alternative” [left] and sensitivity-based run [right]](/cms/asset/08f6cd3c-e67f-4e22-9a3b-e786fddfffed/tjsm_a_1781556_f0011_oc.jpg)
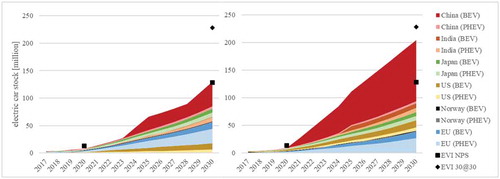
The PHEV and BEV stock shown in is disaggregated by country in . As can be seen, China is simulated to remain the major electric car market over the model time horizon. In terms of robustness analysis, the figure also compares the results of this modelling exercise with the two scenarios (“New Policies Scenario” (NPS) and ‘EV30@30ʹ) developed by EVI (Citation2018). The latter were generated in the Mobility Model (MoMo; categorised by Jochem et al. (Citation2018) as a hybrid model) and reflect global electric car stock for buses, trucks, light commercial and passenger light-duty vehicles. Broadly speaking, our simulations based on the “Alternative” scenario are in line with EVI’s results for passenger light-duty vehicles in 2020 and 2030 at an aggregated level, as comparability at the country level is not possible.
Figure 12. Electric car stock disaggregated by type and country, by run
5. Discussion
In sum, a modelling exercise involving the soft-linkage of two simulation models comprising the world’s major electric car markets was described. By soft-linking both models, the battery price curve was reconciled and represented in a more realistic manner. By simulating a battery price curve with a better fit to historical data, the speed of electric car deployment in both models was noticeably altered. Due to the nonlinearities of PTTMAM and TE3, synergies between the policy measures of the “Alternative” scenario, as simulated in both models, could be identified.
The main conclusion of this study is that the battery price remains a crucial explanatory variable for annual electric car sales. In our study, we found that the demand for batteries for electric buses has a significant influence on the development of battery costs for both the car and bus markets. A corollary to this is that the assumed evolution of battery costs and average battery capacities remain important modelling issues. This conclusion could have also been reached without the need to soft-link the models. Through model coupling, however, we were able to show how the important variable “battery cost” could be simulated with a closer fit to data. After reconciling a key variable in both models, we were then well positioned to explore electric car diffusion in countries that represented 97% of the world electric car market in 2017. The important contribution battery demand from electric buses made to falling battery costs is expected to decline in the future. Furthermore, in view of the assumed total car stock in the world’s major car markets until 2030 and the time required for fleet turnover, conventional car technology is simulated to remain in a dominant position even if policy measures supportive of electric cars are in place in these markets. The reliance on conventional cars in these scenarios leads to the situation that GHG emissions and air pollution are not curbed as desired by policy-makers. The policy implications of this are: (i) sub-national measures need to be further analysed; (ii) binding national measures such as conventional car bans applicable from a pre-defined future date may be increasingly necessary; (iii) non-motorised modes, public transport and zero tailpipe emission technologies (i.e. FCVs powered by hydrogen) may still have a greater role to play.
In the EU, the revised “Clean Vehicle Directive” (EU, Citation2019) is encouraging the deployment, among others, of fuel cell buses. If we concluded that electric buses helped reduce the battery cost, we cannot rule out the possibility that fuel cell buses will do the same for the fuel cell system. Thus, this would cascade into lower fuel cell car prices which would result in lower electric car sales than simulated here. According to E4tech (Citation2020), rapid cost reductions for this technology are being achieved. Thus, this is a research area of increasing interest.
We identify the following main limitations with their corresponding implications. First, though it considered the major EV markets to date, this study disregarded freight vehicles (vans and trucks) as well as the potential deployment of electric buses in other markets beyond China and the EU. The implication is that the potential of alternative technology deployment in these vehicles and its impact on key components cost, related refuelling infrastructure and transport emissions, among others, remained uncharted. Second, given the focus on the soft-linking methodology, the analysis of real-world policy measures (e.g., EV quotas in China or recharging infrastructure targets in the EU) was rather limited. The implication is that the policies considered in this paper can be regarded as simplifications and may not be up-to-date (as in the case of German subsidies). Third, supply side constraints arising from battery demand were not considered. The implication is that explicit representation of these processes in the models is conducive to the identification of bottlenecks that may constrain EV sales.
We highlight three future modelling tasks: (i) integration of both models into a single framework, so that input assumptions can be reconciled to the greatest possible extend and additional feedback loops can be captured and communicated more clearly; (ii) further integration of smaller stand-alone models (i.e. bus and battery manufacturing models) into that single framework to investigate public transport decarbonisation and potential battery bottlenecks; and (iii) further combination of SD with other methods, which is an increasingly popular modelling trend (Zolfagharian et al., Citation2018). For instance, PTTMAM could benefit from a representation of manufacturers by means of ABS, which is particularly relevant in the context of CO2 emission standards. ABS can also be combined with geographic information systems (see e.g., Crooks et al., Citation2018) to examine spatial aspects of e.g., battery and vehicle supply. Another possibility would be to combine the SD method with DC or artificial neural networks. The complementarity of SD with the latter was shown by Kofjac et al. (Citation2003). Specifically, while the choice module of TE3 should be revisited in view of the updated battery price curve, PTTMAM has the potential to accommodate the results of the DC model mentioned in section 2. The implementation of such a hybrid modelling approach could potentially be exploited in a policy-making context such as Directive 2014/94/EU (EU, Citation2014), which seeks to promote the uptake of alternative fuels in the EU transport systems. Finally, further research is needed to understand the impact of widespread car sharing and autonomous cars on the world’s future total car stock (as recently highlighted by Keith et al. (Citation2020)) as well as the future role of public transport.
Acknowledgments
We are grateful to all the persons who contributed to the development of PTTMAM in the past as well as to three anonymous reviewers for their remarks.
Disclosure statement
No potential conflict of interest was reported by the authors.
Notes
1. A ten percent mark-up and the same exchange rate was assumed, as these authors report cost in euros.
References
- Abbas, K. A., & Bell, M. G. H. (1994). System dynamics applicability to transportation modeling. Transportation Research Part A: Policy and Practice, 28(5), 373–390. https://doi.org/org/10.1016/0965-8564(94)90022-1
- Al-Alawi, B. M., & Bradley, T. H. (2013). Review of hybrid, plug-in hybrid, and electric vehicle market modeling studies. Renewable and Sustainable Energy Reviews, 21(Suppl.C), 190–203. https://doi.org/10.1016/j.rser.2012.12.048
- Avicenne. (2018). Current status and future trends of the global li-ion battery market. July 4. https://www.charles-hatchett.com/public/images/documents/2018/dr_christophe_pillot_current_status_and_future_trends_of_the_global_li-ion_battery_market.pdf
- Batley, R. P., Toner, J. P., & Knight, M. J. (2004). A mixed-logit model of U.K. household demand for alternative-fuel vehicles. International Journal of Transport Economics/Rivista Internazionale Di Economia Dei Trasporti, 31 (1), 55–77. http://www.jstor.org/stable/42747687
- Blanco, H., Gómez Vilchez, J. J., Nijs, W., Thiel, C., & Faaij, A. (2019). Soft-linking of a behavioral model for transport with energy system cost optimization applied to hydrogen in EU. Renewable and Sustainable Energy Reviews, 115. https://doi.org/10.1016/j.rser.2019.109349
- Bloomberg New Energy Finance (BNEF). (2017). Lithium-ion battery costs: Squeezed Margins and New Business Models. https://about.bnef.com/blog/lithium-ion-battery-costs-squeezed-margins-new-business-models/.
- CleanTechnica. (2017). China electric bus sales still exploding. https://cleantechnica.com/2017/02/25/china-electric-buses-still-exploding/
- CleanTechnica. (2018). China 100% Electric Bus Sales “Just” 89,546 In 2017. https://cleantechnica.com/2018/02/04/china-100-electric-bus-sales-just-89546-2017/
- COP21. (2016). Paris declaration on electro-mobility and climate change and call to action - electrifying sustainable transport, 21st conference of the parties (COP). http://newsroom.unfccc.int/lpaa/transport/the-paris-declaration-on-electro-mobility-and-climate-change-and-call-to-action/
- Crooks, A., Malleson, N., Manley, E., & Heppenstall, A. (2018). Agent-based modelling and geographical information systems: A practical primer. SAGE Publications. https://books.google.it/books?id=ZPl6DwAAQBAJ
- de Wolff, P. (1938). The demand for passenger cars in the United States. Econometrica, 6(2), 113–129. https://doi.org/10.2307/1907143
- Deuten, S., Gómez Vilchez, J. J., & Thiel, C. (2020). Analysis and testing of electric car incentive scenarios in the Netherlands and Norway. Technological Forecasting and Social Change, 151. https://doi.org/10.1016/j.techfore.2019.119847
- E4tech. (2020). Fuel cell industry review 2019. https://www.e4tech.com/news/2018-fuel-cell-industry-review-2019-the-year-of-the-gigawatt.php
- EAFO. (2018). European alternative fuels observatory (EAFO). European Commission (EC). http://www.eafo.eu/
- EAFO. (2019). European alternative fuels observatory (EAFO). European Commission (EC). Accessed December 2019 https://www.eafo.eu/
- EU. (2009). Regulation (EC) No 443/2009 of the European parliament and of the council of 23 April 2009 setting emission performance standards for new passenger cars as part of the community’s integrated approach to reduce CO2 emissions from light-duty vehicles. http://eur-lex.europa.eu/legal-content/en/ALL/?uri=CELEX:32009R0443
- EU. (2014). Directive 2014/94/EU of the European parliament and of the council of 22 October 2014 on the deployment of alternative fuels infrastructure. http://eur-lex.europa.eu/legal-content/EN/TXT/?uri=celex%3A32014L0094
- EU. (2017). Proposal for a regulation of the european parliament and of the council setting emission performance standards for new passenger cars and for new light commercial vehicles as part of the union’s integrated approach to reduce CO2 emissions from light-dut. European Union (EU) Law. http://eur-lex.europa.eu/legal-content/EN/TXT/?uri=COM:2017:676:FIN
- EU (2019) Directive (EU) 2019/1161 of the European parliament and of the council of 20 June 2019 amending directive 2009/33/EC on the promotion of clean and energy-efficient road transport vehicles. European Union (EU) Law. https://eur-lex.europa.eu/eli/dir/2019/1161/oj
- EVI. (2016). Global EV outlook 2016. http://www.iea.org/publications/freepublications/publication/global-ev-outlook-2016.html
- EVI. (2018). Global EV outlook 2018. https://www.iea.org/gevo2018/
- Fiorello, D., Fermi, F., & Bielanska, D. (2010). The ASTRA model for strategic assessment of transport policies. System Dynamics Review, 26(3), 283–290. https://doi.org/10.1002/sdr.452
- Forrester, J. W. (1961). Industrial dynamics. Massachusetts Institute of Technology Press.
- Gerssen-Gondelach, S. J., & Faaij, A. P. C. (2012). Performance of batteries for electric vehicles on short and longer term. Journal of Power Sources, 212, 111–129. https://doi.org/10.1016/j.jpowsour.2012.03.085
- Gómez Vilchez, J. J. (2018). Exploring the battery market for electric cars. In Proceedings of the 36th international conference of the system dynamics society, Reykjavík, Iceland, August 6-10, 2018.
- Gómez Vilchez, J. J. (2019a). The impact of electric cars on oil demand and greenhouse gas emissions in key markets ( Ph.D. Thesis). Karlsruhe Institute of Technology (KIT). KIT Scientific Publishing. https://www.ksp.kit.edu/9783731509141
- Gómez Vilchez, J. J. (2019b). Uptake of alternative fuels in the European Union bus sector. In Record of the 37th international conference of the system dynamics society, Albuquerque, US, July 21-25, 2019.
- Gómez Vilchez, J. J., & Jochem, P. (2019). Simulating vehicle fleet composition: A review of system dynamics models. Renewable and Sustainable Energy Reviews, 115. https://doi.org/10.1016/j.rser.2019.109367
- Gómez Vilchez, J. J., & Jochem, P. (2020). Powertrain technologies and their impact on greenhouse gas emissions in key car markets. Transportation Research Part D: Transport and Environment, 80, 102214. https://doi.org/10.1016/j.trd.2019.102214
- Gómez Vilchez, J. J., Smyth, A., Kelleher, L., Lu, H., Rohr, C., Harrison, G., & Thiel, C. (2019). Electric car purchase price as a factor determining consumers’ choice and their views on incentives in Europe. Sustainability, 11(22), 6357. https://doi.org/10.3390/su11226357
- Haasz, T., Gómez Vilchez, J. J., Kunze, R., Deane, P., Fraboulet, D., Fahl, U., & Mulholland, E. (2018). Perspectives on decarbonizing the transport sector in the EU-28. Energy Strategy Reviews, 20, 124–132. https://doi.org/10.1016/j.esr.2017.12.007
- Harrison, G., & Thiel, C. (2017a). An exploratory policy analysis of electric vehicle sales competition and sensitivity to infrastructure in Europe. Technological Forecasting and Social Change, 114, 165–178. https://doi.org/10.1016/j.techfore.2016.08.007
- Harrison, G., & Thiel, C. (2017b). Policy insights and modelling challenges: The case of passenger car powertrain technology transition in the European Union. European Transport Research Review, 9(3), 37. https://doi.org/10.1007/s12544-017-0252-x
- Harrison, G., Thiel, C., & Jones, L. (2016). Powertrain Technology Transition Market Agent Model (PTTMAM): An Introduction. Technical Report. Joint Research Centre (JRC), European Commission (EC). http://publications.jrc.ec.europa.eu/repository/handle/111111111/40434
- Heitel, S., Seddig, K., Gómez Vilchez, J. J., & Jochem, P. (2020). Global electric car market deployment considering endogenous battery price development. In M. Junginger & A. Louwen (Eds.), Technological learning in the transition to a low-carbon energy system (pp. 281–305). Academic Press. https://doi.org/10.1016/B978-0-12-818762-3.00015-7
- IEA. (2017). CO2 emissions from fuel combustion 2017. https://www.oecd-ilibrary.org/energy/co2-emissions-from-fuel-combustion-2017_co2_fuel-2017-en
- Jochem, P., Gómez Vilchez, J. J., Ensslen, A., Schäuble, J., & Fichtner, W. (2018). Methods for forecasting the market penetration of electric drivetrains in the passenger car market. Transport Reviews, 38(3), 322–348. https://doi.org/10.1080/01441647.2017.1326538
- Keith, D. R. (2012). Essays on the dynamics of alternative fuel vehicle adoption : insights from the market for hybrid-electric vehicles in the United States ( Ph.D. Thesis), Massachusetts Institute of Technology (MIT). http://dspace.mit.edu/handle/1721.1/79546
- Keith, D. R., Naumov, S., & Sterman, J. (2017). Driving the future: A management flight simulator of the US automobile market. Simulation & Gaming, 48(6), 735–769. https://doi.org/10.1177/1046878117737807
- Keith, D. R., Struben, J. J. R., & Naumov, S. (2020). The diffusion of alternative fuel vehicles: A generalized model and future research agenda. Journal of Simulation, 1–18. https://doi.org/10.1080/17477778.2019.1708219
- Kieckhäfer, K., Volling, T., & Spengler, T. S. (2014). A hybrid simulation approach for estimating the market share evolution of electric vehicles. Transportation Science, 48(4), 651–670. https://doi.org/10.1287/trsc.2014.0526
- Kieckhäfer, K., Wachter, K., & Spengler, T. S. (2016). Analyzing manufacturers’ impact on green products’ market diffusion – The case of electric vehicles. Journal of Cleaner Production, 162(Supplement), S11–S25. https://doi.org/10.1016/j.jclepro.2016.05.021
- Kofjac, D., Skraba, A., & Kljajic, M. (2003). Neural network modeling by system dynamics methodology. The IEEE Region 8 EUROCON 2003. Computer as a Tool, 1, 424–428. https://doi.org/10.1109/EURCON.2003.1248057
- Krail, M. (2009). System-Based Analysis of Income Distribution Impacts on Mobility Behaviour ( Ph.D. Thesis). Karlsruhe Institute of Technology (KIT), Baden-Baden: Nomos. https://books.google.it/books?id=sO1MPgAACAAJ
- Krail, M., & Schade, W. (2016). Measures to promote the diffusion of alternative fuel vehicles in EU27. In M. André & Z. Samaras (Eds.), Energy and environment (pp. 155–171). Wiley. https://doi.org/org/doi:10.1002/9781119307761.ch11
- Lévay, P. Z., Drossinos, Y., & Thiel, C. (2017). The effect of fiscal incentives on market penetration of electric vehicles: A pairwise comparison of total cost of ownership. Energy Policy, 105(Suppl.C), 524–533. https://doi.org/10.1016/j.enpol.2017.02.054
- Martinez-Moyano, I. J. (2012). Documentation for model transparency. System Dynamics Review, 28(2), 199–208. https://doi.org/10.1002/sdr.1471
- McKinsey. (2018). Fast transit: Why urban e-buses lead electric-vehicle growth. https://www.mckinsey.com/industries/automotive-and-assembly/our-insights/fast-transit-why-urban-e-buses-lead-electric-vehicle-growth
- Monks, T., Currie, C. S. M., Onggo, B. S., Robinson, S., Kunc, M., & Taylor, S. J. E. (2019). Strengthening the reporting of empirical simulation studies: Introducing the STRESS guidelines. Journal of Simulation, 13(1), 55–67. https://doi.org/10.1080/17477778.2018.1442155
- Nemet, G. F. (2019). How solar energy became cheap: A model for low-carbon innovation. Routledge.
- Nykvist, B., & Nilsson, M. (2015). Rapidly falling costs of battery packs for electric vehicles. Nature Climate Change, 5(4), 329–332. https://doi.org/10.1038/nclimate2564
- OICA. (2016). World vehicles in use 2005-2015. http://www.oica.net/category/vehicles-in-use/
- OICA. (2018). Sales statistics: Sales of new passenger cars 2005-2017. http://www.oica.net/category/sales-statistics/
- Oliveira, G. D., Roth, R., & Dias, L. C. (2019). Diffusion of alternative fuel vehicles considering dynamic preferences. Technological Forecasting and Social Change, 147, 83–99. https://doi.org/10.1016/j.techfore.2019.06.002
- Pasaoglu, G., Harrison, G., Jones, L., Hill, A., Beaudet, A., & Thiel, C. (2016). A system dynamics based market agent model simulating future powertrain technology transition: Scenarios in the EU light duty vehicle road transport sector. Technological Forecasting and Social Change, 104, 133–146. https://doi.org/10.1016/j.techfore.2015.11.028
- Rahmandad, H., & Sterman, J. D. (2012). Reporting guidelines for simulation-based research in social sciences. System Dynamics Review, 28(4), 396–411. https://doi.org/10.1002/sdr.1481
- Reuters. (2017). U.S. transit agencies cautious on electric buses despite bold forecasts. Thompson Reuters. https://www.reuters.com/article/us-transportation-buses-electric-analysi/u-s-transit-agencies-cautious-on-electric-buses-despite-bold-forecasts-idUSKBN1E60GS
- Schade, W. (2005). Strategic sustainability analysis: Concept and application for the assessment of European Transport Policy ( Ph.D. Thesis). Karlsruhe Institute of Technology (KIT). Baden-Baden: Nomos. https://books.google.it/books?id=sHlfAAAACAAJ
- Shafiei, E., Stefansson, H., Asgeirsson, E. I., Davidsdottir, B., & Raberto, M. (2013). Integrated agent-based and system dynamics modelling for simulation of sustainable mobility. Transport Reviews, 33(1), 44–70. https://doi.org/10.1080/01441647.2012.745632
- Shepherd, S., Bonsall, P., & Harrison, G. (2012). Factors affecting future demand for electric vehicles: A model based study. Transport Policy, 20, 62–74. https://doi.org/10.1016/J.TRANPOL.2011.12.006
- Shepherd, S. P. (2014). A review of system dynamics models applied in transportation. Transportmetrica B: Transport Dynamics, 2(2), 83–105. https://doi.org/10.1080/21680566.2014.916236
- Sperling, D., & Gordon, D. (2009). Two billion cars: Driving toward sustainability. Oxford University Press. https://books.google.it/books?id=IAG1ALI1HGAC
- Sterman, J. D. (2000). Business dynamics: Systems thinking and modeling for a complex world. Irwin/McGraw-Hill.
- Struben, J., & Sterman, J. D. (2008). Transition challenges for alternative fuel vehicle and transportation systems. Environment and Planning. B, Planning & Design, 35(6), 1070–1097. https://doi.org/10.1068/b33022t
- Tsiropoulos, I., Tarvydas, D., & Lebedeva, N. (2018). Li-ion batteries for mobility and stationary storage applications - Scenarios for costs and market growth. Scientific and Technical Research Report. Joint Research Centre (JRC), European Commission (EC). http://publications.jrc.ec.europa.eu/repository/bitstream/JRC113360/kjna29440enn.pdf
- UNFCCC. (2016). Greenhouse gas emissions data. Time series. http://di.unfccc.int/time_series
- VW. (2019). Annual report 2018. Volkswagen AG. https://annualreport2018.volkswagenag.com/
- Weiss, M., Patel, M. K., Junginger, M., Perujo, A., Bonnel, P., & van Grootveld, G. (2012). On the electrification of road transport - Learning rates and price forecasts for hybrid-electric and battery-electric vehicles. Energy Policy, 48, 374–393. https://doi.org/10.1016/j.enpol.2012.05.038
- Zolfagharian, M., Romme, A. G. L., & Walrave, B. (2018). Why, when, and how to combine system dynamics with other methods: Towards an evidence-based framework. Journal of Simulation, 12(2), 98–114. https://doi.org/10.1080/17477778.2017.1418639
Appendix
In terms of reporting, simulation guidelines have been proposed to the research community. These include the Reporting of Empirical Simulation Studies (STRESS) guidelines by Monks et al. (Citation2019), which support ABS, discrete-event simulation (DES) and SD as well as the SD-specific guidelines proposed by Rahmandad and Sterman (Citation2012). Though these guidelines are valuable, we propose an alternative approach: the interested reader can gain free access to the main models.
To reproduce the default simulation runs of both the PTTMAM and TE3 models, the reader is referred to their dedicated websites. PTTMAM is available under an EU Public Licence at https://ec.europa.eu/jrc/en/pttmam. The TE3 model is available at: http://te3modelling.eu/. The code of SD models can be generated by means of the System Dynamics Model Documentation and Assessment Tool (SDM-Doc) (Martinez-Moyano, Citation2012). The application of the SDM-Doc to the TE3 model can be found here: http://www.te3modelling.eu/images/PDFs/Model_code.pdf. The data sources used in each model are listed in the aforementioned documentation resources (see section 3.1).
A more detailed description of the soft-linking process (recall the summarised view of ) is given below. Stepwise, the model coupling procedure is as follows:
The default simulation runs of PTTMAM and TE3 are separately loaded. The simulated battery cost and electric car sales compared with historical data (see in section 3.4 and in section 4.1.1);
As the evidence suggests that the simulated behaviour of the battery cost in TE3 is more plausible than in PTTMAM, we use the former to improve the fit to data. Battery capacities are updated in TE3 (see in section 3.4);
The “Base” scenario is created (see section 3.3) and simulated in both models. Note that, in contrast to a previous edition, EVI (Citation2018) does not show data on PHEV sales in India for the period 2005–2017. Thus the commercialisation of this powertrain in the Indian market is delayed in TE3 until 2020;
The output of the “Bus” and “Norway” models are imported into TE3 (see Figure A1 below);
The PTTMAM output (“Base pre-link”) related to EU28 annual BEV and PHEV sales is fed into TE3;
Causal links from battery demand from the added markets to cumulative battery manufacturing experience are created and the learning curve associated with the battery cost is recalibrated (see section 3.1). “Base post-link 1st” is run in TE3 (see in section 4.1.1);
We feed PTTMAM with the re-calibrated battery price curve starting in the year 2000, ensuring unit dimensional consistency, and re-run the model (“Base post-link 1st”). This completes the first model coupling iteration;
The PTTMAM output (“Base post-link 1st”) related to EU28 annual BEV and PHEV sales is fed into TE3;
The “Base post-link 2nd” run is executed in TE3 and the output sent to PTTMAM;
Before running the simulation in PTTMAM with the updated TE3 values, the causal link of the “RoW sales by size” variable, which influences the battery cost via component maturity, is de-activated as our goal is to use TE3 output instead. This completes the second model coupling iteration, which this time considers in PTTMAM the non-EU sales output from TE3. Next, we create the “Alternative” scenario (see section 3.3);
TE3 is fed with the most impactful policy combination under the “Alternative” scenario run in PTTMAM (see in section 4.1.2);
Finally, we update in TE3 CO2 emission targets and simulate electric car purchase incentives for China, India, Japan and the US (see – in section 3.4).
shows the future behaviour of two variables: annual battery demand from electric buses and annual electric car sales in Norway. These variables are determined in the “bus” and “Norway” models, respectively. The growth in battery demand from electric buses until 2030 comes from EU buses, as the model assumes annual electric bus sales in China remains stable post-2017. The results of the “Norway” model correspond to annual electric car sales under the S7 scenario (with demand kick) reported in Deuten et al. (Citation2020). The levelling-off the simulated series exhibits can be explained by growth in FCV sales. The values of these variables were fed into the TE3 model to account for electric bus and Norwegian electric car deployment (recall step four in ).
Figure A1. Simulated output of the “Bus” and “Norway” models
In this work, the French and German car markets in TE3 were not used to prevent double-counting as these markets are included in PTTMAM, where they exhibit a more realistic behaviour than in TE3 in their default simulation runs. shows this as well as information on the Japanese market that in part explains the gap observed in Fig. 5.
Figure A2. Annual electric car sales in France and Germany [left] and Japan [right], data versus simulation before model linkage
![Figure A2. Annual electric car sales in France and Germany [left] and Japan [right], data versus simulation before model linkage](/cms/asset/ec1dcb2f-3bbe-4b88-a759-f460d540912a/tjsm_a_1781556_f0014_b.gif)
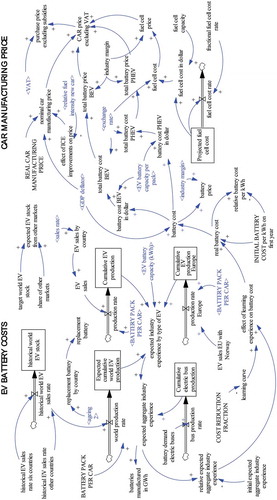
shows an excerpt of the TE3 model, highlighting the causal links in the “Production Cost” module. Two stock variables (Cumulative electric bus production and Cumulative EV production Europe) represent the links to the “Bus”, “Norway” and PTTMAM models.
Figure A3. Overview of the “production costs” module in the te3 model