
ABSTRACT
Urban form develops in close feedback with different modes of transportation. The introduction and adoption of automated vehicles (AVs) are expected to have an impact on the development of cities as well, as the use of AVs may, for example, lead to more efficient road use and less need for parking spaces. In order to study those impacts, we developed a geospatially disaggregated system dynamics (SD) model, through the use of subscripts, of the Copenhagen metropolitan region. We used this SD model to explore the consequences of 12 main uncertainties related to the introduction of AVs on urban development and develop future scenarios following the exploratory modelling and analysis methodology. Our analysis led to two distinct scenarios. In one scenario, AVs lead to more vehicle use, which leads to more urban sprawl and more congestion as a consequence. In the other scenario, more shared use of cars leads to less traffic and more open space in the city.
1. Introduction
Transportation technologies have historically shaped urban form. The car made it possible, through its flexibility, to live farther away from work, which resulted in urban sprawl (Schafer & Victor, Citation1997). By taking away the task of the driver, Level 4 and Level 5 (SAE International, Citation2016) automated vehicles (AVs) are potentially a new disruption on urban mobility. This is not yet a reality, but fully automated driving is expected to be introduced between 2030 and 2045 (Litman, Citation2014; Milakis, Snelder et al., Citation2017; Nieuwenhuijsen et al., Citation2018).
The luxury of not having to focus on the task of driving is one of the major expected benefits of vehicle automation. Not having to drive means that the utility of commuting could change. Full automation is likely to increase productivity and comfort during a trip, which potentially results in a lower value of travel time (De Correia et al., Citation2019). Regarding on-demand mobility, automated taxis could become cheaper, because the monetary compensation for the cab driver is no longer required, although costs for remote monitoring remain unknown (Liang et al., Citation2020; Wang et al., Citation2019). A cheaper, driverless taxi system may eventually discourage car ownership, and increase the utility of a shared vehicle (i.e., sequential vehicle use) system (Bagloee et al., Citation2016). Full automation may also mean that cars can park themselves, which is expected to be very valuable in urban transportation systems as it reduces the costs of driving and saves street space. However, a possible opposite effect of automated parking could be to increase empty vehicle kilometres due to the need to move to and from parking areas (De Correia & van Arem, Citation2016).
The effects of AVs are multiple, going from traffic capacity to equity in accessing activities (Milakis, van Arem et al., Citation2017) and can be quite diverse, and even contradictory. These effects are still mostly unexplored and ill quantified. However, modelling methods can help us explore scenarios and understand the potential impacts of such technology so that society can prepare and take advantage of what is coming while mitigating some of its potential pitfalls.
Research is more advanced on the effects of AVs on traffic flow characteristics. Simulation studies, for example, show that self-driving vehicles can drive more efficiently through the use of vehicle-to-vehicle (V2V) communication to streamline their road usage in terms of headways, speed, and lane changes (Van Loon & Martens, Citation2015). In general, studies show that traffic efficiency improves most when AVs are cooperative (Milakis, Snelder et al., Citation2017). Several simulation studies indicate that shared AVs could largely decrease the number of vehicles needed to satisfy the same travel demand, if passengers are willing to accept a slight increase in travel time. An agent-based model by the International Transport Forum (International Transport, F, Citation2015) used to explore different self-driving vehicle concepts, allowed to conclude that a fleet of shared AVs could reduce the number of vehicles needed down to 10% of the current fleet while delivering the same accessibility. Fagnant and Kockelman (Citation2014) and Rigole (Citation2014) came to similar conclusions in their research where commuter trips were allocated to a fleet of AVs: fewer than 10% of today’s cars could facilitate the same travel demand. Naturally, user acceptance of AVs and willingness to share trips may temper real fleet reductions.
In this research, we are concerned with the potential changes in land use in urbanised regions as a result of vehicle automation. From a land-use perspective, the adoption of AVs could hypothetically lead to denser urban cores with more buildings and less surface devoted to parking or even road infrastructure, as self-driving vehicles can distribute themselves more efficiently and park away from those central areas (De Correia & van Arem, Citation2016; Rodoulis, Citation2014). From a travel costs perspective, one could claim that the ability to perform other activities while driving would result in longer acceptable travel times, because passengers may be able to utilise their time in a vehicle (Gruel & Stanford, Citation2016). This would increase their willingness to live farther away from their workplaces, and again reinforce urban sprawl (Anderson et al., Citation2016; Zakharenko, Citation2016).
It is, however, hard to quantify the extent to which new vehicle features can affect the location choice of households thus on the urban form. A recent review aimed at presenting such references (Soteropoulos et al., Citation2019), but most of the studies that were reviewed did not model a land-use component and only focused on mobility changes. A usual relation between mobility changes and land use is connected to the number of required parking spaces, the space required for roads, and the redevelopment of these areas to make them more attractive. Studies that were found in that review show a significant reduction in on-street parking needs (Bischoff & Maciejewski, Citation2016; Zhang et al., Citation2015). Thakur et al. (Citation2016) used simple population/travel time relations to compute expected population changes in Melbourne and identify an increase in the outskirts. In a study of the Netherlands, Gelauff et al. (Citation2017) used the LUCA model, a spatial general equilibrium model, to explore the effects of AVs. They found that car automation results in population flight from cities, although public transport automation could have an opposite effect. Meyer et al. (Citation2017) compute accessibility changes due to AVs and conclude that AVs could cause another “quantum leap in accessibility”. Despite the existing body of knowledge, there is a clear lack of insights and methods to look at land-use changes. We intend to contribute to filling that gap with this research paper.
The sometimes contrasting or contradicting ideas in the literature about the impact of AVs also indicate that this topic is seemingly surrounded by “deep uncertainty” (Lempert et al., Citation2003). These authors defined deep uncertainty as “where analysts do not know, or the parties to a decision cannot agree on: (1) the appropriate conceptual models that describe the relationships among the key driving forces that will shape the long-term future, (2) the probability distributions used to represent uncertainty about key variables and parameters in the mathematical representations of these conceptual models, and/or (3) how to value the desirability of alternative outcomes.” This deep uncertainty is, however, not adequately handled in the existing literature. One way of dealing with deep uncertainty is by developing an “exploratory model” (Auping, Citation2018) and using this model to explore and analyse the impact of uncertainty, which is also known as “exploratory modelling and analysis” (Bankes et al., Citation2013).
In this paper, we propose a methodology based on a system dynamics (SD) (Forrester, Citation1961; Sterman, Citation2000) model. The aim is to uncover the relevant effects and understand what possible futures cities could be facing in the next decades as a result of fully automated vehicles. We will do this by using a spatially explicit, exploratory SD model to explore the bandwidth of AV impacts on urban development. The learnings from the literature are used to create uncertainty ranges for some important experimental factors: the penetration rate of AVs, the efficiency of vehicle operation, the value of travel time, the number of trips, the idle time of AVs, parking density, and ridesharing usage. Ridesharing in the model will be considered as a factor that reduces the number of vehicles required for a certain number of trips., Therefore, it is mostly related to the concept of carpooling whereby people get together and save vehicle kilometres travelled (Correia and Viegas, Citation2009). The model is developed for the Copenhagen metropolitan region to test its applicability to a real case-study but also to have some tentative insights into the effects of vehicle automation on urban land use.
The paper is structured as follows. In the second section, we will discuss the methodology that has been used for this research. This includes spatial SD and Exploratory Modelling. In the third section, we will discuss the Copenhagen Urban Development model which we developed and used in this research. In the fourth section, we will present the results of our research. In the fifth section, we present the conclusions from our research in two main scenarios. In the final section, we discuss the merits of the approach used in the paper.
2. Methodology
2.1. Spatial system dynamics
SD models consist of integral equations to keep track of behaviour through time of the system under analysis. These integral equations are used to represent and simulate feedbacks, delays, and accumulations. These also characterise the problem of urban development in relation to AV adaptation. Examples are the feedback between the preference for cars, traffic density, and travel time; the delay which exists on urban development, parking areas, and roads; and the accumulations of population, houses, and vehicles in any city (Ashkrof et al., Citation2019; De Correia et al., Citation2019, Citation2016; Nieuwenhuijsen et al., Citation2018).
Examples of SD models of urban development and mobility do exist. Purely about urban development, arguably the earliest example is Forrester’s Urban Dynamics (Forrester, Citation1969). Other examples exist as well, including literature focussed on housing (e.g., Eskinasi, Citation2014; Eskinasi et al., Citation2009), land use (e.g., Shen et al., Citation2009), the interplay between land use and infrastructure asset management (e.g., Havelaar et al., Citation2019), but SD literature also exists on the interplay between mobility and urban development (e.g., Alexandra et al., Citation2014; Cox et al., Citation2017; Pfaffenbichler et al., Citation2010).
Including a high number of spatial elements in SD models is, however, far from common practice. Yet there are a few examples. Some authors have tried to solve the issue of creating spatially explicit SD models by integrating an SD model in some way with a cellular-automata model (Han et al., Citation2009; Lauf et al., Citation2012). In one line of research (Pfaffenbichler, Citation2011; Pfaffenbichler et al., Citation2010), vectorisation (i.e., “subscripting” in SD language) was also used to model a limited number of zones in a model regarding land use and transport interaction. However, for multiple reasons not elaborated here, further integration of modelling formalisms like SD and, for example, agent-based modelling (Epstein & Axtell, Citation1996) could also be used to deal with spatial model components, but is expected to raise serious methodological challenges as well.
A solution for creating spatially explicit SD models is by making use of the vectorisation of variables explicitly for different spatial elements. This is known as subscripting in the SD modelling language we used, Vensim (Ventana Systems, Citation2010). The SD model we developed and used was made spatially explicit for the 860 different zones of the Copenhagen metropolitan region, our demonstration case study, by subscripting all relevant variables (i.e., practically all variables besides some global input parameters). These data were coupled to the SD model via a spreadsheet, making the length of the vectors (i.e., in this case the maximum number of zones) easy to adjust and potentially very high (e.g., hundreds to thousands). Input data for the zones are, besides the sociodemographic information per zone, also extracted based on the location of a zone. To do so, the zones are classified according to their corresponding districts and district type (i.e., city centre, other urban districts, suburbs, and rural areas). The vectorisation of the model allowed us to simulate continuous feedback between all zones. Therefore, this multi-scale modelling allowed us to obtain results and draw conclusions per zone, but also per district or district type within the Copenhagen metropolitan region.
2.2. Exploratory modelling and analysis
In order to explore the consequences of uncertainty, we make use of the exploratory modelling and analysis (EMA) methodology (Bankes, Citation2008; Bankes et al., Citation2013). In essence, this means that we do not generate a single run as a base case with our model, but a large number of runs as a base ensemble. This ensemble is generated by multivariate sampling over input uncertainties. These input uncertainties include both parametric uncertainties and switch parameters, which control structural uncertainties.
The base ensemble is used for scenario discovery. Scenario discovery (Bryant & Lempert, Citation2010) is a method to develop scenarios on the basis of the base ensemble which is done through selecting either potentially undesirable or desirable runs from the ensemble. Next, we use the patient rule induction method (PRIM; Friedman & Fisher, Citation1999) to identify which part of the input parameter space is responsible for the selected runs. These uncertainties can then be used to generate narratives similar to scenarios in older scenario schools. The major difference is that other scenario schools develop a storyline first (i.e., based on a small selection of uncertainties) and then simulate, while in scenario discovery, one simulates first, and generates storylines afterwards with a potentially far higher number of scenarios.
3. The copenhagen urban development model
We developed a spatially specific System Dynamics model to simulate the potential impacts of AVs on the urban development of the Copenhagen metropolitan region in Denmark. We used this model to explore the consequences of various parametric and structural deep uncertainties.
3.1. Conceptual overview
The Copenhagen Urban Development Model consists of five different submodels () simulating population, land use, traffic, parking, and modal split development. Each of the submodels is parameterised for all 860 zones in the metropolitan area. The model uses different penetration rates of AVs as scenario inputs. These scenarios are in essence based on the work by Nieuwenhuijsen et al. (Citation2018), but were adjusted to an earlier date following discussions with the municipality of Copenhagen (Copenhagen Municipality, Citation2017) and different experts (Underwood, Citation2014).
Figure 1. Sub-system diagram of the Copenhagen Urban Development Model
The population submodel consists of a four stock ageing chain (i.e., children, teens, adults, and elderly) and keeps track of the migration between zones. This migration depends both on the availability of housing and the attractiveness of zones. The attractiveness is calculated by using factors for the proximity of each zone to nature and city centre (static), and the fractions of roads and other land, excessive vacancy, and the accessibility to jobs (dynamic).
The land use submodel divides land use into allocated land and unallocated land. Allocated land is subdivided into five types of land use: business, housing, parking, road, and other. The unallocated land is used to simulate the transfer from one type of land use to another. This submodel further simulates the construction of buildings on business or housing land. This is done in an ageing chain which consists of three stocks: buildings under construction, buildings, and buildings being demolished.
The traffic submodel calculates the traffic volume. As the traffic volume in reality changes during the day and the model time step is in years, we used the morning peak traffic volume as reference. The peak traffic depends on the number of trips, which is a function of travel time and trip attraction. Furthermore, depending on the location of the zones that are generating and attracting traffic, several zones may have to be crossed in the path of the cars. The peak traffic influences the road width (i.e., the number of lanes needed to facilitate the traffic volume) in each zone, for which a three stock structure similar to the buildings is used.
The parking submodel calculates the amount of parking space available in a three stock structure subdivided into parking places under construction, parking places, and parking places demolished. The demand for parking spaces, according to which the availability will be adjusted, is determined based on the number of cars, which in turn depends on the number of cars per person and the population size. The number of cars per person can increase or decrease depending on the influence the penetration rate of AVs has on the feedback loops simulating ridesharing and the share of the population able to drive.
The modal split submodel brings together the impact of travel time, time looking for a parking spot, costs of parking, and input uncertainties on AV attractiveness, such as the penetration rate of AVs. The model differentiates in this way conventional vehicles and AVs. AVs can both be shared and privately owned.
3.2. Model validation
The model was tested both structurally and behaviourally to find out whether it was fit for purpose. Structurally, we checked whether all important elements of major feedbacks in the system (i.e., population dynamics, land use, traffic, parking, and modal split) were endogenously modelled, which they were.
Behaviourally, we first tested whether the population density in the model in early simulations corresponded to current knowledge of Copenhagen’s population density. Second, we checked whether the road and parking surface in each zone corresponded to the existing road network. This was far from trivial, as the data about the road network had to be calibrated over the zones by use of GIS software (QGIS) and OmniTRANS. Finally, by means of the uncertainty analysis and the fact that the model was parameterised for 860, sometimes very different, zones we performed a family member test. A family member test tests whether a model is general enough to be parameterised for a larger set of structurally similar, but parametrically different systems (Forrester & Senge, Citation1980). Examples could be population models that function regardless of parametrisation on different cities or countries. This test resulted in the conclusion that the model keeps functioning under these different conditions. The model is able to show how major urban land use categories like houses, road, and parking spaces might change over time when AVs are introduced.
3.3. Experimental setup
The model was developed making use of single precision Vensim version 7.1 (Ventana Systems, Citation2010) for Windows (x32). The model’s time horizon for each simulation was from 2015 to 2070, with time step 0.03125 year, and Euler integration (Euler, Citation1768). We simulated the model till 2070 based on the idea that we also want to take the last expected change in AVs into account with, in different scenarios, penetration rates of AVs between 45% and 70% in 2070.
We performed 5000 experiments with the model by use of the EMA workbench version 1.1.3 (Kwakkel, Citation2017, Citation2018) by Latin Hypercube sampling (McKay et al., Citation1979) over 12 uncertainties. The high number of experiments was necessary to get meaningful results from the PRIM analysis.
4. Results
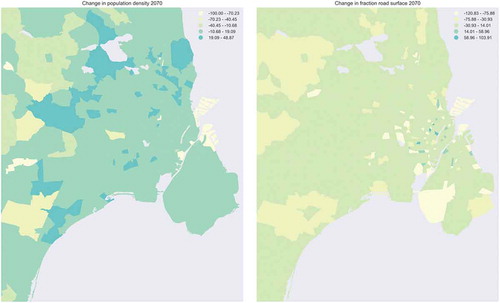
shows on the left the biggest average increase in population density until 2070 on the edges of the city. This change comes from a decreased value of time, which allows the population to live further from work. Simultaneously, we see on the right side of that the fraction of road decreases in almost all zones, apart from some zones in the city centre.
Figure 2. The average change in population density (left) and road surface (right) for all zones in the Copenhagen metropolitan region
shows that the fraction of road in city centres is expected to increase. Space has become available as the result of a stronger decrease in required parking space in city centres. The fraction of road in other urban districts is decreasing until AVs are introduced. Next, the surface could either increase or decrease, depending on the usage of AVs. Most cases lead to a slight further increase in the road surface, but this will not exceed the initial fraction of road surface in 2015.
Figure 3. Base ensemble change in road surface for city centre (a), other urban districts (b), and suburbs (c). The subplots on the right of (a), (b), and (c) show the density of runs in each value in the end state
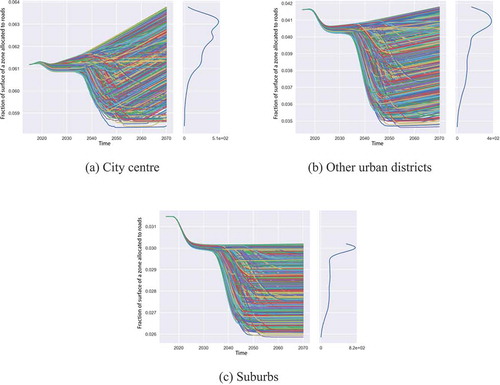
The fraction of road surface in the suburbs has a minimum of approximately 3%. The limit is a result of the allocation priority of all types of land. There is always a demand for housing and business surface in suburbs, so the newly allocated land for roads is limited due to its lower priority. Fluctuations occur because of the alignment of demand and supply of road surface. If there is capacity saturation, more roads need to be built and if there is too much capacity for the demand, roads are decommissioned. This leads to continuous adjustments to the road network if the demand and supply reach the thresholds for construction or decommissioning. Of course, our model uses a basic idea of infrastructure project development.
PRIM analysis of the decrease in road surface in other urban districts suggests that this decrease originates from a value of time above €7.20 per hour and with at least 18% of the population carpooling in any scenario with AVs. Scenarios for further decreases need an even higher value of time and an increase in ridesharing. Limiting the comfort of individual AV users and urging them to do carpooling, would thus improve the efficiency of the entire transportation system.
5. Conclusions
Two scenarios for the impact of AVs on urban development may be derived from this research. In the first scenario, cars become much more attractive, easier to use, and readily available for a broader public and multiple purposes. As a consequence, more private vehicles are bought and used, which results in more vehicles on the road, longer trips, and increased urban sprawl. Problems with scarcities in urban areas will consequentially grow as the need for road surface increases.
In the second scenario, automated driving technologies enhance a shared system in which people pool cars together. The utilisation of vehicles increases, which decreases their idle time and their need for parking. A lower number of vehicles is needed to support the demand for transport, which, under specific circumstances, leads to decreases in the required road surface. A shared system where more people use the same vehicle, either sequentially or by carpooling, helps to clear space from parking and road infrastructure and makes the city more attractive. The freed land can be used for other purposes. Nevertheless, if the shared system is not traditional carpooling, but some kind of transport network company, then the empty kilometres would also have to be taken into account.
6. Discussion
To the best of our knowledge, our research is the first illustration in literature that makes use of such extensive subscripting to make an SD model geographically specific, although the MARS model (Pfaffenbichler, Citation2011; Pfaffenbichler et al., Citation2010) uses subscripts as well for including a smaller number zones in a land-use transport interaction model. This approach proved very useful for this purpose. It allows the modeller to parameterise the model for very different locations, as some city districts have, for example, no population, while most do. At the same time, it is possible to model the feedback between the different locations. For many other research topics with spatial components, like land use or population-related issues, this may be a very useful technique of SD modelling.
The ability to make quickly runnable, geographically specific models without having to manage a large GIS database can be useful for decision-makers that want to look at the impacts of many different AV development patterns or policy options. However, our approach only uses the average width of roads per zone, which makes it consequentially insufficient to look at, for example, development of traffic congestion (Conceição et al., Citation2020).
Due to the geographically specific nature of our work, we used maps to depict part of the results. However, maps generally only allow a single data point per area. This makes it difficult to show the results of the uncertainty analysis, consisting of the modes of behaviour that the SD model generated. We presented average data for each zone and a specific moment in time on the maps, and averaged data for aggregate zones in the behaviour-over-time graphs. This is not ideal, as both graphs leave out part of the information generated with the model. Part of the solution, at least during the analysis, might be to use an interactive interface that allows the modeller to link zones to behavioural dynamics of the base ensemble. This would be similar to the work of Emberger et al. (Citation2009), yet also able to show the uncertainty bandwidth.
It should be noted that our approach leaves room for improvement, given the case we used to illustrate it. The model we developed and used did not include an explicit transportation network, while this is a common feature in existing literature on the effects of AVs in cities using other model approaches such as agent-based modelling (Martinez et al., Citation2015; Scheltes & de Correia, Citation2017). However, our model did incorporate endogenous and geospatially explicit development of land use, which is a contribution to the existing literature. Combining these two features, for example, in a hybrid SD and agent-based model could overcome this issue.
Acknowledgments
The authors would like to thank the municipality of Copenhagen for sharing their transportation and spatial data. We would like to thank Technolution B.V. for their help in programming related issues. Finally, we would like to thank the reviewers for their constructive and detailed comments.
Disclosure statement
No potential conflict of interest was reported by the authors.
References
- Alexandra, M., Jennie, C., Karen, W., Robin, K., David, R., & Alistair, W. (2014). The societal costs and benefits of commuter bicycling: Simulating the effects of specific policies using system dynamics modeling. Environmental Health Perspectives, 122(4), 335–344. https://doi.org/10.1289/ehp.1307250
- Anderson, J. M., Kalra, N., Stanley, K. D., Sorensen, P., Samaras, C., & Oluwatola, T. A. (2016). Autonomous vehicle technology: A guide for policymakers. Autonomous Vehicle Technology: A Guide for Policymakers. https://doi.org/10.7249/rr443-2
- Ashkrof, P., de Correia, G. H. A., Cats, O., & van Arem, B. (2019). Impact of automated vehicles on travel mode preference for different trip purposes and distances. Transportation Research Record: Journal of the Transportation Research Board, 2673(5), 607–616. https://doi.org/10.1177/0361198119841032
- Auping, W. L. (2018). Modelling uncertainty: Developing and using simulation models for exploring the consequences of deep uncertainty in complex problems [Delft University of Technology]. https://doi.org/10.4233/uuid:0e0da51a-e2c9-4aa0-80cc-d930b685fc53
- Bagloee, S. A., Tavana, M., Asadi, M., & Oliver, T. (2016). Autonomous vehicles: Challenges, opportunities, and future implications for transportation policies. Journal of Modern Transportation, 24(4), 284–303. https://doi.org/10.1007/s40534-016-0117-3
- Bankes, S. (2008). Exploratory modeling for policy analysis. Operations Research, 41(3), 435–449. https://doi.org/10.1287/opre.41.3.435
- Bankes, S., Walker, W. E., & Kwakkel, J. H. (2013). Exploratory modeling and analysis. In Gass, S. I., & M. C. Fu, (Eds.), Encyclopedia of operations research and management science (Vols. 532–537). Springer. https://doi.org/10.1007/978-1-4419-1153-7_314
- Bischoff, J., & Maciejewski, M. (2016). Simulation of city-wide replacement of private cars with autonomous taxis in Berlin. Procedia Computer Science, 83, 237–244. https://doi.org/10.1016/j.procs.2016.04.121
- Bryant, B. P., & Lempert, R. J. (2010). Thinking inside the box: A participatory, computer-assisted approach to scenario discovery. Technological Forecasting & Social Change, 77(1), 34–49. https://doi.org/10.1016/j.techfore.2009.08.002
- Conceição, L., de Correia, G. H. A., & Tavares, J. P. (2020). The reversible lane network design problem (RL-NDP) for smart cities with automated traffic. Sustainability, 12(3), 1226. https://doi.org/10.3390/su12031226
- Copenhagen Municipality. (2017). Analyse Af Københavns Kommunes Muligheder Og Udfordringer I Forbindelse Med Udviklingen Af Selvkørende Køretøjer. https://www.kk.dk/sites/default/files/edoc/5e1a7bb6-baad-491b-804d-b115a1b6b9d4/ac260228-f929-4f4a-a42a-b105d0e918ff/Attachments/18151346-23498478-14.PDF
- Correia, G., & Viegas, J. M. (2009). A conceptual model for carpooling systems simulation. Journal of Simulation, 3(1), 61–68. https://doi.org/10.1057/jos.2008.4
- Cox, L., Bassi, A., Kolling, J., Procter, A., Flanders, N., Tanners, N., & Araujo, R. (2017). Exploring synergies between transit investment and dense redevelopment: A scenario analysis in a rapidly urbanizing landscape. Landscape and Urban Planning, 167, 429–440. https://doi.org/10.1016/j.landurbplan.2017.07.021
- de Correia, G. H. A., Milakis, D., van Arem, B., & Hoogendoorn, R. (2016). Vehicle automation and transport system performance. In M. Bliemer, C. Mulley, & C. Moutou (Eds.), Handbook on transport and urban planning in the developed world (pp. 498–516). Edward Elgar Publishing. https://doi.org/10.4337/9781783471393
- De Correia, G. H. A., Looff, E., van Cranenburgh, S., Snelder, M., & van Arem, B. (2019). On the impact of vehicle automation on the value of travel time while performing work and leisure activities in a car: Theoretical insights and results from a stated preference survey. Transportation Research Part A: Policy and Practice, 119, 359–382. https://doi.org/10.1016/j.tra.2018.11.016
- de Correia, G. H. A., & van Arem, B. (2016). Solving the user optimum privately owned automated vehicles assignment problem (UO-POAVAP): A model to explore the impacts of self-driving vehicles on urban mobility. Transportation Research Part B: Methodological, 87, 64–88. https://doi.org/10.1016/j.trb.2016.03.002
- Emberger, G., Pfaffenbichler, P., & Riedl, L. (2009). MARS meets ANIMAP: Interlinking the model MARS with dynamic internet cartography. Journal of Maps, 6(1), 240–249. https://doi.org/10.4113/jom.2010.1079
- Epstein, J. M., & Axtell, R. L. (1996). Growing artificial societies: Social science from the bottom up. Brookings Institution Press.
- Eskinasi, M. (2014). Towards housing system dynamics. Projects on embedding system dynamics in housing policy research [Radboud University Nijmegen]. https://repository.ubn.ru.nl/bitstream/handle/2066/129859/129859.pdf
- Eskinasi, M., Rouwette, E., & Vennix, J. (2009). Simulating urban transformation in Haaglanden, the Netherlands. System Dynamics Review, 25(3), 182–206. https://doi.org/10.1002/sdr.423
- Euler, L. (1768). Institutionum calculi integralis volumen primum: Vol. II. Impensis Academiae Imperialis Scientiarum. https://scholarlycommons.pacific.edu/euler-works/342
- Fagnant, D. J., & Kockelman, K. M. (2014). The travel and environmental implications of shared autonomous vehicles, using agent-based model scenarios. Transportation Research Part C: Emerging Technologies, 40, 1–13. https://doi.org/10.1016/j.trc.2013.12.001
- Forrester, J. W. (1961). Industrial dynamics. MIT Press.
- Forrester, J. W. (1969). Urban dynamics. MIT Press.
- Forrester, J. W., & Senge, P. M. (1980). Tests for building confidence in system dynamics models. In A. A. Lagasto, J. W. Forrester, & J. M. Lyneis (Eds.), TIMS studies in the management sciences (Vol. 14, pp. 209–228). North-Holland Publishing Company.
- Friedman, J. H., & Fisher, N. I. (1999). Bump hunting in high-dimensional data. Statistics and Computing, 9(2), 123–143. https://doi.org/10.1023/A:1008894516817
- Gelauff, G., Ossokina, I., & Teulings, C. (2017). 1 introduction. Spatial effects of automated driving: dispersion, concentration or both? https://www.kimnet.nl/binaries/kimnet/documenten/papers/2017/09/19/spatial-effects-of-automated-driving-dispersion-concentration-or-both/Spatial+effects+of+automated+driving+_+dispersion%2C+concentration+or+both.pdf
- Gruel, W., & Stanford, J. M. (2016). Assessing the long-term effects of autonomous vehicles: A speculative approach. Transportation Research Procedia, 13, 18–29. https://doi.org/10.1016/j.trpro.2016.05.003
- Han, J., Hayashi, Y., Cao, X., & Imura, H. (2009). Application of an integrated system dynamics and cellular automata model for urban growth assessment: A case study of Shanghai, China. Landscape and Urban Planning, 91(3), 133–141. https://doi.org/10.1016/j.landurbplan.2008.12.002
- Havelaar, M., Jaspers, W., van Nederveen, S., Auping, W., & Wolfert, R. (2019). Multivariate simulation modelling for adaptive long-term infrastructure planning. Infrastructure Asset Management, 6(2), 129–137. https://doi.org/10.1680/jinam.18.00031
- international transport, f. (2015). urban mobility system upgrade: How shared self-driving cars could change city traffic (Issue 9783662458532). https://doi.org/10.1007/s10273-016-2048-3
- Kwakkel, J. H. (2017). The exploratory modeling workbench: An open source toolkit for exploratory modeling, scenario discovery, and (multi-objective) robust decision making. Environmental Modelling and Software, 96, 239–250. https://doi.org/10.1016/j.envsoft.2017.06.054
- Kwakkel, J. H. (2018). EMA workbench documentation release 1.1. https://emaworkbench.readthedocs.io/en/latest/
- Lauf, S., Haase, D., Hostert, P., Lakes, T., & Kleinschmit, B. (2012). Uncovering land-use dynamics driven by human decision-making – A combined model approach using cellular automata and system dynamics. Environmental Modelling & Software, 27–28, 71–82. https://doi.org/10.1016/j.envsoft.2011.09.005
- Lempert, R. J., Popper, S. W., & Bankes, S. C. (2003). Shaping the next one hundred years: new methods for quantitative, long-term policy analysis (Issue MR-1626). http://www.rand.org/pubs/monograph_reports/2007/MR1626.pdf
- Liang, X., de Correia, G. H. A., An, K., & van Arem, B. (2020). Automated taxis’ dial-a-ride problem with ride-sharing considering congestion-based dynamic travel times. Transportation Research Part C: Emerging Technologies, 112, 260–281. https://doi.org/10.1016/j.trc.2020.01.024
- Litman, T. (2014). Autonomous vehicle implementation predictions: Implications for transport planning (Issues 0-7803-3213–X). https://doi.org/10.1613/jair.301
- Martinez, L. M., de Correia, G. H. A., & Viegas, J. M. (2015). An agent-based simulation model to assess the impacts of introducing a shared-taxi system: An application to Lisbon (Portugal). Journal of Advanced Transportation, 49(3), 475–495. https://doi.org/10.1002/atr.1283
- McKay, M. D., Beckman, R. J., & Conover, W. J. (1979). A comparison of three methods for selecting values of input variables in the analysis of output from a computer code. Technometrics, 21(2), 239–245. http://www.jstor.org/stable/1268522
- Meyer, J., Becker, H., Bösch, P. M., & Axhausen, K. W. (2017). Autonomous vehicles: The next jump in accessibilities? Research in Transportation Economics, 62, 80–91. https://doi.org/10.1016/j.retrec.2017.03.005
- Milakis, D., Snelder, M., van Arem, B., van Wee, B., & de Correia, G. H. A. (2017). Development and transport implications of automated vehicles in the Netherlands: Scenarios for 2030 and 2050. European Journal of Transportation and Infrastructure Research, 17(1), 63–85. https://doi.org/10.18757/ejtir.2017.17.1.3180
- Milakis, D., van Arem, B., & van Wee, B. (2017). Policy and society related implications of automated driving: A review of literature and directions for future research. Journal of Intelligent Transportation Systems, 21(4), 324–348. https://doi.org/10.1080/15472450.2017.1291351
- Nieuwenhuijsen, J., de Correia, G. H. A., Milakis, D., van Arem, B., & van Daalen, E. (2018). Towards a quantitative method to analyze the long-term innovation diffusion of automated vehicles technology using system dynamics. Transportation Research Part C: Emerging Technologies, 86(May2017), 300–327. https://doi.org/10.1016/j.trc.2017.11.016
- Pfaffenbichler, P. (2011). Modelling with systems dynamics as a method to bridge the gap between politics, planning and science? Lessons learnt from the development of the land use and transport model MARS. Transport Reviews, 31(2), 267–289. https://doi.org/10.1080/01441647.2010.534570
- Pfaffenbichler, P., Emberger, G., & Shepherd, S. P. (2010). A system dynamics approach to land use transport interaction modelling: The strategic model MARS and its application. System Dynamics Review, 26(3), 262–282. https://doi.org/10.1002/sdr.451
- Rigole, P.-J. (2014). Study of a shared autonomous vehicles based mobility solution in Stockholm. http://www.diva-portal.org/smash/record.jsf;jsessionid=kS81CXqhOs0_dmrLKUFTDaNVPVCycHsxfNNBxBRF.diva2-search7-vm?pid=diva2:746893&dswid=4734
- Rodoulis, S. (2014). The impact of autonomous vehicles on cities. Journeys - Sharing Urban Transport Solutions, 12, 12–20. http://www.lta.gov.sg/ltaacademy/doc/Journeys_Issue_12_Nov_2014.pdf#page=14
- SAE International. (2016). Summary of SAE international’s levels of driving automation for on-road vehicle. Global Ground Vehicle Standards, J3016. https://www.sae.org/standards/content/j3016_201609/
- Schafer, A., & Victor, D. (1997). The past and future of global mobility. Scientific American, October, 36–39. doi:10.1038/scientificamerican1097-58
- Scheltes, A., & de Correia, G. H. A. (2017). Exploring the use of automated vehicles as last mile connection of train trips through an agent-based simulation model: An application to Delft, Netherlands. International Journal of Transportation Science and Technology, 6(1), 28–41. https://doi.org/10.1016/j.ijtst.2017.05.004
- Shen, Q., Chen, Q., Tang, B., Yeung, S., Hu, Y., & Cheung, G. (2009). A system dynamics model for the sustainable land use planning and development. Habitat International, 33(1), 15–25. https://doi.org/10.1016/j.habitatint.2008.02.004
- Soteropoulos, A., Berger, M., & Ciari, F. (2019). Impacts of automated vehicles on travel behaviour and land use: An international review of modelling studies. Transport Reviews, 39(1), 29–49. https://doi.org/10.1080/01441647.2018.1523253
- Sterman, J. D. (2000). Business dynamics: Systems thinking and modeling for a complex world. McGraw.
- Thakur, P., Kinghorn, R., & Grace, R. (2016). Urban form and function in the autonomous era. Australasian Transport Research Forum Proceedings, November, 15. https://www.australasiantransportresearchforum.org.au/sites/default/files/ATRF2016_paper_138.pdf
- Underwood, S. (2014). Automated vehicles symposium attendee survey results. Automated Vehicles Symposium, San Francisco, California, United States. https://www.automatedvehiclessymposium.org/avs2014/program/tuesday
- Van Loon, R. J., & Martens, M. H. (2015). Automated driving and its effect on the safety ecosystem: How do compatibility issues affect the transition period? Procedia Manufacturing, 3, 3280–3285. https://doi.org/10.1016/j.promfg.2015.07.401
- Ventana Systems. (2010). Vensim reference manual. Ventana Systems. http://www.vensim.com/documentation.html
- Wang, S., de Correia, G. H. A., & Lin, H. X. (2019). Exploring the performance of different on-demand transit services provided by a fleet of shared automated vehicles: An agent-based model. Journal of Advanced Transportation, 2019, 1–16. https://doi.org/10.1155/2019/7878042
- Zakharenko, R. (2016). Self-driving cars will change cities. Regional Science and Urban Economics, 61, 26–37. https://doi.org/10.1016/j.regsciurbeco.2016.09.003
- Zhang, W., Guhathakurta, S., Fang, J., & Zhang, G. (2015). Exploring the impact of shared autonomous vehicles on urban parking demand: An agent-based simulation approach. Sustainable Cities and Society, 19, 34–45. https://doi.org/10.1016/j.scs.2015.07.006
