
 ?Mathematical formulae have been encoded as MathML and are displayed in this HTML version using MathJax in order to improve their display. Uncheck the box to turn MathJax off. This feature requires Javascript. Click on a formula to zoom.
ABSTRACT
As an electrical vehicle (EV) power source, a lithium-ion battery (LIB) is essential in enabling electric mobility growth. However, the high LIB cost, evolving LIB electrode chemistry, and EV range anxiety limit LIBs' market growth. In this paper, we present a system dynamics model to analyse the interrelationship between battery capacity (Battery OEMs), battery electrode composition, range anxiety (EV owners), subsidy (Government), and their effect on LIB cost (per kWh) and market demand. Our study shows that range anxiety's impact on EV sales diminishes with average battery capacity increment. Higher LIB subsidy and low raw materials costs (based on battery capacity and LIB electrode composition) will result in higher LIB demand. We observe that LIB demand increases even when no subsidy exists. Our study will help the government and the industry to contextualise the subsidy policy and marketing strategies for LIBs for different consumer segments.
1. Introduction
The decarbonisation of road transportation is imperative to achieving an overall reduction in global carbon emissions. In 2019, the transport sector accounted for 24% of global-energy-related CO2 emissions, of which road transport (passenger vehicles, buses, and two-three wheelers) accounts for 74% (Pales et al., Citation2020). Electric Vehicles (EVs), by virtue of their “zero tailpipe emission”, will play a significant role in reducing this carbon emission. The substitution of internal combustion engine (ICE) vehicles with EVs in the fleet has the impressive potential to reduce greenhouse gas (GHG) by one-half to two-thirds in 2030 (Abergel et al., Citation2020). However, GHG emissions reduction will depend on the successful penetration of EVs in the road transport segment.
The market share of EVs is predominantly controlled by their price and driving range – both these parameters are strongly influenced by the Lithium-Ion Battery (LIB) that stores the electrical energy of the EV. The high energy and power density, low self-discharging, long cycle and calendar life, and safety in various operating conditions make LIB the preferred choice for EVs (Zhang et al., Citation2019).
Making affordable EVs depends on our ability to reduce the cost of LIB as it contributes to 30–40% of the cost of EV (V. Henze; BloombergNEF, December 16, Henze, Citation2020). LIBs’ cost reduction per kWh (battery cost per energy unit) depends on LIB demand (Kittner et al., Citation2017; Nykvist et al., Citation2019). An increase in EV sales, the need for a larger battery capacity (for EV range enhancement), and LIB replacement contribute to the demand for LIBs.
EV sales depend on the cost of LIB, the subsidy given on EVs, and range anxiety related to EVs (Goel et al., Citation2021). EV subsidy depends on government policies, whereas LIB cost and range anxiety depend on LIB chemical composition and battery capacity (Abergel et al., Citation2020; Azevedo et al., Citation2018; Bibra et al., Citation2021; Pevec et al., Citation2020). Subsidy reduces the EV upfront cost and boosts the LIB demand through EV sales increment (Huang et al., Citation2021). United States of America (USA) offers US$ 7500 as an initial subsidy that gradually decreases as original equipment manufacturers (OEMs) EVs sales reach 2,00,000 units (Abergel et al., Citation2020), whereas, in China, the direct subsidy varies between (13,000–18,000) Yuan in 2021 based on the difference in EV range (C. Shi; metalbulletin.com, January 05, Shi, Citation2021).
LIBs used in EVs differ in the battery capacity of LIB. The battery capacity of a LIB is the total energy stored in a given battery and altered by varying battery mass and energy density. Large capacity LIBs enable EVs to cover long distances than low-capacity LIBs leading to a more extended range (Myung et al., Citation2017). Hence, large capacity LIBs improve the EV range that alleviates the consumer’s perception of “Range anxiety”. “Range anxiety” is defined as the psychological barrier that forces drivers to think that due to the limited capacity of the battery used in EVs, EVs will be unable to cover their daily driving range requirement (Pevec et al., Citation2020). Hence, the range enhancement by using a large capacity battery can reduce the range anxiety, but EVs’ costs increase by using a battery having a larger capacity (Lim et al., Citation2015).
Apart from alleviating the range anxiety and increasing LIB cost, battery capacity also influences the charging behaviour of EV users. Large battery capacity enhances EV range and reduces EVs’ charging requirement to meet the daily travelling requirement. An increased charging frequency decreases the cycle life of LIB. EV needs LIB replacement for proper functioning when it reaches the cycle life limit (Beuse et al., Citation2020). LIBs having smaller cycle life needs more replacement (Hao et al., Citation2019). An increase in LIB replacement will boost LIB demand and increase the total battery capacity installed for EVs.
Battery capacity also determines the quantity of active and inactive materials in a battery pack. LIB’s price depends on the amount of these materials in a battery pack as material cost constitutes 50–60% of the cost of a battery pack (Nelson, Bloom, & I Dees, Nelson et al., Citation2011). An increase in raw material price will upend the downward trend of battery cost per kWh by increasing the total cost of raw material used for LIB (J. Wong; The Wall Street Journal, July 22, Wong, Citation2021). Apart from battery capacity, electrode chemical composition also impact the raw material requirement. LIB electrode composition differs in the molar ratio of raw material used for electrode, impacting the raw material demand that causes raw material price fluctuation.
It is evident that the interrelationship between the factors influencing the demand for LIB is quite complex. Complexity arises due to interaction among variables through a feedback loop, delay in realising the impact, and non-linearity due to interaction among variables. An increase in battery capacity increases the battery range, battery cost, material demand, and LIB cost. In contrast, subsidy reduces the EV upfront cost but is available for time bound as it increases the financial burden on government (Shepherd et al., Citation2012; Till et al., Citation2019). Apart from this, variation in electrode composition impacts the raw material demand, which affects the LIB cost per kWh. Hence, developing a systemic framework that captures a dynamically complex system’s qualitative and quantitative aspects is imperative due to interconnection and interdependence among variables. System dynamics is a widely used methodology to explore the dynamics of complexity that arises due to interrelationship among variables that coexist in the electric mobility market and impact the market dynamics (Gómez Vilchez & Thiel, Citation2020; Keith et al., Citation2020; Kieckhäfer et al., Citation2014; Shepherd et al., Citation2012; Struben, Citation2006; Thies et al., Citation2016; Vilchez & Jochem, Citation2019). Hence, we develop a system dynamics (SD) model that explores interrelation among variables that are impacting the LIB market and conduct in-depth analysis in three directions:
How does the interrelationship between range anxiety and battery capacity impact the LIB demand fluctuations in the battery market?
What will be the impact of subsidy variations on LIB demand?
How does the consumers’ adoption of different battery chemistry impacts the LIB market?
System dynamics methodology is widely used for understanding the strategic impact of resource allocation (Gary et al., Citation2008; Kunc & Morecroft, Citation2007; Kunc et al., Citation2017), diffusion of alternative power-train (Harrison & Thiel, Citation2017; Keith et al., Citation2020; Kieckhäfer et al., Citation2014; Thies et al., Citation2016), automobile service sector (Bagodi & Mahanty, Citation2006, Citation2013), impact of financial support on alternative power-train diffusion (Harrison et al., Citation2016; Keith et al., Citation2020; Pratap et al., Citation2020) and many more areas. This is the first attempt, to the best of our knowledge, to apply the system dynamics model to analyse LIB market dynamics and the impact of range anxiety on LIB demand. We consider NMC variants and NCA batteries in this study as these LIB variants are widely used in the automobile sector (Abergel et al., Citation2020; Pillot, Citation2019). We consider variables such as the driving range of EV, range anxiety, LIB capacity, government subsidy, and LIB electrode material composition and cost and analyse their impact on the LIB cost and demand. The model results highlight that battery capacity increment reduces the range anxiety, and capacity increment ceases when range anxiety reduces to zero. EV sales increase with the reduction in range anxiety, increasing the LIB demand in the market. Battery capacity and raw material composition of electrodes both impact the material cost per kWh for LIB. LIB has a low material cost per kWh based on battery capacity, and electrode composition has high LIB demand. For high capacity LIB, range anxiety reduces to zero earlier than low capacity LIB, and after-that learning impact has a dominant impact on LIB demand and LIB cost per kWh. Apart from this, the high subsidy given in the initial phase of simulation will increase the LIB demand compared to the case when the subsidy value is low in the initial stage, and this increasing trend in the market continues even after the withdrawal of the subsidy. Our analysis reveals specific unique observations, such as an increase in LIB demand even when no subsidy exists.
This paper is organised as follows: Section 2 presents a literature review. Section 3 explains the causal loop diagram, stock and flow structure, and variables. Section 4 discusses the simulation results, and Section 5 summarises the key findings.
2. Literature review
Across the globe, various researchers are working on LIB to enhance LIB’s performance and affordability. Researchers focus on ways to improve the battery electrode composition that lowers the LIB cost (Cano et al., Citation2018), enhance LIB’s energy density (Wu et al., Citation2020), develop LIB with improved architecture (Abergel et al., Citation2020), and improve charging infrastructure (Bonges & Lusk, Citation2016). Apart from this, researchers also focus on ways to mitigate range anxiety (Lin, Citation2014; Xu et al., Citation2020) and explore the learning effect on LIB cost per kWh (Hsieh et al., Citation2019; Kittner et al., Citation2017).
Literature indicates that LIB demand and cost per kWh are impacted by various factors. These factors are interlinked to form a complex structure, and their behaviour depends on the domination of various feedback loops. Many models are developed to predict EVs’ market share influenced by LIBs’ demand. We adopt the ideas proposed in the system dynamics part of the hybrid simulation model of Kieckhäfer et al. (Citation2014). The cost of EVs affects their demand, which can be checked through government subsidies.
We explore the following topics previously found in the literature: impact of subsidies on EV sales, material cost, battery life, learning effect impact on LIB demand, and range anxiety impact on EV sales.
Subsidies: Government subsidies on the price of EVs are improving their market share. Shepherd et al. (Citation2012) analyse the market share of EVs based on the amount and duration of subsidies given to EVs based on the SD model. They find that EV market share increased from 0.54% to 4.78% in the scenario when a subsidy of 5000 is provided for six years. Wee et al. (Citation2018) analyse the impact of the state’s model-specific EV policies on EV sales and find out that for subsidy increase of US$ 1000 on a specific model will lead to a 5–11% rise in registration of that model. Li et al. (Citation2020) explore the impact of subsidy on battery electric vehicles (BEV) sales using cues utilisation theory and state that for every 1% increase in subsidy, BEV sales will go up by around 0.075%. Pratap et al. (Citation2020) develop an SD model to analyse the impact of critical raw material and subsidy on EV demand and found that an increase in the subsidy will reduce the demand fluctuation of EVs.
Material costs: LIB demand, battery capacity, and LIB electrode (cathode and anode) chemical composition significantly impact raw material demand. LIBs are available in different variants like lithium cobalt oxide (LCO), lithium manganese oxide (LMO), lithium iron phosphate (LFP), lithium nickel cobalt aluminium oxide (NCA), lithium nickel manganese cobalt oxide (NMC) which are commercialised and lithium-air (Li-air), lithium-sulphur (Li-S), sodium-ion battery, Zinc-air batteries, and solid electrolyte LIB are considered as future LIB variants (Cano et al., Citation2018; Nitta et al., Citation2015; Van Noorden, Citation2014). These LIB variants differ in electrode chemical composition and influence the LIB market demand (Cano et al., Citation2018; Van Noorden, Citation2014). Increased LIB demand and use of high capacity LIB will increase the raw materials demand. Higher demand for raw materials for LIB leads to an increase in the price of raw material (Ciez & Whitacre, Citation2016). Azevedo et al. (Citation2018) estimate that in 2018, raw material used in cathode will contribute 10% of the EV battery pack cost. Ahmed et al. (Citation2017) states that cathode active material will contribute more than 20% of the cost of NMC batteries. Vaalma et al. (Citation2018) analysed the impact of change in raw material price on total battery cost and found that total battery cost increased by 5.7% by increasing the price of lithium carbonate by 4 times. Amit and Venugopal (Citation2018) develop the SD model to examine the effect of supply-demand dynamics of LIB raw materials on electric mobility transition.
LIB capacity: Another factor that influences the cost of LIBs is their capacity. LIB capacity is determined by LIB mass and energy density of LIB. Depth of discharge (DOD) and end-of-life (EOL) value (the time when battery capacity reaches 80% of their nominal capacity value) has a substantial impact on battery capacity (Beuse et al., Citation2020; Bubeck et al., Citation2016). The LIB pack’s energy density depends on the electrode chemistry, battery mass, and EV architecture, and for given electrode chemistry, it has a fixed upper bound value (Quinn et al., Citation2018). LIB mass varies with the amount of active and inactive materials in the battery pack. Raw material proportion inside electrodes will decide the battery’s energy storage capacity. Hence, the quantity of active materials in the LIB pack will influence the battery capacity and the weight of LIB.
Range anxiety: Technologically improved LIBs with high energy density and large battery capacity will enhance the range of EVs. Range enhancement alleviates the “Range anxiety” which is defined as psychological obstacles in the mind of potential EV adopters regarding range limitation of EVs due to limited battery size (Pevec et al., Citation2020). Range-related apprehensions are the leading cause of range anxiety. Pearre et al. (Citation2011) states that 355 miles range of EV covers the maximum distance travelled by all the customers, whereas Cano et al. (Citation2018) explores that range of more than 300 miles will meet the demand of most consumers. Research focuses on developing charging infrastructure and charging station layout as a strategy to minimise the range-related psychological barriers in potential adopters. Melliger et al. (Citation2018) performed a focus group study to explore the range requirement for car users and found that battery electric vehicles friendly infrastructure policy will increase the “BEV-potential” to 100% (BEV-potential is used as a measure to estimate whether range requirement of the consumer is fulfilled or not).
LIB life: EV life and consumer driving behaviour will impact EV demand and battery replacement. Shepherd et al. (Citation2012) explored that reduction of EVs life from 14 years to 10 years will increase the number of vehicles discarded per year and increase the total new vehicle registration. Lower cycle life LIB needs more replacement and hence increases the total demand of LIB. Still, the replacement cost of LIB will increase the total cost of ownership of EVs when EVs accommodate battery replacement (Bubeck et al., Citation2016). Beuse et al. (Citation2020) stated that battery replacement depends on calendric and cyclic lifetime. Calendar life is a technology-specific value, whereas cycle life is defined as the number of charge/discharge cycles that LIB supports before its capacity fades to 80% of its initial value (Goodenough, Citation2012). Daily charging frequency and days of use of EVs per year limit the cycle life of LIBs. Franke and Krems (Citation2013a) conducted a field study for six months on 79 EV users and found out that, on average, users charged their EVs three times per week. Yang et al. (Citation2018) analyse the data collected by Shanghai Electric Vehicles Data Center (SHEVDC) and state that the average daily charging varies from 0.2 to 1.6.
These studies provide context for our research by identifying the key variables. Based on the literature, it is evident that uncertainty in EVs demand, market volatility, price variability of raw material based on LIB electrode chemistry, continual development in performance characteristics, and continuously changing government policies in terms of subsidy bring considerable uncertainty in the demand estimation of LIBs. The coexistence of these variables makes demand estimation of LIBs a complex phenomenon. System dynamics, developed by Professor Jay Forrester in the mid-1950s, is a widely used tool to analyse these complex phenomena (Abbas & Bell, Citation1994; Shao & Jin, Citation2020; Sverdrup, Citation2016; Thies et al., Citation2016). Hence, in this paper, we use system dynamics modelling to analyse the LIB market’s evolution based on interaction among variables that govern EVs’ mass penetration and LIB replacement.
3. Methods
Rapid growth in EV market diffusion, varying government policies regarding purchase subsidy, the demand for high-range EVs, and continually evolving battery chemistry bring dynamic complexity to the LIB market. These factors are interlinked with each other through the feedback system. Hence, we must develop a holistic, systematic framework to explore the LIB market complexity. System dynamics modelling is a widely used methodology to understand the dynamically complex system dominated by feedback loops (Bagodi & Mahanty, Citation2013; Gómez Vilchez & Thiel, Citation2020; Keith et al., Citation2020; Kieckhäfer et al., Citation2014; Kunc & Morecroft, Citation2007; Shepherd et al., Citation2012). Hence, we use the system dynamics approach to model the LIB market ecosystem dynamics due to variability in LIB affordability and performance characteristics. LIB cost, LIB capacity, and raw material price fluctuations influence LIB affordability, whereas LIB performance is altered by changing battery capacity and electrode chemical composition. We integrate equations from the system dynamics part of the hybrid simulation model of Kieckhäfer et al. (Citation2014) and Thies et al. (Citation2016) to draw the mathematical framework for our simulation model. Apart from this, we integrate variations in subsidy, battery capacity, and range anxiety impact on EV sales that impact the LIB demand in the model. Variations in the battery capacity affect the range anxiety and LIB cost by balancing and reinforcing feedback loop.
3.1. Causal loop diagram
A causal loop diagram (CLD) provides a framework that helps in visualising a dynamically complex system that contains feedback, delays, and non-linearity (Gary et al., Citation2008; Senge & Sterman, Citation1992). Complexity in the model arises due to interconnection and interrelationship among variables linked with each other by a causal linkage that creates feedback (Bagodi & Mahanty, Citation2006; Kunc & Morecroft, Citation2007; Wolstenholme & Coyle, Citation1983). CLD has three main components: causal links (shown by arrows) that represent variable relation, loop polarity represented by positive (+) or negative (-) sign to indicate the change in the dependent variable in case of change of independent variable, and loop identifier.
In this section, we explore the causal relationship among variables using a CLD that provides the theoretical background for developing the system dynamics model. Battery capacity, subsidy, LIB electrode composition, and range anxiety are variables interlinked through linkage to create a dynamically complex system containing feedback and delays that impact the LIB demand. shows the causal loop diagram (CLD) to estimate the demand for LIBs. CLD represents the causal relationships between various variables in the system. We identify four feedback loops in the system: balancing loops – “Battery capacity dynamics”, “LIB demand-replacement cycle”, “Range anxiety cycle” and a reinforcement loop –:Learning effect”.
Figure 1. Causal loop diagram.
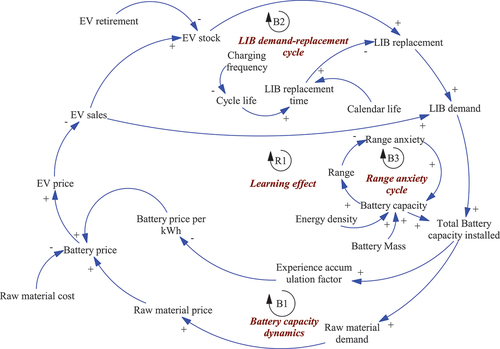
• Balancing loop, B1 – Battery capacity dynamics: Total Battery capacity installed
Raw material demand
Raw material price
Battery price
EV price
EV sales
LIB demand
Total Battery capacity installed
“Total Battery capacity installed” loop explains the impact of the variations in total battery capacity installed on LIB cost. In this loop, the total battery capacity installed is defined as the product of the battery capacity of a LIB and LIB demand, as shown in . The total battery installed increases with an increase in LIB demand. Raw material demand increases with the increment in total battery capacity installed in EVs, which leads to a surge in battery price. EV price will increase with the battery price, reducing EV sales. EV sales and EV socks influence LIB demand. Reduction in EV sales EV stock (reduces the LIB replacement) reduces the LIB demand.
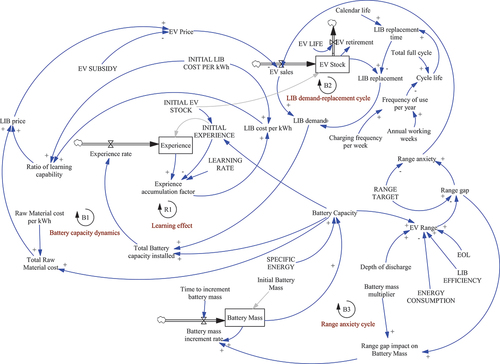
Figure 2. Stock-flow diagram.
• Balancing loop, B2 – LIB demand-replacement cycle: Battery price
EV price
EV sales
EV stock
LIB replacement
LIB demand
Total Battery capacity installed
Raw material demand
Raw material price
Battery price
An increase in battery price will decrease EV sales, reducing EV stock. LIB replacement depends on EV stock. Hence, a decrease in EV stock with the reduction of EV sales will decrease the quantity of LIB that needs replacement. As LIB demand depends on EV sales and LIB replacement, a decrease in EV sales and LIB replacement will reduce LIB demand, leading to a reduction in raw material demand, raw material price, and battery price.
• Balancing loop, B3 – Range anxiety cycle: Battery capacity
Range
Range anxiety
Battery capacity
Battery capacity increment leads to an increase in EVs’ range as more energy is available for EVs to cover the travelling requirement of consumers. Range enhancement reduces range-related anxiety and hence, minimizes range anxiety. As the range anxiety reduces, it will reduce further increment in the battery capacity that ceases when range anxiety becomes zero.
• Reinforcing loop, R1 – Learning effect: Total Battery capacity installed
Experience accumulation factor
Battery price per kWh
Battery price
EV price
EV sales
LIB demand
Total Battery capacity installed
Increment in total battery capacity installed in EVs leads to an increased accumulated experience that reduces the LIB cost per kWh through the learning effect of economies of scale. According to the learning curve concept (governed by a power law), an increase in cumulative LIB installed will lead to a declining trend in battery production costs per kWh. EV price reduces with the decreases in battery price, increasing EV sales and LIB demand.
3.2. Stock and flow diagram
The Stock and Flow Diagram (SFD) captures mathematical relationships between variables. A stock and flow diagram provide the framework for model simulations. represents the SFD of the model. We use Vensim®Pro Software (Version 6.4E) to build the SFD. Model variables are categorised as stock, flow, and auxiliary. A rectangular box symbolises stock variables, whereas a valve symbol represents flow variables, and no symbol is used for auxiliary variables. A stock variable represents the level or inventory value at a given time. The flow variable expresses the rate of quantities changes to or from a given stock. It is always expressed as a function of time. Stock variables are changed based on variations in flow variable values. Clouds outside the model boundary represent the source or sink of the flow variable. has some feedback loops that represent non-linearity due to interaction among variables that impact the LIB demand. Those loops are represented as feedback loop learning effect, range anxiety, LIB demand-replacement cycle, and battery capacity dynamics. Detailed explanation of model variables are included in Appendix Section A.
4. Results and discussion
We use Vensim® Pro Software (Version 6.4E) to develop the model that is simulated for 15 years with INITIAL TIME = 0, FINAL TIME = 15, and TIMESTEP being 0.25 years. In this section, we explore the impact of variations in battery capacity, subsidy, and LIB electrode composition on LIB demand and LIB cost per kWh by conducting a scenario analysis. In each defined scenario, battery capacity is incremented yearly during the simulation period to mitigate the impact of range anxiety by battery mass increment. Battery mass increment ceases when the range anxiety becomes zero. In Scenario 1, a different initial battery capacity is selected for each EV, whereas we fixed the battery capacity in Scenario 2 and Scenario 3. LIB electrode composition varies in Scenario 3 whereas, in scenarios (Scenario 1 and Scenario 2), we consider only the NMC622 battery electrode. In all scenarios, subsidy varies according to scenarios defined in in Appendix Section A.
Different scenarios are analysed in the format of “XY”, where X is battery capacity in kWh, Y represents subsidy in US$ defined by different scenarios in for each EV. Battery capacity varies between “60–90” kWh, and charging frequency has fixed value 3 cycles per week (Beuse et al., Citation2020; Franke & Krems, Citation2013b) for all scenarios. We derive subsidy values based on data published on the government website and (Abergel et al., Citation2020; Till et al., Citation2019). Based on scenarios, subsidy varies in periods 3, 6, and 9 by using “STEP” function in Vensim as shown in . “SUB5” indicates that subsidy withdrawal during the simulation period, and hence there is no subsidy on EV purchase in this scenario.
4.1. Model validation
We followed various validation methods mentioned in the literature to ensure the appropriateness of our model for the analysis (Barlas, Citation1989, Citation1996; Taylor et al., Citation2010). We performed some tests to accumulate confidence about our model’s usefulness, applicability, and simplicity (Ford & Flynn, Citation2005) as we have no method that establishes the correctness of the system dynamics model.
Structural validity tests help validate the model’s resemblance to a real-world system. We believe our model can be validated for structural soundness and appropriateness using structural validity tests for the following reasons: (1) Our model structure is similar to existing simulation models that analyse the LIB demand variation in literature. (2) The equations connecting the model variable are checked for connection with the existing system and dimensional consistency. (3) Equation connecting variables are based on well-defined theories, such as learning effect, range anxiety, battery capacity, etc., defined in the literature.
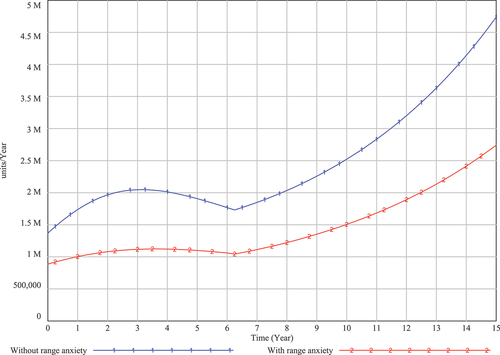
Apart from this, we conduct a structure-oriented behaviour test to detect structural flaws in the SD model by assigning extreme values to the model variables (Barlas, Citation1996). The model is tested for the following scenarios: (1) Range anxiety has no impact on EV sales and the condition in which range anxiety impacts EV sales. (2) Impact of varying charging frequency on LIB demand. In both scenarios, we consider average battery capacity as 60kWh for NMC622 LIB, subsidy on EV purchase as SUB 1 (scenario defined in Appendix Section A, ), and charging frequency between 1 and 7 cycles/week. shows the variations in LIB demand in the scenario “60SUB1” when range anxiety impacts the EV sales. This condition is denoted by label “With range anxiety”, and label “Without range anxiety” denotes the condition when range anxiety does not impact EV sales. In , LIB demand reaches 4.73 million units/year under condition “Without range anxiety” at the end of period 15, while in situation “With range anxiety” LIB demand will reach 2.7 million units/year. shows that range anxiety substantially impacts LIB demand. We find that LIB demand increases if range anxiety impact is not considered in the model.
Figure 3. Validation: LIB demand variation between periods 0–15.
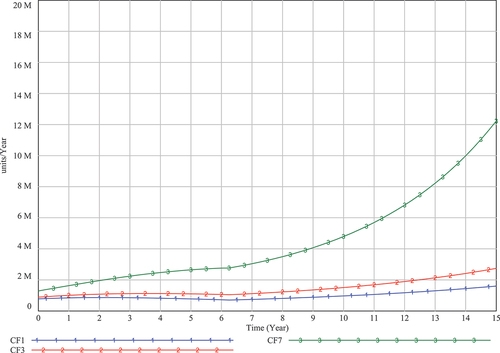
In other scenarios, we vary the charging frequency between 1 and 7 cycles/week (where 1 cycle/week (CF1) denotes minimum charging frequency, whereas 7 cycles/week (CF7) denotes maximum charging frequency). A lower charging frequency reduces the quantity of LIB replaced, whereas a high charging frequency increases the LIB replacement. LIB demand is linked with LIB replacement. Hence, high replacement leads to higher demand than low LIB replacement, as shown in .
Figure 4. Validation: LIB demand variation between periods 0–15 with varying charging frequency.
4.2. Scenario 1: Battery capacity scenarios
In this scenario, we analyse the impact of variation in average battery capacity (by changing the battery mass) on the LIB cost per kWh and the LIB demand. The average battery capacity (at the beginning of each simulation) varies between “(60–90)kWh” to capture the average increase in battery capacity projected by the International Energy Agency (IEA) in different reports on EVs (Abergel et al., Citation2020; Bibra et al., Citation2021; Till et al., Citation2019) for 2019–2030. An increase in battery capacity has a two-fold effect. It reduces the range anxiety by enhancing the EV range (feedback loop B3, Range anxiety cycle in ; Refer to Appendix Section A, Eqs A1-A8) but at the same time, battery capacity increment will increment the cost of the raw materials (feedback loop B1 Battery capacity dynamics) and increase the experience by increasing the total installed capacity (feedback loop R1 Learning effect in ) and combined impact of reinforcing feedback loop R1 and balancing feedback loop B1 impact the battery cost that will impact the EV sales (Refer to Appendix Section A, Eqs A13-A22). Battery capacity increment ceases when range anxiety becomes zero, and after that, battery cost is governed by the dominant reinforcing loop R1 as range anxiety has no impact on EV sales. In scenario “60SUB1”, due to low battery capacity in periods “0–3”, LIB cost is low (due to dominance of feedback loop R1), boosts the EV sales, which increases the LIB demand. During periods “3–7”, battery capacity attains a higher value that increases the LIB cost (due to the dominance of feedback loop B1) and reduces the LIB demand. Between periods “6–15”, the LIB demand shows a steep increase as the range requirement is fulfilled by the battery capacity; hence, the range anxiety is zero. After period 6, battery capacity remains fixed, and LIB cost is decreased due to the learning effect that increases the LIB demand. Similar phenomena are observed in other average battery capacity scenarios. Due to high capacity, range anxiety reduces to zero in periods 1–2 for 90 kWh capacity LIB and in periods 3–4 for 80kWh capacity LIB. The learning effect feedback loop R1 is dominant over battery capacity dynamics feedback loop B1 after the period when the range anxiety is zero (as battery capacity increment ceases after the period when the range anxiety is zero). Hence, in period 15, the LIB demand in scenario “90SUB1” is greater than in scenario “80SUB1”. This result is counter-intuitive as LIB having a high battery capacity (90 kWh) has a high cost, yet the demand is more than the low battery capacity LIB (70–80)kWh. It happens due to the early dominance of the feedback loop R1 over feedback loop B1 in the case of high capacity LIB compare to low capacity LIB (Refer to ). LIB demand in scenario “90SUB1” is 6% higher than the LIB demand in “70SUB1” and LIB demand in scenario “60SUB1” is 23% higher than that of LIB demand in scenario “90SUB1” as shown in .
Figure 5. LIB demand with variation in battery capacity.
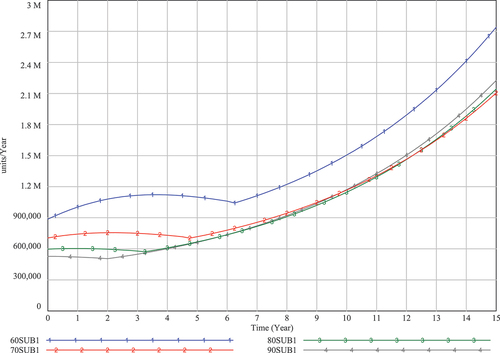
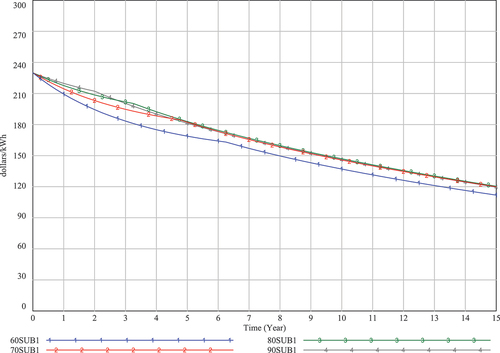
The increase in LIB demand leads to increases in the learning effect of economies of scale, which reduces the LIB cost per kWh. Therefore, shows a decreasing trend in LIB cost per kWh and reached the value between US$ 110/kWh- US$ 120/kWh in period 15. LIB cost per kWh lowest in scenario “60SUB1” in period 15 as it touches the value US$ 110/kWh.
Figure 6. LIB cost per kWh with variation in battery capacity.
4.3. Scenario 2: Subsidy scenarios
In this scenario, similar to Scenario 1, the average battery capacity varies by incrementing battery mass to nullify the impact of range anxiety on EV sales. Apart from this, the government provides subsidies on EV purchases defined in in Appendix Section A. Subsidy reduces the EV upfront cost that makes the EV more affordable, leading to an increase in EV sales, EV stock, and subsequently more LIB replacement over time (Refer to Appendix Section A, Eqs. A9-A12 and Eqs. A23-A24). Subsidy withdrawal will increase the EV cost, which will reduce EV sales that lead to a decrease in LIB demand. represents the variations in LIB demand with varying subsidies. The dip in demand occurs due to the withdrawal of subsidies (period 3 for SUB2, period 6 for SUB3, and period 9 for SUB4). LIB demand increases in period 9 for scenario “60SUB1” as range anxiety becomes zero in period 9 (range anxiety feedback loop B3 remains ineffective). After that, the feedback loop R1 Learning effect in dominates the battery capacity dynamics loop B1 that lowers the LIB cost between periods 9–15. LIB replacement (Refer to feedback loop B2 in ) and EV retirement (EV life 12 years) also impact the LIB demand. The demand for LIB is highest for full subsidy (SUB1) and lowest for non-subsidy (SUB5; and vice versa for the cost of LIB per kWh ().
Figure 7. LIB demand with variation in purchase subsidy.
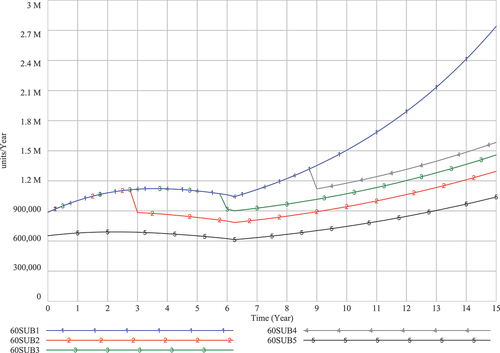
Figure 8. LIB cost per kWh with variation in purchase subsidy.
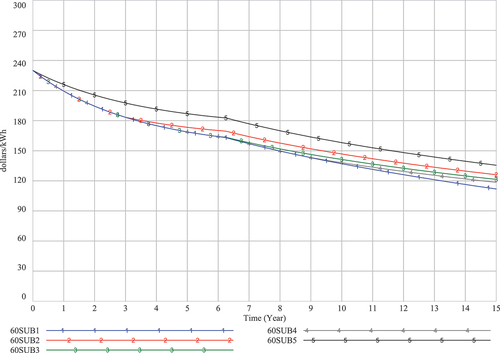
In period 15, the LIB demand in full subsidy (SUB1) is 73% higher than the LIB demand in varying subsidy scenarios (SUB4) and is 164% higher than the no subsidy (SUB5) scenario. On the contrary, the LIB demand in the changing subsidy scenario (SUB4) is 53% higher than that in the no subsidy scenario (SUB5). LIB cost per kWh in the SUB5 scenario is 21% more than in the SUB1 scenario (). shows that in no subsidy scenario (SUB5), LIB demand shows a higher increasing trend in the market (after the period when range anxiety is zero) compared to varying subsidy scenarios (SUB2-SUB4) (Refer to in Appendix section A) due to the higher impact of subsidy variation on the dominance of feedback loop R1 over Feedback loop B1.
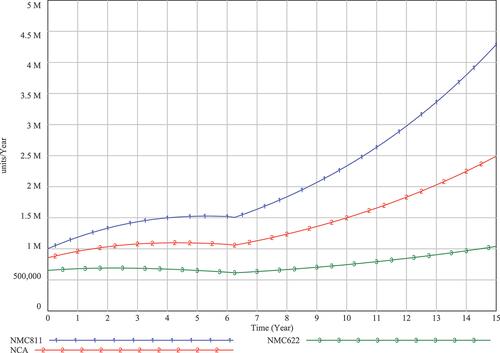
4.4. Scenario 3: Change in LIB composition scenarios
In this scenario, we consider fixed average battery capacity (60 kWh), subsidy on EV as SUB5 scenario explained in (Refer to Appendix Section A) and vary the chemical composition of LIB electrode by changing electrode chemistry and considered NMC variant (NMC811 and NMC622) and NCA LIB as these LIBs will dominate the LIB market till 2030 as forecasted by Abergel et al. (Citation2020); Pillot (Citation2019). The quantity of raw materials (based on the chemical composition of the LIB electrodes) will significantly affect the LIB cost through feedback loop B1 shown in . The variation in the chemical composition of the LIB electrode will influence the LIB cost as LIB electrode differs in chemical composition and molar ratio of raw material that constitute electrode as shown in in Appendix Section A (Refer to Appendix Section A, Eqs. A13-A16). LIB having a higher amount of Cobalt (Co) like lithium nickel manganese cobalt oxide 622 (NMC622) (622 denotes the ratio of nickel (Ni), Co, and manganese (Mn) on a mole fraction basis) will have a higher cost than LIB having a lower quantity of Co (NMC811, NCA) due to the high cost of Co as shown in (Refer to Appendix Section A). High NMC622 cost compared to NMC811 and NCA leads to a decrease in EV sales, further reducing LIB demand, as shown in . Model results indicate that LIB demand for NMC811 is 312% high compared to NMC622.
Figure 9. LIB electrode composition impact on LIB demand.
5. Conclusions
The diffusion of EVs in the mobility sector is widely impacted by LIB capacity and cost. LIB capacity impacts the EV range, total LIB installed in the automotive industry, and LIB material cost, whereas LIB cost impacts the EVs price that affects the EVs sales. EV sales variations influence the LIB demand. Besides LIB cost, subsidy and electrode composition also impact the EV price. Interaction among these factors creates a dynamically complex system that needs to be analysed through a methodology that represents the systemic view of this dynamically evolving system. This paper analyses LIB demand and cost variation in different scenarios related to variations in battery capacity, subsidy, and LIB electrode chemical composition. The model captures several important feedback loops governing LIB demand, including the learning effect, range anxiety cycle, battery capacity dynamics, and LIB demand-replacement cycle. Simulation results indicate that LIB cost per kWh attains the value between (99–135)/kWh at the end of simulation depending upon the difference in the scenario, which is slightly higher than the value forecast by Gómez Vilchez and Thiel (Citation2020). Our result differs from Gómez Vilchez and Thiel (Citation2020) because we used the initial LIB average capacity (60–90)kWh and then varied the LIB capacity in each period (by varying LIB mass) to cease the impact of range anxiety on EV sales. LIB increment ceases when range anxiety is zero.
The model results highlight some counter-intuitive results, such as LIB demand of 90kWh is higher than (70–80)kWh LIB, although 90kWh has a higher cost than (70–80)kWh LIB. It happens because, for high LIB capacity, the impact of range anxiety on EV sales halted early compared to low capacity (70–80)kWh LIB. Then, LIB cost is impacted by the dominance of the learning effect loop R1 over the battery capacity dynamics loop B1 and governs the LIB cost. Therefore, battery manufacturers must carefully consider the trade-offs between the LIB cost and the LIB capacity while addressing the issue of range anxiety. Battery manufacturers may develop strategic plans for battery product segmentation for consumers based on LIB capacity (with corresponding differentiated price points) to address the needs of different EV consumer segments. It helps battery manufacturers to differentiate themselves from competitors (Gary et al., Citation2008; Kunc & Morecroft, Citation2007; Kunc et al., Citation2017).
Along with battery capacity, LIB electrode composition significantly impacts LIB cost. The model result indicates that EV having NMC811 LIB electrode has higher demand than NMC622 as NMC811 electrode chemistry has a lower Co content than the NMC611 electrode chemistry. Therefore, strategic selection of LIB electrode chemical composition for EV widely impacts the LIB demand and raw material cost (N.Carey et al.; Reuters, August 23, Carey & Lienert, Citation2022).
The EV subsidy significantly impacts LIB demand. Our simulation results indicate that LIB demand is substantially high in scenarios where a higher subsidy is given on EV purchase in the initial phase and then gradually withdrawn during the simulation time frame. In varying subsidy scenarios, when government subsidy withdrawal at different time intervals defined in (Refer Appendix Section A), LIB demand reduces similar to the different scenarios considered for EV demand in Keith et al. (Citation2020) for EVs. After that, LIB demand regained its growth trajectory due to the dominance of feedback loop R1 over feedback loop B1 shown in . The model results highlight an exciting result that LIB demand also increases in the non-subsidy scenario during the simulation period. It helps EV manufacturers to plan their production activity based on the government subsidy policy so that they can pass maximum benefits to consumers (J.Ewing; Business Standard, August 14, Ewing, Citation2022; N.Naughton et al.; The Wall Street Journal).
There are multiple directions in which this research can be extended. This research considers the average capacity of LIB for a vehicle of only a single type, i.e., electric cars. We can enhance the model by considering vehicles of other variants like electric trucks, buses, two-wheelers, etc., with different average battery capacities. The research focuses on the impact of individual LIB chemistry on LIB demand. We can also extend the model boundary to explore the effect of battery mix on material cost and LIB demand. For simplicity, we consider the energy density of LIB as a fixed value. Since the energy density of LIB can be varied by improving the battery chemistry, we can extend our model to analyse the impact of energy density improvement on battery capacity that impact the LIB demand. Consumer awareness of the environment improved electric vehicle performance, and stringent CO2 emission targets set by different countries for OEMs in place of the target set through the Paris agreement have a significant impact on EV sales. The recent Conference of Parties COP26 has refocused the global effort on developing sustainable technologies for clean mobility, clean energy, etc. We can add policy aspects such as government emission targets and manufacturer’s future EV sales target commitment to impact EV sales to extend the model’s boundary.
Acknowledgments
We gratefully acknowledge the valuable comments from the participants of the 39th International System Dynamics Conference of the System Dynamics Society and the OR Society’s 63rd Annual Conference. We are also deeply indebted to the anonymous editor and reviewers of the journal for their valuable comments.
Disclosure statement
No potential conflict of interest was reported by the author(s).
Additional information
Funding
References
- Abbas, K. A., & Bell, M. G. (1994). System dynamics applicability to transportation modeling. Transportation Research Part A: Policy and Practice, 28(5), 373–390. https://doi.org/10.1016/0965-8564(94)90022-1
- Abergel, T., Bunsen, T., Gorner, M., Leduc, P., & Pal, S. (2020). Global EV Outlook 2020. International Energy Agency. https://www.iea.org/reports/global-ev-outlook-2020
- Ahmed, S., Nelson, P. A., Gallagher, K. G., Susarla, N., & Dees, D. W. (2017, February). Cost and energy demand of producing nickel manganese cobalt cathode material for lithium ion batteries. Journal of Power Sources, 342, 733–740. https://doi.org/10.1016/j.jpowsour.2016.12.069
- Amit, R. K., & Venugopal, S. (2018). Is this time different for electric vehicle (EV) battery materials? In fisita world automotive congress 2018. FISITA World Automotive Congress 2018, 2018-October. https://www.scopus.com/inward/record.uri?eid=2-s2.0-85070930006&partnerID=40&md5=6ce334b6250426b0946a51173c7a5112
- Azevedo, M., Campagnol, N., Hagenbruch, T., Hoffman, K., Lala, A., & Ramsbottom, O. (2018). Lithium and cobalt: A tale of two commodities. McKinsey & Company.https://www.mckinsey.com/industries/metals-and-mining/our-insights/lithium-and-cobalt-a-tale-of-two-commodities
- Bagodi, V., & Mahanty, B. (2006). Unfolding the learning disabilities using qualitative analysis: The two-wheeler service sector in India. International Journal of Technology Policy and Management, 6(2), 221–235. doi:10.1504/IJTPM.2006.010912.
- Bagodi, V., & Mahanty, B. (2013, May). Double loop learning in the Indian two-wheeler service sector. The Learning Organization, 20(4–5), 264–278. https://doi.org/10.1108/TLO-04-2012-0029
- Barlas, Y. (1989). Multiple tests for validation of system dynamics type of simulation models. European Journal of Operational Research, 42(1), 59–87. https://doi.org/10.1016/0377-2217(89)90059-3
- Barlas, Y. (1996). Formal aspects of model validity and validation in system dynamics. System Dynamics Review, 12(3), 183–210. https://doi.org/10.1002/(SICI)1099-1727(199623)12:3<183::AID-SDR103>3.0.CO;2-4
- Benveniste, G., Rallo, H., Canals Casals, L., Merino, A., & Amante, B. (2018, November). Comparison of the state of lithium-sulphur and lithium-ion batteries applied to electromobility. Journal of Environmental Management, 226, 1–12. https://doi.org/10.1016/j.jenvman.2018.08.008
- Beuse, M., Steffen, B., & Schmidt, T. S. (2020). Projecting the competition between energy- storage technologies in the electricity sector. Joule, 4(10), 2162–2184. https://doi.org/10.1016/j.joule.2020.07.017
- Bibra, E. M., Gul, T., Connelly, E., Gorner, M., & Teter, J. (2021). Global EV outlook 2021 accelerating ambitions despite the pandemic. International Energy Agency. https://www.iea.org/reports/global-ev-outlook-2021
- Bonges, H. A., & Lusk, A. C. (2016, January). Addressing electric vehicle (EV) sales and range anxiety through parking layout, policy and regulation. Transportation Research Part A: Policy and Practice, 83, 63–73. https://doi.org/10.1016/j.tra.2015.09.011
- Bubeck, S., Tomaschek, J., & Fahl, U. (2016, August). Perspectives of electric mobility: Total cost of ownership of electric vehicles in Germany. Transport Policy, 50, 63–77. https://doi.org/10.1016/j.tranpol.2016.05.012
- Cano, Z. P., Banham, D., Ye, S., Hintennach, A., Lu, J., Fowler, M., & Chen, Z. (2018). Batteries and fuel cells for emerging electric vehicle markets. Nature Energy, 3(4), 279–289. https://doi.org/10.1038/s41560-018-0108-1
- Carey, N., & Lienert, P. (2022, July). For EV battery makers, it’s go small or go home. Reuters. https://www.reuters.com/technology/ev-battery-makers-its-go-small-or-go-home-2022-07-11/
- Chen, X., Wu, T., Zheng, R., & Guo, X. (2018, December). How vehicle market is segmented and influenced by subsidy policy: A theoretical study. Transportation Research Part A: Policy and Practice, 118, 776–782. https://doi.org/10.1016/j.tra.2018.10.026
- Ciez, R. E., & Whitacre, J. F. (2016, July). The cost of lithium is unlikely to upend the price of Li-ion storage systems. Journal of Power Sources, 320, 310–313. https://doi.org/10.1016/j.jpowsour.2016.04.073
- Curry, C. (2017, July). Lithium ion battery costs and market. Bloomberg New Energy Finance. https://data.bloomberglp.com/bnef/sites/14/2017/07/BNEF-Lithium-ion-battery-costs-and-market.pdf
- Ewing, J. (2022, August). Bumpy ride ahead for electric vehicle makers after US passes climate bill. Business Standard. https://www.business-standard.com/article/international/bumpy-ride-ahead-for-electric-vehicle-makers-after-us-passes-climate-bill-1220814009281.html
- Ford, A., & Flynn, H. (2005, December). Statistical screening of system dynamics models. System Dynamics Review, 21(4), 273–303. https://doi.org/10.1002/sdr.322
- Franke, T., & Krems, J. F. (2013a, November). Understanding charging behaviour of electric vehicle users. Transportation Research. Part F, Traffic Psychology and Behaviour, 21(21), 75–89. https://doi.org/10.1016/j.trf.2013.09.002
- Franke, T., & Krems, J. F. (2013b, November). What drives range preferences in electric vehicle users? Transport Policy, 30, 56–62. https://doi.org/10.1016/j.tranpol.2013.07.005
- Gary, M. S., Kunc, M., Morecroft, J. D., & Rockart, S. F. (2008). System dynamics and strategy. System Dynamics Review, 24(4), 407–429. https://doi.org/10.1002/sdr.402
- Goel, P., Sharma, N., Mathiyazhagan, K., & Vimal, K. E. K. (2021, October). Government is trying but consumers are not buying: A barrier analysis for electric vehicle sales in India. Sustainable Production and Consumption, 28, 71–90. https://doi.org/10.1016/j.spc.2021.03.029
- Gómez Vilchez, J. J., & Thiel, C. (2020). Simulating the battery price and the car-mix in key electro-mobility markets via model coupling. Journal of Simulation, 1–18. https://doi.org/10.1080/17477778.2020.1781556
- Goodenough, J. B. (2012, June). Rechargeable batteries: Challenges old and new. Journal of Solid State Electrochemistry, 16(6), 2019–2029. https://doi.org/10.1007/s10008-012-1751-2
- Han, X., Ouyang, M., Lu, L., & Li, J. (2014, December). A comparative study of commercial lithium ion battery cycle life in electric vehicle: Capacity loss estimation. Journal of Power Sources, 268, 658–669. https://doi.org/10.1016/j.jpowsour.2014.06.111
- Hao, H., Geng, Y., Tate, J. E., Liu, F., Chen, K., Sun, X., Liu, Z., & Zhao, F. (2019, November). Impact of transport electrification on critical metal sustainability with a focus on the heavy-duty segment. Nature Communications, 10(1), 1–7. https://doi.org/10.1038/s41467-019-13400-1
- Harrison, G., & Thiel, C. (2017, January). An exploratory policy analysis of electric vehicle sales competition and sensitivity to infrastructure in Europe. Technological Forecasting and Social Change, 114(114), 165–178. https://doi.org/10.1016/j.techfore.2016.08.007
- Harrison, G., Thiel, C., & Jones, L. (2016). Powertrain Technology Transition Market Agent Model (PTTMAM). European Commission. https://joint-research-centre.ec.europa.eu/scientific-tools-and-databases/powertrain-technology-transition-market-agent-model-pttmam/powertrain-technology-transition-market-agent-model-pttmam_en
- Henze, V. (2020). Battery Pack Prices Cited Below $100/kWh for the First Time in 2020, While Market Average Sits at $137/kWh. BloombergNEF. https://about.bnef.com/blog/battery-pack-prices-cited-below-100-kwh-for-the-first-time-in-2020-while-market-average-sits-at-137-kwh/
- Hsieh, I. Y. L., Pan, M. S., Chiang, Y. M., & Green, W. H. (2019, August). Learning only buys you so much: Practical limits on battery price reduction. Applied Energy, 239(August 2018), 218–224. https://doi.org/10.1016/j.apenergy.2019.01.138
- Huang, X., Lin, Y., Zhou, F., Lim, M. K., & Chen, S. (2021, October). Agent-based modelling for market acceptance of electric vehicles: Evidence from China. Sustainable Production and Consumption, 28, 206–217. https://doi.org/10.1016/j.spc.2021.04.007
- Keith, D. R., Struben, J. J., & Naumov, S. (2020). The diffusion of alternative fuel vehicles: A generalised model and future research agenda. Journal of Simulation, 14(4), 260–277. https://doi.org/10.1080/17477778.2019.1708219
- Kieckhäfer, K., Volling, T., & Spengler, T. S. (2014). A hybrid simulation approach for estimating the market share evolution of electric vehicles. Transportation Science, 48(4), 651–670. https://doi.org/10.1287/trsc.2014.0526
- Kittner, N., Lill, F., & Kammen, D. M. (2017, August). Energy storage deployment and innovation for the clean energy transition. Nature Energy, 2(9), 1–6. https://doi.org/10.1038/nenergy.2017.125
- Kunc, M. H., & Morecroft, J. D. (2007, September). Competitive dynamics and gaming simulation: Lessons from a fishing industry simulator. Journal of the Operational Research Society, 58(9), 1146–1155. https://doi.org/10.1057/palgrave.jors.2602246
- Kunc, M. H., Morecroft, W., & D, J. (2017). Resource-based strategies and problem structuring: Using resource maps to manage resource systems. Journal of the Operational Research Society, 60(2), 191–199. https://doi.org/10.1057/palgrave.jors.2602551
- Lebedeva, N., Persio, F. D., & Boon-Brett, L. (2017). Lithium ion battery value chain and related opportunities for Europe. European Commission. https://op.europa.eu/en/publication-detail/-/publication/349a7d1a-61f9-11e7-9dbe-01aa75ed71a1/language-en
- Li, L., Guo, S., Cai, H., Wang, J., Zhang, J., & Ni, Y. (2020, November). Can China’s BEV market sustain without government subsidies?: An explanation using cues utilization theory. Journal of Cleaner Production, 272, 122589. https://doi.org/10.1016/j.jclepro.2020.122589
- Lim, M. K., Mak, H. Y., & Rong, Y. (2015). Toward mass adoption of electric vehicles: Impact of the range and resale anxieties. Manufacturing and Service Operations Management, 17(1), 119. https://doi.org/10.1287/msom.2014.0504
- Lin, Z. (2014). Optimizing and Diversifying Electric Vehicle Driving Range for U.S. Drivers. Transportation Science, 48(4), 635–650. https://doi.org/10.1287/trsc.2013.0516
- Melliger, M. A., van Vliet, O. P. R., & Liimatainen, H. (2018, December). Anxiety vs reality – Sufficiency of battery electric vehicle range in Switzerland and Finland. Transportation Research Part D:Transport and Environment, 65, 101–115. https://doi.org/10.1016/j.trd.2018.08.011
- Myung, S.-T., Maglia, F., Park, K.-J., Seung Yoon, C., Lamp, P., Kim, S.-J., & Sun, Y. K. (2017). Nickel-Rich Layered Cathode Materials for Automotive Lithium-Ion Batteries: Achievements and Perspectives. ACS Energy LETTERs, 2(1), 223. https://doi.org/10.1021/acsenergylett.6b00594
- Naughton, N., & Rogers, C. (2021, November). How tax credits and government subsidies have aided the electric-vehicle market. The Wall Street Journal. https://www.wsj.com/articles/how-tax-credits-and-government-subsidies-have-aided-the-electric-vehicle-market-11637583826
- Nelson, P. A., Bloom, K. G., Dees, I., & W, D. (2011). Modeling the performance and cost of lithium-ion batteries for electric-drive vehicles. Argonne National Laboratory. https://publications.anl.gov/anlpubs/2011/10/71302.pdf
- Neubauer, J., & Pesaran, A. (2011, December). The ability of battery second use strategies to impact plug-in electric vehicle prices and serve utility energy storage applications. Journal of Power Sources, 196(23), 10351–10358. https://doi.org/10.1016/j.jpowsour.2011.06.053
- Nitta, N., Wu, F., Lee, J. T., & Yushin, G. (2015, June). Li-ion battery materials: Present and future. Materials Today, 18(5), 252–264. https://doi.org/10.1016/j.mattod.2014.10.040
- Nykvist, B., Sprei, F., & Nilsson, M. (2019, January). Assessing the progress toward lower priced long range battery electric vehicles. Energy Policy, 124, 144–155. https://doi.org/10.1016/j.enpol.2018.09.035
- Olivetti, E. A., Ceder, G., Gaustad, G. G., & Fu, X. (2017, October). Lithium-ion battery supply chain considerations: Analysis of potential bottlenecks in critical metals. Joule, 1(2), 229–243. https://doi.org/10.1016/j.joule.2017.08.019
- Pales, A. F., Levi, P., Remme, U., & Gul, T. (2020). Energy technology perspectives 2020 (Tech. Rep.). International Energy Agency. https://www.iea.org/reports/energy-technology-perspectives-2020
- Pearre, N. S., Kempton, W., Guensler, R. L., & Elango, V. V. (2011, December). Electric vehicles: How much range is required for a day’s driving? Transportation Research Part C: Emerging Technologies, 19(6), 1171–1184. https://doi.org/10.1016/j.trc.2010.12.010
- Pevec, D., Babic, J., Carvalho, A., Ghiassi-Farrokhfal, Y., Ketter, W., & Podobnik, V. (2020, December). A survey-based assessment of how existing and potential electric vehicle owners perceive range anxiety. Journal of Cleaner Production, 276, 122779. https://doi.org/10.1016/j.jclepro.2020.122779
- Pillot, C. (2019). The rechargeable battery market and main trends 2018-2030. In 36th annual international battery seminar & exhibit. avicenne energy https://rechargebatteries.org/wp-content/uploads/2019/02/Keynote_2_AVICENNE_Christophe-Pillot.pdf.
- Pratap, B., Mohan, T. V. K., Amit, R. K., & Venugopal, S. (2020). Visualizing the complex demand and supply dynamics of critical battery materials—a key enabler for realizing the electric mobility vision 2030. In Ieee transportation electrification conference (itec-India) doi:10.1109/ITEC-India48457.2019.ITECINDIA2019-170.
- Quinn, J. B., Waldmann, T., Richter, K., Kasper, M., & Wohlfahrt-Mehrens, M. (2018). Energy density of cylindrical li-ion cells: A comparison of commercial 18650 to the 21700 cells. Journal of the Electrochemical Society, 165(14), A3284–A3291. https://doi.org/10.1149/2.0281814jes
- Richa, K., Babbitt, C. W., Gaustad, G., & Wang, X. (2014, February). A future perspective on lithium- ion battery waste flows from electric vehicles. Resources, Conservation and Recycling, 83, 63–76. https://doi.org/10.1016/j.resconrec.2013.11.008
- Senge, P. M., & Sterman, J. D. (1992, May). Systems thinking and organizational learning: Acting locally and thinking globally in the organization of the future. European Journal of Operational Research, 59(1), 137–150. https://doi.org/10.1016/0377-2217(92)90011-W
- Shao, L., & Jin, S. (2020, April). Resilience assessment of the lithium supply chain in China under impact of new energy vehicles and supply interruption. Journal of Cleaner Production, 252, 119624. https://doi.org/10.1016/j.jclepro.2019.119624
- Shepherd, S., Bonsall, P., & Harrison, G. (2012, March). Factors affecting future demand for electric vehicles: A model based study. Transport Policy, 20, 62–74. https://doi.org/10.1016/j.tranpol.2011.12.006
- Shi, C. (2021). China cuts EV subsidy for 2021; market downplays impact on lithium, cobalt prices. Fastmarkets. https://www.metalbulletin.com/Article/3969254/China-cuts-EV-subsidy-for-2021-market-downplays-impact-on-lithium-cobalt-prices.html
- Song, Y., Li, G., Wang, Q., Meng, X., & Wang, H. (2020, October). Scenario analysis on subsidy policies for the uptake of electric vehicles industry in China. Resources, Conservation and Recycling, 161, 104927. https://doi.org/10.1016/j.resconrec.2020.104927
- Struben, J. J. R. (2006). Essays on transition challenges for alternative propulsion vehicles and transportation systems ( Unpublished doctoral dissertation). Massachusetts Institute of Technology http://dspace.mit.edu/bitstream/handle/1721.1/37159/85835878-MIT.pdf?sequence=2.
- Sverdrup, H. U. (2016, November). Modelling global extraction, supply, price and depletion of the extractable geological resources with the LITHIUM model. Resources, Conservation and Recycling, 114, 112–129. https://doi.org/10.1016/j.resconrec.2016.07.002
- Taylor, T. R., Ford, D. N., & Ford, A. (2010, January). Improving model understanding using statistical screening. System Dynamics Review, 26(1), 73–87. https://doi.org/10.1002/sdr.428
- Thies, C., Kieckhäfer, K., & Spengler, T. S. (2016, June). Market introduction strategies for alternative powertrains in long-range passenger cars under competition. Transportation research Part D: Transport and Environment, 45, 4–27. https://doi.org/10.1016/j.trd.2015.05.002
- Thingvad, A., Andersen, P. B., Unterluggauer, T., Træholt, C., & Marinelli, M. (2021, August). Electrification of personal vehicle travels in cities - Quantifying the public charging demand. eTransportation, 9, 100125. https://doi.org/10.1016/j.etran.2021.100125
- Till, J. B., Pierpaolo, C., Léa, D., Marine, G., Sacha, S., Renske, S., & Tattini. (2019). Global EV outlook 2019 Scaling-up the transition to electric mobility. International Energy Agency. https://www.iea.org/reports/global-ev-outlook-2019
- Vaalma, C., Buchholz, D., Weil, M., & Passerini, S. (2018). A cost and resourse analysis of sodium-ion battery. Nature Reviews Materials, 3(4), 18013. https://doi.org/10.1038/natrevmats.2018.13
- Van Noorden, R. (2014). The rechargeable revolution: A better battery. Nature, 507(7490), 26–28. https://doi.org/10.1038/507026a
- Venegas, F. G., Petit, M., & Perez, Y. (2021, November). Plug-in behavior of electric vehicles users: Insights from a large-scale trial and impacts for grid integration studies. eTransportation, 10, 100131. https://doi.org/10.1016/j.etran.2021.100131
- Vilchez, J. J. G., & Jochem, P. (2019). Simulating vehicle fl eet composition: A review of system dynamics models. Renewable and Sustainable Energy Reviews, 115(April 2018). https://doi.org/10.1016/j.rser.2019.109367
- Wee, S., Coffman, M., & La Croix, S. (2018, November). Do electric vehicle incentives matter? Evidence from the 50 U.S. states. Research Policy, 47(9), 1601–1610. https://doi.org/10.1016/j.respol.2018.05.003
- Wolstenholme, E. F., & Coyle, R. G. (1983, July). The development of system dynamics as a methodology for system description and qualitative analysis. The Journal of the Operational Research Society, 34(7), 569. https://doi.org/10.1057/jors.1983.137
- Wong, J. (2021). EV batteries: The next victim of high commodity prices? The Wall Street Journal. https://www.wsj.com/articles/ev-batteries-the-next-victim-of-high-commodity-prices-11626950276
- Wu, F., Maier, J., & Yu, Y. (2020, March). Guidelines and trends for next-generation rechargeable lithium and lithium-ion batteries. Chemical Society Reviews, 49(5), 1569–1614. https://doi.org/10.1039/c7cs00863e
- Xu, M., Yang, H., & Wang, S. (2020, May). Mitigate the range anxiety: Siting battery charging stations for electric vehicle drivers. Transportation Research Part C: Emerging Technologies, 114(114), 164–188. https://doi.org/10.1016/j.trc.2020.02.001
- Yang, J., Dong, J., Zhang, Q., Liu, Z., & Wang, W. (2018, May). An investigation of battery electric vehicle driving and charging behaviors using vehicle usage data collected in Shanghai, China. Transportation Research Record: Journal of the Transportation Research Board, 2672(24), 20–30. https://doi.org/10.1177/0361198118759015
- Zhang, Z. J., Fang, W., & Ma, R. (2019, November). Brief review of batteries for XEV applications. eTransportation, 2, 100032. https://doi.org/10.1016/j.etran.2019.100032
- Zubi, G., Dufo-López, R., Carvalho, M., & Pasaoglu, G. (2018, June). The lithium-ion battery: State of the art and future perspectives. Renewable and Sustainable Energy Reviews, 89, 292–308. https://doi.org/10.1016/j.rser.2018.03.002
Appendix A.
Model variables
We consider vehicles of homogeneous nature, battery electric cars. We adopt the calculation by Kieckhäfer et al. (Citation2014) for “Battery capacity” where they calculate the battery capacity for different powertrains. “Battery capacity” is defined as the amount of energy stored in a battery pack. It depends on the battery mass and the specific energy of the battery pack. In our study, we consider specific energy has a fixed value of 200 Wh/kg (Abergel et al., Citation2020) for a given LIB chemistry, and battery capacity has changed by varying the battery’s mass, constrained by the battery architecture. An increment in battery capacity enables the battery to store more energy in EV’s battery, which helps EV to cover more distance. A range increment reduces anxiety by allowing the consumer to cover more distance. In our model, battery mass is incremented based on the range gap. “Range gap” is defined as the difference in the target range and EV range. In our analysis, battery mass is incremented by 10% whenever the range gap is greater than zero. “Time to increment Battery mass” is the first order time delay in incrementing battery capacity and introducing a new EV with incremented battery capacity, and it is taken as one year in our model.
We model the “Range” as a stock to capture its variance over time. “Initial range” is dependent on battery capacity and energy consumption by EV in watt-hour/miles (Richa et al., Citation2014). The energy consumption of EVs depends on driving conditions, patterns, and behaviour. It varies from 240–280 watt-hour/miles (Wh/miles). For ease of calculation, we take energy consumption as a fixed value of 250 Wh/mile (Richa et al., Citation2014). We consider the LIB used in EV as efficient as 95% (Richa et al., Citation2014). Efficiency is the energy used during battery discharge after the battery is initially charged.
The battery capacity varies with time depending upon the depth of discharge and End-of-life (EOL) of a battery. A battery reaches EOL when it loses the battery capacity to 20% of its initial capacity (Neubauer & Pesaran, Citation2011). LIBs need to be replaced after they reach 80% of their initial capacity because LIBs are not fit for use in EVs (Till et al., Citation2019). Depth of discharge (DOD) varies between 70% −80% (Han et al., Citation2014). In our calculation, we consider DOD as 80%. “Range anxiety” is a psychological barrier that inhibits EV sales. It is the difference between the target and actual ranges for a given battery capacity. “Target range” is taken as 300 miles based on various articles and data given in Melliger et al. (Citation2018). Range anxiety reduces with an increase in EVs range. Xu et al. (Citation2020) formulated range anxiety as a nonlinear function of energy available in the battery and stated that range anxiety decreases as energy available in the battery increases.
We consider the EV stock as “INITIAL EV STOCK” (Abergel et al., Citation2020) and having value of 2 Million. EV stock is taken as global electric car stock in 2017 (Abergel et al., Citation2020; Till et al., Citation2019). “EV stock” changes as consumers discard their vehicles at the end of their service life and purchase new vehicles (Richa et al., Citation2014). As all consumers do not buy or discard their EVs at the same time, we model “EV retirement” (the number of vehicles retiring every year) using the first-order delay. EV life varies from 10–20 years depending on driving conditions and driver behaviour (Abergel et al., Citation2020; Richa et al., Citation2014). In our analysis, we consider EV life as 12 years. “EV sales” depends on range anxiety (that depends on EV range) and EV price. “EV price” is calculated based on LIB cost and subsidy given on EV. LIB pack is assumed to contribute a significant contribution (30–40%) of EV cost (Till et al., Citation2019). In our analysis, we consider LIB cost is 40% of EV price. Governments offer EV subsidies based on EV sales targets, vehicle performance, and policy decisions (Chen et al., Citation2018; song et al., Citation2020). The subsidies vary from time to time to reflect a change in government policies. In most countries, subsidies for purchasing BEV vary in the range of US$ 4500–6800 (Abergel et al., Citation2020). In this model, we consider subsidy on the purchase of each EV to be 5500 US$ (Shepherd et al., Citation2012), then change (by using the “STEP” function in the Vensim) in different years to reflect the change in government policies. The model uses the STEP function in the Vensim to vary the subsidy value in years 3, 6, and 9, as shown in . “SUB5” indicates subsidy withdrawal during the simulation period; hence, there is no subsidy in this scenario.
“Experience accumulation factor”, “LIB cost per kWh”, and “Experience accumulation factor” is calculated based on calculations done by Kieckhäfer et al. (Citation2014) and Thies et al. (Citation2016). “Experience” is related to the total battery capacity installed in EVs. “INITIAL EXPERIENCE” is calculated as a product of battery electric car stock and “Battery capacity”. Battery capacity increases to reduce range anxiety and capacity increment ceases when range anxiety becomes zero. An increase in EV sales and EV replacement will increase the demand for LIB packs, and hence the production of LIB has to rise to meet the increasing demand for LIBs. High production induces a learning impact on LIBs cost that reduces the cost of LIB per kWh. We have taken the learning rate as 19% (Hsieh et al., Citation2019). Also, we have taken “INITIAL LIB cost per kWh” as 230 dollars/kWh (Curry, Citation2017; Lebedeva et al., Citation2017). “LIB cost” describes as a product of “Ratio of learning capability” and “Initial LIB cost” (Refer to Table A3 in Appendix section A). “Ratio of learning capability” is defined as the ratio of LIB cost per kWh and “INITIAL LIB COST PER kWh”. LIB cost per kWh decreases based on the learning effect on the production process (Hsieh et al., Citation2019; Kieckhäfer et al., Citation2014). “Total Raw Material cost” depends on battery capacity and LIB electrode chemical composition and is calculated as the product of “Raw Material cost per kWh” and battery capacity. Raw material cost per kWh depends on raw material quantity content in LIB electrode. It is calculated by multiplying raw material quantity (kg/kWh) and raw material cost ($/kg) (based on the USGS database). We can calculate the total raw material cost by multiplying the raw material cost per kWh with battery capacity (Refer to in Appendix section A). In our calculation, we have taken LIB capacity as 60 kWh, and “Initial LIB cost” is 14% of total raw material cost.
Table A1. Subsidy variation. (Source: (Bibra et al., Citation2021; Till et al., Citation2019)).
Table A2. Total raw material quantity for LIB electrodes. (Source: (Olivetti et al., Citation2017) and USGS database).
Table A3. Initial LIB cost for different LIB electrodes. (Source: (Olivetti et al., Citation2017) and USGS database.