
 ?Mathematical formulae have been encoded as MathML and are displayed in this HTML version using MathJax in order to improve their display. Uncheck the box to turn MathJax off. This feature requires Javascript. Click on a formula to zoom.
ABSTRACT
The main objective of the sectorization approach is to divide a vast region into symmetric sectors. Balancing accessibility of healthcare units, which is commonly between the goals of governments is closely related to the concept of sectorization. When the desired equilibrium between sectors is lost resectorization is applied. In this study, we propose a new model based on the resectorization concept for balancing the accessibility of healthcare services in a region. We consider each hospital and the patients that choose it as a sector. We define a new bi-objective function, which includes the goal of improving quality and accessibility. We use simulation-based optimization for resectorization and we portray it as a tool for policymaking based on contract mechanisms. A case study is utilized in the section on experimental results. The outcomes demonstrate that it is achievable to balance the accessibility of healthcare units with a suitable contract mechanism.
1. Introduction
In this study, we deal with a healthcare system that exists in some countries, which consists of private and public hospitals with dissimilar features (Teymourifar, et al., Citation2021). Usually, in such systems, waiting times in public hospitals are high, service quality is low, but payments are also low. On the contrary, in private hospitals, although the payments are mostly high, service quality is satisfactory, and waiting times are low (Kaya, et al., Citation2020). Besides, we assume that private hospitals are more accessible in the dealt system. In this situation, most of the patients prefer public hospitals, which is usually because of their affordable prices. However, in some studies, it is determined that in such systems, some of the patients who currently go to public hospitals, prefer to go to private ones because of better quality (Kaya, et al., Citation2020). They do such decisions when affordable prices are offered in private hospitals. This is a general situation and it is discussed in the literature that the price has serious effects on patients’ choice of hospital (Qin & Prybutok, Citation2013). In this study, we suppose that the accessibility of hospitals likewise has a significant impact on the choice of patients. The goal of this study is to demonstrate that directing some patients from public hospitals to private ones can be socially beneficial. The justification for this can be as follows: more patients get better quality and more accessible services, and also private hospitals can increase their profits. In order to achieve these goals, the government offers a contract to private hospitals and declares that it will give more subsidies to the patients of those hospitals. This decision makes the payment of the patients more affordable. Although this may grow public expenses, it rises the satisfaction of the patients as it enables them to reach a better service (Kaya, et al., Citation2020; Qin & Prybutok, Citation2013; Teymourifar, et al., Citation2021).
Modelling the hospital choice decisions of patients is very important both scientifically and practically (Smith et al., Citation2018). If governments are aware of the characteristics of these decisions, they can make serious improvements in the healthcare systems. As mentioned before, one of the factors that affect the hospital selection of patients is the price (Kaya, et al., Citation2020; Teymourifar, et al., Citation2021). However, the accessibility of the patients to the hospitals is also important. Private hospitals can be preferred by some patients in terms of both accessibility and quality, but they may not go there due to the high price. In this study, we define a new utility function to analyse patients’ decisions, which incorporates accessibility, waiting times, price, and quality factors.
In the sectorisation approach, a large region is supposed to be divided into balance units (Teymourifar et al., Citation2021). Sectori-sation has several applications in different fields. It is possible to define accessibility to health units based on this concept. Resectorization is a similar notion though is associated with situations that change over time. For example, if sectors have already been formed but the balance between them has not been provided or has been violated, resectorization is desired. In this study, for the first time in the literature, we consider each hospital and the patients who prefer it as a sector. One of the main ideas of the study is that the government tries to increase patients’ utility by directing more patients to private hospitals with a suitable contract. This argument has been investigated previously in the literature (Kaya, et al., Citation2020; Teymourifar, et al., Citation2021), but we combine the concepts of patients’ utility and resectorization. Balancing demands in a healthcare system is beneficial for society, which is one of the main subjects of this study.
One of the essential objectives of resectorization is to balance accessibility to facilities. Subsidisation is an important and effective tool for governments (Qian, Guo, Citation2017). The government can provide more subsidies for patients who want to go to private hospitals. In this case, a more balanced system can be formed.
The capacity of private hospitals may not be as high as that of public ones. As more patients choose private hospitals, the waiting times increase there, which is not a satisfactory situation for patients and therefore affects their choice of hospital. Hence, the government can provide financial aid to private hospitals to increase their capacity.
Based on the foregoing, the novelties of this study can be summarised as follows: a new model for resectorization in healthcare systems is proposed. Public-private sectors collaboration, which is based on contract mechanisms, is combined with the concept of resectorization. A new objective function is proposed to measure healthcare systems in terms of both accessibility and quality. Simulation-based optimisation is used for performing resectorization in healthcare systems. In the literature, although simulation models are used for many topics of healthcare management (Baril et al., Citation2017; Gonsalves & Itoh, Citation2009; Jun et al., Citation1999; Knight et al., Citation2012; Mielczarek & Uziałko-Mydlikowska, Citation2012; Pilgrim, Citation2009; Teymourifar, Citation2022; Tyler et al., Citation2022), they have generally been applied for the management of emergency services (Ahmed & Alkhamis, Citation2009; Baesler et al., Citation2003; Cabrera et al., Citation2011, Citation2012; De Angelis et al., Citation2003; Duguay & Chetouane, Citation2007; Komashie & Mousavi, Citation2005; Lin et al., Citation2015; Liu et al., Citation2017; Ruohonen et al., Citation2006; Uriarte et al., Citation2017). In this work, we use simulation-based optimisation for a general model, which can be applied to different health units. Also, few studies have modelled the healthcare unit such as multiple hospitals (Fournier & Zaric, Citation2013; Hosking et al., Citation2013), which we do in this study.
According to the obtained results, it is possible to accomplish resectorization in healthcare systems with a proper contract. This means that when governments provide the appropriate amounts of subsidies for patients and help private hospitals to increase their capacity, the balance of accessibility to healthcare units can be acquired.
The outlines of this work can be summarised as follows:
We consider a healthcare system, which includes public and private hospitals with different characteristics.
In such systems, although many patients prefer public hospitals because of the affordable price, they desire to go to a private hospital because of better quality.
To achieve this demand, the government can offer private hospitals a new contract, under which it gives more subsidies for patients going to private hospitals, making the price more affordable. Thus, more patients go to private hospitals and receive better quality service.
We consider the time to reach hospitals as well as the waiting time inside the hospital for each patient.
We propose a new objective function, based on which the results are evaluated from a social perspective.
We model this problem based on the resectorization concept and we use simulation-based optimisation to solve it.
We show that the balance of accessibility to healthcare units can improve when the government, in the scope of a new contract, offers an affordable price (or subsidy) for patients going to private hospitals and aids private hospitals to increase capacity.
We demonstrate that this situation, which is interpreted as resectorization in the healthcare system, is socially beneficial.
The other parts of this article are organised as follows: In Section 2, a review of the relevant literature is presented. Section 3, describes the system and the proposed model. The developed simulation-based optimisation is explained in Section 4. The experimental results obtained by applying the model for a case study from the literature are presented in Section 5. The implications and future works are discussed in the conclusion part, which forms Section 6.
2. Literature review
Sectorisation has several applications in districting of diverse fields such as medical service systems (Sudtachat et al., Citation2020), water distribution (Ulusoy et al., Citation2022; Vegas Niño et al., Citation2021), marine province (Cord et al., Citation2022), telecommunication (Mohammed & El Bekkaye, Citation2021; Upadhyay et al., Citation2022), power distribution networks (De Assis et al., Citation2014), commercial territory (Rios-Mercado & Escalante, Citation2016), and supply chain network (Zhou et al., Citation2002). Linear (Liu et al., Citation2020), quadratic (Antunovic et al., Citation2021), non-linear (Lin et al., Citation2020), and constraint programming (Trandac et al., Citation2005), as well as metaheuristics (Tang et al., Citation2012) are widely employed for solving models of this approach. Despite the scarce applications of simulation in sectorisation of health facilities, this method has been applied in sectorisation of air traffic control and telecommunications. Since real-life problems are dynamic, it may be more practical to model them on the concept of resectorization (Mohammed & El Bekkaye, Citation2021). Simulation has substantial potential to solve these problems (Teixeira et al., Citation2007).
There are detailed review papers on the applications of simulation in healthcare management (Mielczarek & Uziałko-Mydlikowska, Citation2012). Particularly since 2004, there are a growing number of articles on this topic (Günal & Pidd, Citation2010). As well as discrete event simulation, other types of this method, such as system dynamics (Kuljis et al., Citation2007), Monte Carlo (Dufo-López et al., Citation2016), and agent-based (Cabrera et al., Citation2011) are operated in healthcare systems. Simulation-based decision support systems are expedient for the management of operations in hospitals (Ahmed & Alkhamis, Citation2009). Especially, there are many studies in the literature on using simulation for capacity and resource planning in healthcare units (Ben Mbarek et al., Citation2022; Chen & Wang, Citation2016; Wang et al., Citation2011). This subject has become even more important during the COVID-19 pandemic (Ma et al., Citation2022). Simulation is also utilised for demand forecasting in hospitals (Baesler et al., Citation2003). Another subject in which the simulation is extensively utilised is the reduction of waiting times in hospitals (Ltaif et al., Citation2022). Most of the studies on this topic include a single healthcare unit, although there are also models that contain multiple units to analyse their interactions (Kaya, et al., Citation2020). As in many fields (Zhang et al., Citation2021), simulation is also used for pricing in healthcare systems (Teymourifar, Citation2019). Although, other methods of operation research have been applied more in this regard (Tanwar et al., Citation2020). The hybridising simulation with statistical methods, mathematical modelling, and metaheuristics can provide novel bases to analyse patient satisfaction (Rahimi Rise & Ershadi, Citation2021; Swisher & Jacobson, Citation2002). Simulation is a suitable tool for combining vital matters such as sustainability with healthcare management topics (Petering et al., Citation2015).
In the literature, it is stated that the cooperation of the public and private sectors is required for the refinement of the healthcare systems (Teymourifar, Citation2019). The necessity for this partnership became more evident during the COVID-19 pandemic (Baxter & Casady, Citation2020). Contract mechanisms form the basis of this collaboration (Teymourifar, Citation2019). Pricing is determined based on a contract in systems where the government subsidises patients of private hospitals. Subsidisation is an influential policy to provide an effective healthcare system (Hoel & Sæther, Citation2003; Zhou et al., Citation2017). This policy can be employed to direct patients with sensitivity to waiting time to private hospitals. In this case, the congestion in public hospitals declines, the system becomes more balanced, and consequently, the social benefit grows (Qian, Zhuang, Citation2017; Teymourifar, Citation2019). Encountering the contract that provides optimal pricing and subsidisation is a crucial matter in healthcare systems (Tanwar et al., Citation2020). Nevertheless, contract mechanisms have not been explored in the health management literature as much as in supply chain management. In healthcare systems, fixed payments are typically analysed. It has been indicated in the literature that differentiated pricing and payments based on patients’ income can be more socially beneficial (Qian, Guo, Citation2017; Teymourifar, Citation2019). This approach is investigated in other areas such as airline (Raza, Citation2015) and hotel (Xu et al., Citation2014) management, and it is indicated that it increases profitability and satisfaction levels (Borsenberger et al., Citation2016; Gao et al., Citation2015; Phillips, Citation2021; Talluri & Van Ryzin, Citation2004; Wolk & Ebling, Citation2010). Price differentiation is less explored in healthcare management because it is not easy to implement it in real life. Although reimbursement policies can be operated for this purpose (Guo et al., Citation2016). It is revealed that in case of uncertainty, a cost-sharing contract can provide good coordination for the healthcare supply chain (Chick et al., Citation2008). In service systems, payments affect performance and revenue (Adida et al., Citation2017; Afeche, Citation2013). The importance of performance-based and outcome-based contacts, which are also known as “pay for performance” and “payment by results”, is enriching in healthcare management (Jiang et al., Citation2012). In some studies, it is discussed that the government should give incentives for efficient care rather than a high volume of care (Adida et al., Citation2017).
Similarities and differences between this work and the studies from the literature are summarised in .
Table 1. A comparison between studies in the literature and our study.
3. Description of the system
In this study, a health system consisting of private and public hospitals with different characteristics is discussed. As mentioned in the introduction part, in general, waiting times in public hospitals are high, service quality is low, but payments are also low. Contrariwise, in private hospitals, whilst the payments are high, service quality is generally high, and waiting times are low. Commonly in such systems, public hospitals are preferred more by patients because of the affordable price, which causes an unbalanced system (Kaya, et al., Citation2020; Teymourifar, et al., Citation2021). In particular, if there is a private hospital near the patients and they want to go there due to both proximity and quality, but cannot go there because of the high price, the need for balancing in the system is felt more.
The used notations in the model are summarised in .
Table 2. Used notations.
We suppose that in a district, there are I private and J public hospitals, with the above-mentioned features. The sets of private and public hospitals are SI and SJ. It is assumed that there is only an examination process in hospitals. Thus, the model can also be also applied to other health units like clinics. For patients going to public hospitals, the government sets a price, which is fixed in all hospitals. The government also offers a contract to private hospitals, based on which the examination price and the subsidy amount for each patient are determined. Some private hospitals accept this contract, but some other hospitals refuse these contracts, in which case patients attending that hospital are not subsidised by the government.
The service fee, the average waiting time and the perceived quality level in the i-th private hospital are denoted as ,
and
, which are
,
and
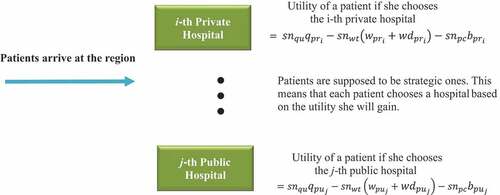
in the j-th public hospital. Several definitions have been previously presented in the literature for the utility function of patients in healthcare systems (Kaya, et al., Citation2020; Teymourifar, et al., Citation2021). However different, but in a similar way as in previous works, we define the utility function of patients going to i-th private and j-th public hospitals, respectively, as
and
, where
,
, and
are patients’ quality, waiting time, and price sensitivity. It should be noted that they are not coefficients but they are random variables. Each patient is attributed to specific values of quality, waiting time, and price sensitivities. Although the quality level, waiting time, and payment are the same for a hospital since the sensitivities of the patients are different, their utility values and hence the hospital selection decisions will be different. The definition of the patients’ utility function in this study looks easier compared to the ones in the literature. Besides, unlike previous studies, we include sensitivities in the model for price, waiting times, and quality. In similar studies (Kaya, et al., Citation2020; Teymourifar, et al., Citation2021), the time for patients to reach the hospital is ignored, but we also include it in the model since resectorization is a base in this study.
As seen in , the patients that enter the system are assumed to be strategic ones, so they choose the hospital based on the utility they will get.
Figure 1. Patients arrive in the system and choose between hospitals.
For a patient to choose the i-th private hospital, the following inequalities are valid:
A similar inequality is valid to select the j-th public hospital by a patient, as follows:
The defined utility function and accordingly the hospital selection decisions of patients are dynamic because they are dependent on the waiting times in hospitals.
In private hospitals that accept and apply contracts offered by the government, the examination prices are equal. The same is true for subsidies.
Similar to the ones in the literature (Kaya, et al., Citation2020; Teymourifar, et al., Citation2021), , the public expenditure is defined as in EquationEquation (3)
(3)
(3) .
If additional capacity is assigned to private hospitals under a contract, its cost is added to the . The unit cost of the added capacity is also
.
is not defined as a part of the objective function. However, it is assumed there is an upper limit for increments in
, which is expressed as in Constraint 4.
The probability of selecting hospitals can be calculated as ,
, and
,
.
The time that patients spend to reach the examination is an important variable for measuring the accessibility of a healthcare system. and
are the average waiting times for patients at the i-th private and j-th public hospitals, specified as the time after leaving home until start an examination in the hospital. Defined as in EquationEquation (5)
(5)
(5) ,
is the average of the explained waiting times for all hospitals. We handle it as an objective function, which is desired to be minimised.
If a new contract is offered to private hospitals, the consequential must not exceed the current state, which is provided by the Constraint 6.
In terms of accessibility, quality is also important and patients require to reach quality services. We define an objective function to measure the total quality received by patients, as in EquationEquation (7)(7)
(7) , which is desired to be maximised.
If a new contract is proposed to private hospitals, the resulting must not be less than the current state, which is provided by the Constraint 6.
To be maximised based on the Pareto optimality approach, the bi-objective function of the model is defined as in EquationEquation (9)(9)
(9) , which consists of
, and
.
Considering its unit, it may not make sense to use as a denominator, but the meaning is that we aim to minimise it. In this way, the objective function defined as in EquationEquation (9)
(9)
(9) is desired to be maximised. The decision variables are payments and capacities in private hospitals. It should be noted that the decisions are taken by the government, which are recommended to the private hospitals and they decide whether or not to accept the contract over their own profits. The profit function of the i-th private hospitals is as in EquationEquation (10)
(10)
(10) (Kaya, et al., Citation2020; Teymourifar, et al., Citation2021).
As it has been said before, when a contract is offered to private hospitals, they can accept or reject it. Each private hospital makes this decision over the amount of profit. Such that, if it accepts a contract, the amount of profit must be at least as before the contract. Otherwise, this issue will be like an authoritarian imposition, which is unacceptable in the relations between government and private hospitals. This issue is provided by Constraint 11, where is the i-th hospital’s profit in the current state. The relevant constraint is as follows (Kaya, et al., Citation2020; Teymourifar, et al., Citation2021):
is the average of the profits of private hospitals, as defined in EquationEquation (12)
(12)
(12) .
The average profit of private hospitals in the current state is denoted by which complies with the following constraint:
It has been shown in the literature that private hospitals can actually increase their profits by accepting the contract. In other words, it is thought that the cooperation of the public and private sectors is beneficial for both parties (Kaya, et al., Citation2020; Teymourifar, et al., Citation2021).
The capacities of hospitals are greater than zero, defined as ,
and
,
. It should be noted that here the capacity is considered as the number of examination teams consisting of staff such as doctors and nurses. Physical facilities such as beds are not considered (Kaya, et al., Citation2020; Teymourifar, et al., Citation2021).
Defined as in Constraint 3.14, prices and payments in private hospitals are positive.
As mentioned earlier, and
,
are the decision variables of the model.
4. Solution approach
In this study, simulation-based optimisation is used to solve the model described in Section 3. First, the simulation of the model is developed and the outputs for the base case parameters are obtained, which represent the current state of the system. Then, different values for the payment, and capacity levels in private hospitals are defined, and the simulation is repeated for each one. It is assumed that in the contract the government offers the same values to all private hospitals and they accept it. In other words, the price and subsidy values are the same in private hospitals (Kaya, et al., Citation2020; Teymourifar, et al., Citation2021). The cases in which hospitals do not accept the contract are not analysed in this study.
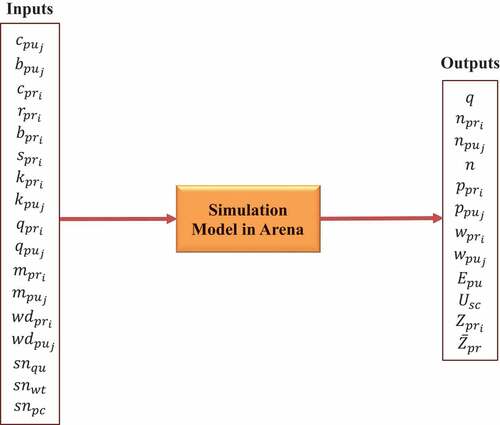
The simulation model is designed in the Rockwell Arena 14.0 software, in which the parameters of the current situation in the case study are used (Kaya, et al., Citation2020). As seen in , the probability of selecting hospitals by patients is one of the outputs of the simulation model, which is calculated over the number of patients who chose each hospital. There are also other outputs like quality levels, average waiting times, and profits of private hospitals in the current state.
Figure 2. Inputs and outputs of the simulation model.
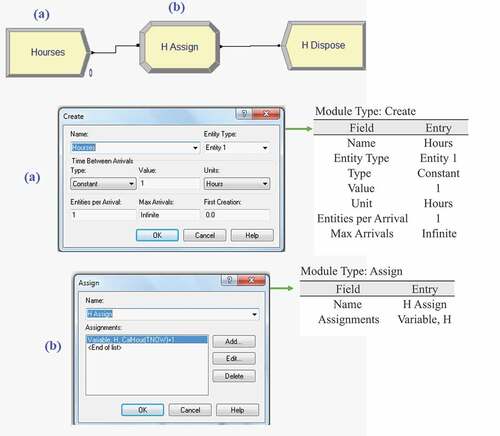
In the Arena software, the time adjustment is made as in . Therefore, each entity is assigned the system time (TNOW) when it first arrives. For this aim, a variable named is defined.
Figure 3. Time adjustment in the simulation model.
The main modules of the simulation are shown in . The details of them are presented in , named with the same letter in .
Figure 4. Main modules of the simulation model.
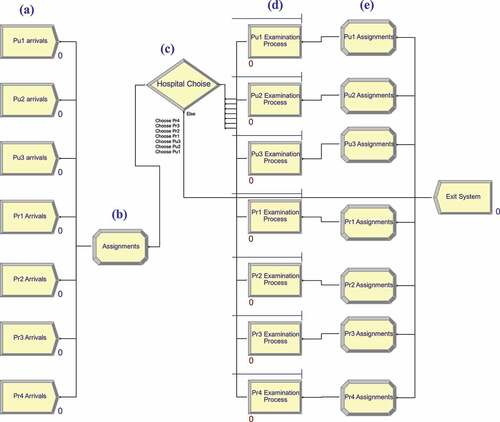
Figure 5. Some details from the modules in .
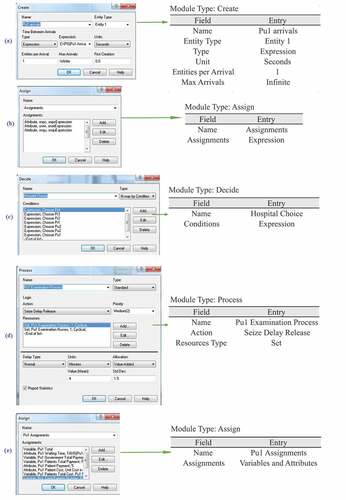
In the module shown in (a), we define that arrivals are according to the Exponential distribution. For this aim, variables representing the inter-arrival times are determined. There are seven modules in (a), but they could be combined into a single module that represents the sum of all arrivals. Having different arrivals in fact symbolises the concept of resectorization. In other words, in the previous case, each hospital had a specific demand while they became more balanced as a result of the resectorization. This means that, for example, all entities created by the module arrivals don’t enter the module
Examination Process and some of them can be directed to other hospitals as a result of assignments in (b) and decisions made in (c). The module displayed in (b), assigns values such as sensitivity to each patient as attributes. Likewise, the time to reach each hospital is assigned to each patient in this module. In the module shown in (c), patients’ hospital selection decisions are made. Utilities and hospital selection decisions based on inequalities 3.1 and 3.2 are defined using the expression module of the Arena. A similar definition of patients’ utility function is also available in the literature, whose one of the primary ideas is that
and
are proportional to
and
, which are alike dependent to
and
,
,
. The hospital selection probabilities of the patients are calculated analytically based on these relations, which result in complex and non-linear equations (Kaya, et al., Citation2020; Teymourifar, et al., Citation2021). In a different manner, in this study, we only use inequalities 3.1 and 3.2 in the simulation model. In (d), examination processes take place, where doctor and nurse resources are defined as sets. The simulation outputs are assigned as attributes and variables in the modules shown in (e), then entities exit the system.
Traditionally, simulation-based approaches dealt with optimising inputs of the model, while optimisation-based approaches utilised simulation for calculating parameters for mathematical programming models. The enormous advancements in computational capability led to the intersection of both fields, which emerged in simulation-based optimisation (Figueira & Almada-Lobo, Citation2014). Sometimes simulation software provides a base for improving the performance of the handled system by the sensitivity analysis or design of experiments approach (Nguyen et al., Citation2014). This is what we mean by simulation-based optimisation in this article. This approach does not necessarily find the global optimum solution(s). It should be noted that optimality cannot be guaranteed unless an exact algorithm is utilised to solve a problem.
Scenarios are assembled in the Process Analyser software to maximise the objective function. In this way, we are in fact utilising the design of the experiments. Scenarios are designed by defining different values for decision variables, which are payments and capacities in private hospitals.
Since a bi-objective function is defined the outputs are evaluated based on the Pareto optimality approach. In the outcomes, the results with violated constraints are eliminated.
5. Experimental results
For experimental results, we use the data of a case study from the literature, which characterises a regional healthcare system in Turkey. It contains public and private hospitals with described features in Section 3 (Kaya, et al., Citation2020).
The used case study is slightly adjusted to fit the model of this study, whose details are given in this section. In the case study, the model is built on emergency services (Kaya, et al., Citation2020). To make the model more general, we consider only an examination process inside each hospital. We consider each hospital as a unit and we do not care about the details inside. We model the system with three public and four private hospitals.
5.1. Base case parameters
The base case parameters characterise the current state of the system. In the case study, the inter-arrival times to the hospitals are as in .
Table 3. Inter arrival times, i.e., the average times between patient arrivals to the emergency services (in seconds) (Kaya, et al., Citation2020).
It should be noted that inter-arrival time is the reciprocal of the arrival rate. In fact, the arrivals in represent the current situation in the case study. But in this work, after these arrivals are entered into the system, hospital selection is made through the patients’ utility in the decision module shown in (c).
As mentioned before, the capacities in hospitals are the numbers of doctors and nurses performing examinations. Physical facilities in hospitals are not considered a resource in this study (Kaya, et al., Citation2020). Without losing the generality of the model, for the experimental results, we assume that the capacity, price, and quality levels in private hospitals are similar. In fact, such a situation arises when the government-recommended contract is accepted by private hospitals. Otherwise, there is competition between hospitals, which is not the subject of this study. Similar to the used case study (Kaya, et al., Citation2020), the values used in the simulation model for the current state of the private hospitals are as follows:
,
,
,
,
,
.
Since these parameters are equal for all private hospitals, index i is not used in the rest of the paper. It is clear that in this case, the amount of subsidy paid by the government for each patient attending the private hospital is equal to eight, obtained as .
The parameters in public hospitals are utilised as follows (Kaya, et al., Citation2020; Teymourifar, et al., Citation2021):
,
,
,
,
,
.
Index j is not used for these parameters in the next parts, since they are equal in all public hospitals.
In public and private hospitals, the times of examination processes are generated according to Normal(5,1.5) and Normal(4,1.5) distributions, respectively. These distributions are fitted using the Input Analyser tool of the Rockwell Arena software, which finds the best-fitted distribution by doing Chi-square, and Kolmogorov – Smirnov tests. The p-values of the test have been reported greater than 0.15 (Kaya, et al., Citation2020).
In the case study, the transportation time of the patients to the hospital is ignored. But we include it in the model, such that when a patient arrives in the system, her time to reach each public hospital is generated according to Normal(30,10) distribution. For private hospitals, it is generated according to Normal(25,10) distribution. These times are in minutes. In other words, in this study, there is an assumption that private hospitals have an advantage over public hospitals in terms of accessibility. It should be noted that the definition used for accessibility in this study, is different from spatial proximity. In some countries, private hospitals are often smaller than public ones, so they can be built in more accessible locations. Therefore, this assumption is valid for such cases. In terms of accessibility, transportation availability and low traffic volumes are effective. This definition is measured in time, not distance. An example of this attribute for two randomly chosen patients is presented in . Thus, a consequence of more patients going to private hospitals is a reduction in the average time to reach hospitals for all patients.
Table 4. Times to reach hospitals for two randomly chosen patients (in minutes).
We generate price, waiting time, and quality sensitivities for each patient according to Normal(100,20) distribution. For this aim, three random variables are derived according to the distribution, and they are assigned to each patient as the values of price, waiting time, and quality sensitivities. Normal(50,10) and Normal(150,10) distributions are also used for this purpose. Although the unit capacity cost of the hospitals is given in the case study, the capacity increase cost is not provided. Therefore, we assume that both of these costs are equal to 15,000. In other words, if the government adds a doctor-nurse team to each private hospital, public expenses increase by 15,000 units. However, since generally there is a constraint in this affair, it is assumed that the capacity increase in each private hospital can be at most one unit.
5.2. Outputs of the arena
We use a system with an Intel Core i5 processor, 2.4 GHz with 12 GB of RAM. The simulation period is 30 days, so the presented results are for one month. The outputs of Arena are given in . As mentioned before, in the base case parameters, and
. Also, for the case of
, the outputs obtained from Arena software are given in . For both cases in this table,
,
and
are generated according to Normal(100,20) distribution.
Table 5. Some outputs of the simulation model for hospitals.
As seen in , when and
, in total 14
of all patients go to private hospitals, therefore the demands of public and private hospitals are not balanced. But when
and
, waiting times in public hospitals diminish, and also private hospitals’ profits improve. For
, values between 30 and 55 are eliminated as they either do not improve the objective function or they violate the constraints. For the case of
and
, private hospitals’ profits are defined as
,
. Likewise, the value of
is shown in the same table.
As shown in , as the payment decreases in the private hospitals, more patients prefer them, which boosts the total quality received by the patients. Likewise, the demand for public and private hospitals becomes more balanced. Also, the crowdedness in public hospitals and waiting times are reduced there, though slightly increased in private hospitals.
5.3. Outputs of the process analyzer
Results in are by hospitals, but gives average values, which are the outputs of the Process Analyser software. Based on the results obtained for the base case parameters ,
and
are determined. The relevant row is highlighted with the Gray colour in . In the Process Analyser software, using the simulation model in Arena, scenarios are built, in which, the effects of different values of the decision variables i.e., payments and capacity levels in private hospitals on the objective function are analysed. In this study, in private hospitals, the decrease in the price means that the government gives more subsidies. So, as shown in , in this case, public expenses rise. Besides, since it is assumed that the capacity boost in private hospitals is made with the help of the government, it also grows public expenses. We define three upper limits for this rise, such as 5%, 10%, and 15%. In , the column of
is highlighted with different colours. We look for the results that do not violate Constraints 3.6, 3.8, and 3.13. Since the average values of all hospitals are given in , Constraint 3.13 is considered, but Constraint 3.11 is not considered.
Table 6. Results for parameters
Normal(100,20),
Normal(100,20),
Normal(100,20).
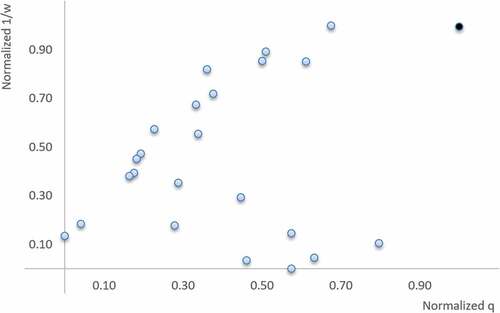
As mentioned earlier, in terms of Pareto optimality, we are looking for results that are not dominated by other ones. For easier graphical representation, the values of and
are normalised. The outputs are presented in .
Table 7. Results for , when and
are normalised.
When the values of and
in are plotted and Constraints 3.4, 3.6, 3.8, 3.13 are not considered, is obtained. As seen, in this case, the solution with
and
, which is shown in black, dominates the others. Whereas for this solution the increase in
is more than 15% compared to
.
Figure 6. Graphical comparison of the results in , when Constraints 3.4, 3.6, 3.8, 3.13 are not considered.
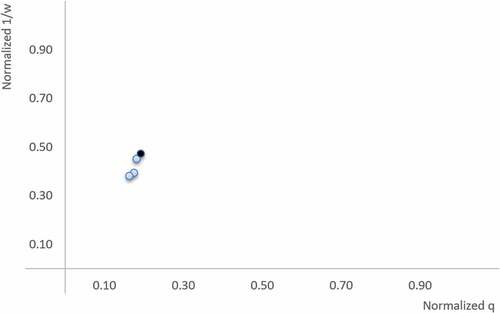
The is formed when a maximum increase of 10% relative to and Constraints 3.6, 3.8, 3.13 are applied. As seen, in this case, the solution with
and
, dominates the others, which is shown in black. As seen in , the solution with
and
, dominates the other, even when a maximum increment of 15% is applied relative to
.
Figure 7. Graphical comparison of the results in , when Constraints 3.4, 3.6, 3.8, 3.13 and a maximum increase of 10% relative to are applied.
summarises the results of a similar analysis for different values of ,
,
. In this table, Constraints 3.4, 3.6, 3.8, 3.13 are included. For each upper limit of
, only valid and non-dominated solutions in Constraints 3.6, 3.8, 3.13 are given in this table. Some upper limits for
are not given because there are no solutions that fit all constraints for them. It seems that in all cases, the government can reduce payments by providing more subsidies for patients going to private hospitals. It is possible to do this with reasonable increases in public expenses. In this case,
grows, and
declines. Furthermore, the demand for public and private hospitals becomes more balanced, which is desirable in terms of resectorization. Furthermore, the profits of private hospitals alike become greater, which shows that it is plausible for them to accept the contract.
Table 8. Results according to different parameters.
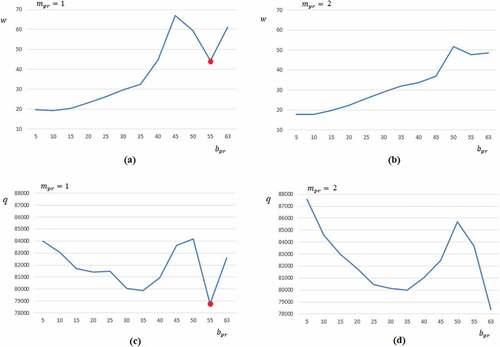
As seen in , there is no linear relationship between and the components of the objective function. Therefore, simulation is a suitable tool for the analysis of this situation. The results of base case parameters are marked with a red circle in . Diagrams of
are similar to
.
Figure 8. and
according to different payments values and capacities.
As in the case study, the units of ,
,
are Turkish Lira (TL), while
is in minutes.
is the defined total quality level received by all patients and has no units.
is the number of the examination team in private hospitals.
As mentioned before, the Normal distribution is used for the examination times in the case study, but in the literature, it is stated that such process times can be according to the Gamma distribution (Muralidhar et al., Citation1992). To show that the results are similar across different distributions, processing times are simulated over Normal(5,1.5) and Normal(4,1.5) distributions. Using the obtained values in the Input Analyser software, the most suitable Gamma distribution is obtained. In this way, the distributions closest to Normal(4,1.5) and Normal(5,1.5) can be transformed to −11+Gamma(0.59,25.2) and Gamma(0.52, 9.76), respectively. It should be noted that since the p-value of this inference is less than 0.005, it is not considered statistically significant and this is used just to show that conceptually similar results will be obtained, with different distributions. The corresponding results are shown in , whose waiting times are not similar to those in because as mentioned before the process of acquiring Gamma distributions is not statistically meaningful. It should be mentioned that, if a negative processing time is generated, the Arena software discards it.
Table 9. Results for the case that processing times are according to the Gamma distribution.
According to the results in , it is possible to improve the objective function with up to 10% and 15% increments relative to .
6. Conclusion and future works
In this study, simulation-based optimisation is used to solve a problem that for the first time in the literature on healthcare management is modelled by combining resectorization and contracting between government and private hospitals. The contract includes the value of payments and additional capacity support by the government for private hospitals. This forms a base for the cooperation of the public and private sectors (Kaya, et al., Citation2020; Teymourifar, et al., Citation2021). In the proposed model, there are private and public hospitals with different characteristics in a regional healthcare system. In the current state of the system, although the payments are low in public hospitals, waiting times are high and the quality perceived by patients is low. On the opposite, in private hospitals, payments are high, waiting times are low and perceived quality is high. This is a general system that is valid in some countries. The healthcare system in Turkey can be given as a concrete example of this situation. In addition, we presume that private hospitals are more accessible. In the literature, it has been determined that some of the patients who in the current state of such systems go to public hospitals, will prefer private ones when there is an affordable price. This matter can be also socially beneficial because more people go to private hospitals, they get better quality services, and the demand for hospitals becomes more balanced. One of the possible ways to make the prices more affordable in private hospitals is that the government gives more subsidies to the patients who go there, which is considered in this study. For this aim, the government prepares a new contract and recommends it to private hospitals (Kaya, et al., Citation2020; Teymourifar, et al., Citation2021).
One of the most important novelties in the study is the defined objective function, which is a bi-objective one and evaluates the system considering waiting times and quality. It measures the accessibility of healthcare units in terms of time and quality. In previous studies that analysed similar systems, only the waiting time of patients for examination at the hospital was considered, and the time to reach the hospital was ignored. This issue is closely related to the topic of resectorization, which has not been addressed from this perspective before. For the first time in the literature of healthcare management, contract mechanisms are combined with the concept of resectorization to improve the objective function. In this study, the meaning of sectorisation and the necessity of resectorization can be explained as follows: each hospital and the patients that prefer it can be considered as a sector. In the current situation, many patients prefer public hospitals because they offer more affordable prices. However, it has been reported in the literature that in such systems, many patients who go to public hospitals will prefer private ones because of the high quality, if they offer a more affordable price. Besides, we assume that some of the patients who go to a public hospital in the current situation have a private hospital nearby. Resectorization is done by the government to balance accessibility to healthcare services, both in terms of time and quality. One of the most important tools of the government for this purpose is a contract mechanism. The Government uses this tool to provide more affordable prices by giving more subsidies to patients going to private hospitals. Furthermore, the government offers support to increase the capacity of private hospitals that they may accept or reject. Therefore, contracts are not mandatory orders imposed by the government. In this study, we only analyse the case where all private hospitals accept the contract. We demonstrate that when private hospitals accept this, they can increase their own profits and improve the objective function. In addition, when more people go to private hospitals, the crowdedness in public hospitals decreases, which is a desirable situation.
The experimental results section is designed based on the data from a previous study, with some revisions (Kaya, et al., Citation2020). Some of the parameters of this work do not exist in the mentioned case study, so they are generated. For example, patients’ sensitivities to quality, and waiting times are added. Besides, the time of patients reaching the hospital is taken into account. Although a case study is used, the presented model and results are generalisable and it is applicable to analyse other similar systems. For example, in some countries, there is no payment in public hospitals. This situation can be handled by defining the payment in public hospitals as zero in the designed simulation model.
The results of the study managerial can be summarised as follows: Balancing the demands of health units and increasing accessibility to high-quality health services is socially beneficial. Thus, designing public policies for these aims deserves to be among the goals of governments. These objects can be modelled based on the concept of resectorization. A contract can be used as a base for the public and private sectors to achieve goals. With a suitable contract, it is possible to reduce the payments of patients in private hospitals. In this case, more people go to the private hospital and get better quality services. The demands of public and private hospitals become more balanced, which can be interpreted as a part of resectorization. Furthermore, the profits of private hospitals can increase. Therefore it is possible to say that this matter is beneficial for society. The contract proposed by the government may seem authoritative, but in fact, it is just a recommendation that may not be accepted by private hospitals. However, according to the results of this study, the adoption of the contract can be beneficial for both private hospitals and patients. Because the accessibility of patients to quality health care boosts and at the same time, the profit of the private hospital increases. On the other hand, there may be a growth in public expenditures, which can be managed by defining appropriate upper limits. In summary, in this study, the feasibility of resectorization with an appropriate contract between public and private hospitals is demonstrated, as a result of which access to quality health care and the profit of private hospitals increase. Moreover, it is indicated that the cooperation of the public and private sectors for social goals will be beneficial and the contracts lay the ground for this aim.
Perceived quality by patients and waiting times are treated as two independent variables in this study, although they are actually interrelated. In future studies, it is planned to conduct a more comprehensive study on this subject.
Private hospitals can decide about their own capacity and quality (Teymourifar, et al., Citation2021). In particular, if the pricing decisions by private hospitals are included in the model, competitive situations occur. It is planned to analyse such situations in the future. In this study, there is an assumption that private hospitals are more accessible to patients than public ones, which can be interpreted as a limitation. A more general spatial situation can be analysed in future studies.
For solving the model, exact methods can also be employed (Kaya, et al., Citation2020; Teymourifar, et al., Citation2021), but this makes the solution more complex. Simulation-based optimisation seems to be more flexible for solving complicated models (Kaya, et al., Citation2020).
In the designed simulation model of this study, operations in hospitals are assumed to be a single process as an examination. Therefore, many operations that take place in a hospital are overlooked. One of the most important shortcomings of this is that capacity decisions cannot be analysed in detail. Moreover, capacity increase in health centres may not be easy, since there are usually constraints for this. In future studies, operation management objects in hospitals are planned to be included in the model.
Supporting Information
The developed model in the Arena, defined scenarios in the Process Analyser and details of the obtained results are accessible to readers via the email address of the corresponding author as well as the following public link on GitHub: https://github.com/aydinteymurifar/Resectorization-Simulation-Files
Acknowledgements
Financial support from Fundação para a Ciência e Tecnologia (through project UIDB/00731/2020) is gratefully acknowledged.
The author would like to thank the editors and the anonymous referees for their valuable comments which helped to significantly improve the manuscript.
Disclosure statement
No potential conflict of interest was reported by the author(s)
References
- Adida, E., Mamani, H., & Nassiri, S. (2017). Bundled payment vs. fee-for-service: Impact of payment scheme on performance. Management science, 63(5), 1606–1624. https://doi.org/10.1287/mnsc.2016.2445
- Afeche, P. (2013). Incentive-compatible revenue management in queueing systems: Optimal strategic delay. Manufacturing & Service Operations Management, 15(3), 423–443. https://doi.org/10.1287/msom.2013.0449
- Ahmed, M. A., & Alkhamis, T. M. (2009). Simulation optimization for an emergency department healthcare unit in Kuwait. European Journal of Operational Research, 198(3), 936–942. https://doi.org/10.1016/j.ejor.2008.10.025
- Antunovic, A., Amiri, E., Biefel, C., Steinbock, G., Aulin, J., Liers, F., & Gerstacker, W. (2021, October). Dynamic Sectorization in Multi-Panel Massive MIMO Systems. In 2021 IEEE 4th 5G World Forum (5GWF) (pp. 70–75). IEEE. https://doi.org/10.1109/5GWF52925.2021.00020
- Baesler, F. F., Jahnsen, H., & DaCosta, M. (2003, December). The use of simulation and design of experiments for estimating maximum capacity in an emergency room. In Winter Simulation Conference (Vol. 2, pp. 1903–1906). https://doi.org/10.1109/WSC.2003.1261651
- Baril, C., Gascon, V., Miller, J., & Bounhol, C. (2017). The importance of considering resource’s tasks when modeling healthcare services with discrete-event simulation: An approach using work sampling method. Journal of Simulation, 11(2), 103–114. https://doi.org/10.1057/jos.2016.6
- Baxter, D., & Casady, C. B. (2020). Proactive and strategic healthcare public-private partnerships (PPPs) in the coronavirus (COVID-19) epoch. Sustainability, 12(12), 5097. https://doi.org/10.3390/su12125097
- Ben Mbarek, H., Aissaoui, N. O., Jaoua, A., Layeb, S. B., & Hadj-Alouane, A. B. (2022). A human behavior-based simulation model for resource allocation at a multi-specialty outpatient clinic. Journal of Simulation, 1–28. https://doi.org/10.1080/17477778.2022.2115416
- Borsenberger, C., Cremer, H., Donder, P. D., & Joram, D. (2016). Differentiated pricing of delivery services in the e-commerce sector. In The Future of the Postal Sector in a Digital World (pp. 191–211). Springer. https://doi.org/10.1007/978-3-319-24454-9_13
- Cabrera, E., Taboada, M., Iglesias, M. L., Epelde, F., & Luque, E. (2011). Optimization of healthcare emergency departments by agent-based simulation. Procedia computer science, 4, 1880–1889. https://doi.org/10.1016/j.procs.2011.04.204
- Cabrera, E., Taboada, M., Iglesias, M. L., Epelde, F., & Luque, E. (2012). Simulation optimization for healthcare emergency departments. Procedia computer science, 9, 1464–1473. https://doi.org/10.1016/j.procs.2012.04.161
- Chen, T. L., & Wang, C. C. (2016). Multi-objective simulation optimization for medical capacity allocation in emergency department. Journal of Simulation, 10(1), 50–68. https://doi.org/10.1057/jos.2014.39
- Chick, S. E., Mamani, H., & Simchi Levi, D. (2008). Supply chain coordination and influenza vaccination. Operations Research, 56(6), 1493–1506. https://doi.org/10.1287/opre.1080.0527
- Cord, I., Nunes, L. T., Barroso, C. X., Freire, A. S., Gadig, O. B., Gomes, P. B., & Floeter, S. R. (2022). Brazilian marine biogeography: A multi-taxa approach for outlining sectorization. Marine Biology, 169(5), 1–13. https://doi.org/10.1007/s00227-022-04045-8
- De Angelis, V., Felici, G., & Impelluso, P. (2003). Integrating simulation and optimisation in health care centre management. European Journal of Operational Research, 150(1), 101–114. https://doi.org/10.1016/S0377-2217(02)00791-9
- De Assis, L. S., Franca, P. M., & Usberti, F. L. (2014). A redistricting problem applied to meter reading in power distribution networks. Computers & Operations Research, 41, 65–75. https://doi.org/10.1016/j.cor.2013.08.002
- Dufo-López, R., Pérez-Cebollada, E., Bernal-Agustín, J. L., & Martínez-Ruiz, I. (2016). Optimisation of energy supply at off-grid healthcare facilities using Monte Carlo simulation. Energy Conversion and Management, 113, 321–330. https://doi.org/10.1016/j.enconman.2016.01.057
- Duguay, C., & Chetouane, F. (2007). Modeling and improving emergency department systems using discrete event simulation. Simulation, 83(4), 311–320. https://doi.org/10.1177/0037549707083111
- Figueira, G., & Almada-Lobo, B. (2014). Hybrid simulation–optimization methods: A taxonomy and discussion. Simulation Modelling Practice and Theory, 46, 118–134. https://doi.org/10.1016/j.simpat.2014.03.007
- Fournier, D. L., & Zaric, G. S. (2013). Simulating neonatal intensive care capacity in British Columbia. Socio-Economic Planning Sciences, 47(2), 131–141. https://doi.org/10.1016/j.seps.2013.01.001
- Gao, P., Wang, X., Jing, Y., & Deng, L. (2015). Differentiated pricing policy for new, remanufactured and refurbished products. Proceedings of the Institution of Mechanical Engineers, Part B: Journal of Engineering Manufacture, 229(11), 2063–2075. https://doi.org/10.1177/0954405414543315
- Gonsalves, T., & Itoh, K. (2009). Service optimization with patient satisfaction in healthcare systems. Journal of Simulation, 3(3), 150–162. https://doi.org/10.1057/jos.2009.2
- Günal, M. M., & Pidd, M. (2010). Discrete event simulation for performance modelling in health care: A review of the literature. Journal of Simulation, 4(1), 42–51. https://doi.org/10.1057/jos.2009.25
- Guo, P., Tang, C. S., Wang, Y., & Zhao, M. (2016). The impact of reimbursement policy on patient welfare, readmission rate and waiting time in a public healthcare system: Fee-for-service vs. UCLA Anderson School of Management Working Paper.
- Hoel, M., & Sæther, E. M. (2003). Public health care with waiting time: The role of supplementary private health care. Journal of Health Economics, 22(4), 599–616. https://doi.org/10.1016/S0167-6296(03)00007-9
- Hosking, M., Roberts, S., Uzsoy, R., & Joseph, T. M. (2013). Investigating interventions for increasing colorectal cancer screening: Insights from a simulation model. Socio-Economic Planning Sciences, 47(2), 142–155. https://doi.org/10.1016/j.seps.2012.10.001
- Jiang, H., Pang, Z., & Savin, S. (2012). Performance-based contracts for outpatient medical services. Manufacturing & Service Operations Management, 14(4), 654–669. https://doi.org/10.1287/msom.1120.0402
- Jun, J. B., Jacobson, S. H., & Swisher, J. R. (1999). Application of discrete-event simulation in health care clinics: A survey. The Journal of the Operational Research Society, 50(2), 109–123. https://doi.org/10.1057/palgrave.jors.2600669
- Kaya, O., Teymourifar, A., & Ozturk, G. (2020). Analysis of different public policies through simulation to increase total social utility in a healthcare system. Socio-Economic Planning Sciences, 70, 100742. https://doi.org/10.1016/j.seps.2019.100742
- Kaya, O., Teymourifar, A., & Ozturk, G. (2020). Public and private healthcare coordination: An analysis of contract mechanisms based on subsidy payments. Computers & Industrial Engineering, 146, 106526. https://doi.org/10.1016/j.cie.2020.106526
- Knight, V. A., Williams, J. E., & Reynolds, I. (2012). Modelling patient choice in healthcare systems: Development and application of a discrete event simulation with agent-based decision making. Journal of Simulation, 6(2), 92–102. https://doi.org/10.1057/jos.2011.21
- Komashie, A., & Mousavi, A. (2005, December). Modeling emergency departments using discrete event simulation techniques. In Proceedings of the Winter Simulation Conference, 2005. (pp. 5). IEEE. https://doi.org/10.1109/WSC.2005.1574570
- Kuljis, J., Paul, R. J., & Stergioulas, L. K. (2007, December). Can health care benefit from modeling and simulation methods in the same way as business and manufacturing has? In 2007 Winter Simulation Conference (pp. 1449–1453). IEEE. https://doi.org/10.1109/WSC.2007.4419755.
- Lin, M., Chin, K. S., Ma, L., & Tsui, K. L. (2020). A comprehensive multi-objective mixed integer nonlinear programming model for an integrated elderly care service districting problem. Annals of Operations Research, 291(1), 499–529. https://doi.org/10.1007/s10479-018-3078-6
- Lin, C. H., Kao, C. Y., & Huang, C. Y. (2015). Managing emergency department overcrowding via ambulance diversion: A discrete event simulation model. Journal of the Formosan Medical Association, 114(1), 64–71. https://doi.org/10.1016/j.jfma.2012.09.007
- Liu, H., Erdogan, A., Lin, R., & Tsao, H. S. J. (2020). Mathematical models of political districting for more representative governments. Computers & Industrial Engineering, 140, 106265. https://doi.org/10.1016/j.cie.2019.106265
- Liu, Z., Rexachs, D., Epelde, F., & Luque, E. (2017). A simulation and optimization based method for calibrating agent-based emergency department models under data scarcity. Computers & Industrial Engineering, 103, 300–309. https://doi.org/10.1016/j.cie.2016.11.036
- Ltaif, A., Ammar, A., & Khrifch, L. (2022). A goal programming approach based on simulation and optimization to serve patients in an external orthopedic department. Journal of Simulation, 1–11. https://doi.org/10.1080/17477778.2022.2032432
- Ma, X., Zhao, X., & Guo, P. (2022). Cope with the COVID-19 pandemic: Dynamic bed allocation and patient subsidization in a public healthcare system. International Journal of Production Economics, 243, 108320. https://doi.org/10.1016/j.ijpe.2021.108320
- Mielczarek, B., & Uziałko-Mydlikowska, J. (2012). Application of computer simulation modeling in the health care sector: A survey. Simulation, 88(2), 197–216. https://doi.org/10.1177/0037549710387802
- Mohammed, G., & El Bekkaye, M. (2021). Fuzzy Dynamic Airspace Sectorization Problem. In Machine Intelligence and Data Analytics for Sustainable Future Smart Cities (pp. 229–250). Springer. https://doi.org/10.1007/978-3-030-72065-0_13
- Muralidhar, K., SWENSETHJ, S. R., & WILSON, R. L. (1992). Describing processing time when simulating JIT environments. International Journal of Production Research, 30(1), 1–11. https://doi.org/10.1080/00207549208942874
- Nguyen, A. T., Reiter, S., & Rigo, P. (2014). A review on simulation-based optimization methods applied to building performance analysis. Applied Energy, 113, 1043–1058. https://doi.org/10.1016/j.apenergy.2013.08.061
- Petering, M. E., Aydas, O. T., Kuzu, K., & Ross, A. (2015). Simulation analysis of hospital intensive care unit reimbursement policies from the triple bottom line perspective. Journal of Simulation, 9(2), 86–98. https://doi.org/10.1057/jos.2014.24
- Phillips, R. L. (2021). Pricing and revenue optimization. In Pricing and Revenue Optimization. Stanford university press. https://doi.org/10.1515/9781503614260
- Pilgrim, H. (2009). Simulation in healthcare—part 1. Journal of Simulation, 3(3), 129. https://doi.org/10.1057/jos.2009.7
- Qian, Q., Guo, P., & Lindsey, R. (2017). Comparison of subsidy schemes for reducing waiting times in healthcare systems. Production and Operations Management, 26(11), 2033–2049. https://doi.org/10.1111/poms.12738
- Qian, Q., & Zhuang, W. (2017). Tax/Subsidy and capacity decisions in a two-tier health system with welfare redistributive objective. European Journal of Operational Research, 260(1), 140–151. https://doi.org/10.1016/j.ejor.2016.11.048
- Qin, H., & Prybutok, V. R. (2013). A quantitative model for patient behavioral decisions in the urgent care industry. Socio-Economic Planning Sciences, 47(1), 50–64. https://doi.org/10.1016/j.seps.2012.08.003
- Rahimi Rise, Z., & Ershadi, M. M. (2021). An integrated HFMEA simulation-based multi-objective optimisation model to improve the performances of hospitals: A case study. Journal of Simulation, 1–22. https://doi.org/10.1080/17477778.2021.2015260
- Raza, S. A. (2015). Optimal fare price differentiation with demand leakage in airline industry. International Journal of Revenue Management, 8(2), 99–129. https://doi.org/10.1504/IJRM.2015.069999
- Rios-Mercado, R. Z., & Escalante, H. J. (2016). GRASP with path relinking for commercial districting. Expert Systems with Applications, 44, 102–113. https://doi.org/10.1016/j.eswa.2015.09.019
- Ruohonen, T., Neittaanmaki, P., & Teittinen, J. (2006, December). Simulation model for improving the operation of the emergency department of special health care. In Proceedings of the 2006 Winter Simulation Conference (pp. 453–458). IEEE. https://doi.org/10.1109/WSC.2006.323115
- Smith, H., Currie, C., Chaiwuttisak, P., & Kyprianou, A. (2018). Patient choice modelling: How do patients choose their hospitals? Health Care Management Science, 21(2), 259–268. https://doi.org/10.1007/s10729-017-9399-1
- Sudtachat, K., Mayorga, M. E., Chanta, S., & Albert, L. A. (2020). Joint relocation and districting using a nested compliance model for EMS systems. Computers & Industrial Engineering, 142, 106327. https://doi.org/10.1016/j.cie.2020.106327
- Swisher, J. R., & Jacobson, S. H. (2002). Evaluating the design of a family practice healthcare clinic using discrete-event simulation. Health Care Management Science, 5(2), 75–88. https://doi.org/10.1023/A:1014464529565
- Talluri, K. T., & Van Ryzin, G. (2004). The theory and practice of revenue management (Vol. 1). Kluwer Academic Publishers. https://doi.org/10.1007/b139000
- Tang, J., Alam, S., Lokan, C., & Abbass, H. A. (2012, June). A multi-objective evolutionary method for dynamic airspace re-sectorization using sectors clipping and similarities. In 2012 IEEE Congress on Evolutionary Computation (pp. 1–8). IEEE. https://doi.org/10.1109/CEC.2012.6253008
- Tanwar, T., Kumar, U. D., & Mustafee, N. (2020). Optimal package pricing in healthcare services. The Journal of the Operational Research Society, 71(11), 1860–1872. https://doi.org/10.1080/01605682.2019.1654416
- Teixeira, R. J., ROMANI, Í., & Cugnasca, P. S. (2007). Analysis of the impact of the use of the dynamic resectorization in air traffic control workload by computational simulations. In Air Transport Research Society World Conference, California, Berkeley, 21 - 23 Jun 2007.
- Teymourifar, A. (2019). Analysis of public healthcare policies to improve social utility using stochastic models.
- Teymourifar, A. (2022). A Simulation-Based Approach to Reduce Waiting Times in Emergency Departments. In International Conference Innovation in Engineering (pp. 232–244). Springer, Cham. https://doi.org/10.1007/978-3-031-09385-2_21
- Teymourifar, A., Kaya, O., & Ozturk, G. (2021). Contracting models for pricing and capacity decisions in healthcare systems. Omega, 100, 102232. https://doi.org/10.1016/j.omega.2020.102232
- Teymourifar, A., Rodrigues, A. M., & Ferreira, J. S. (2021). A comparison between simultaneous and hierarchical approaches to solve a multi-objective location-routing problem. In Graphs and Combinatorial Optimization: From Theory to Applications (pp. 251–263). Springer. https://doi.org/10.1007/978-3-030-63072-0_20
- Trandac, H., Baptiste, P., & Duong, V. (2005). Airspace sectorization with constraints. RAIRO-Operations Research, 39(2), 105–122. https://doi.org/10.1051/ro:2005005
- Tyler, J. M., Murch, B. J., Vasilakis, C., & Wood, R. M. (2022). Improving uptake of simulation in healthcare: User-driven development of an open-source tool for modelling patient flow. Journal of Simulation, 1–18. https://doi.org/10.1080/17477778.2022.2081521
- Ulusoy, A. J., Mahmoud, H. A., Pecci, F., Keedwell, E. C., & Stoianov, I. (2022). Bi-objective design-for-control for improving the pressure management and resilience of water distribution networks. Water Research, 222, 118914. https://doi.org/10.1016/j.watres.2022.118914
- Upadhyay, D., Tiwari, P., Mohd, N., & Pant, B. (2022, April). Capacity Enhancement for Cellular System using 5G Technology, mmWave and Higher order Sectorization. In 2022 IEEE 11th International Conference on Communication Systems and Network Technologies (CSNT) (pp. 422–427). IEEE. https://doi.org/10.1109/CSNT54456.2022.9787668.
- Uriarte, A. G., Zúñiga, E. R., Moris, M. U., & Ng, A. H. (2017). How can decision makers be supported in the improvement of an emergency department? A simulation, optimization and data mining approach. Operations Research for Health Care, 15, 102–122. https://doi.org/10.1016/j.orhc.2017.10.003
- Vali Mohamad, N. M., Ambastha, P., Gautam, S., Jain, R., Subramaniyam, H., & Muthukaruppan, L. (2021). Dynamic Sectorization and parallel processing for device-to-device (D2D) resource allocation in 5G and B5G cellular network. Peer-To-Peer Networking and Applications, 14(1), 296–304. https://doi.org/10.1007/s12083-020-00949-8
- Vegas Niño, O. T., Martínez Alzamora, F., & Tzatchkov, V. G. (2021). A decision support tool for water supply system decentralization via distribution network sectorization. Processes, 9(4), 642. https://doi.org/10.3390/pr9040642
- Wang, Y., Hare, W. L., Vertesi, L., & Rutherford, A. R. (2011). Using simulation to model and optimize acute care access in relation to hospital bed count and bed distribution. Journal of Simulation, 5(2), 101–110. https://doi.org/10.1057/jos.2010.7
- Wolk, A., & Ebling, C. (2010). Multi-channel price differentiation: An empirical investigation of existence and causes. International Journal of Research in Marketing, 27(2), 142–150. https://doi.org/10.1016/j.ijresmar.2010.01.004
- Xu, X., Zhao, R., & Xu, L. (2014). The differentiated pricing strategy or hotel under dual-channel reservation forms. Open Journal of Social Sciences, 2014(04), 352–358. https://doi.org/10.4236/jss.2014.24039
- Zhang, Y., Lu, H., Zhou, Z., Yang, Z., & Xu, S. (2021). Analysis and optimisation of perishable inventory with stocks-sensitive stochastic demand and two-stage pricing: A discrete-event simulation study. Journal of Simulation, 15(4), 326–337. https://doi.org/10.1080/17477778.2020.1745703
- Zhou, G., Min, H., & Gen, M. (2002). The balanced allocation of customers to multiple distribution centers in the supply chain network: A genetic algorithm approach. Computers & Industrial Engineering, 43(1–2), 251–261. https://doi.org/10.1016/S0360-8352(02)00067-0
- Zhou, W., Wan, Q., & Zhang, R. Q. (2017). Choosing among hospitals in the subsidized health insurance system of China: A sequential game approach. European Journal of Operational Research, 257(2), 568–585. https://doi.org/10.1016/j.ejor.2016.08.004