
 ?Mathematical formulae have been encoded as MathML and are displayed in this HTML version using MathJax in order to improve their display. Uncheck the box to turn MathJax off. This feature requires Javascript. Click on a formula to zoom.
ABSTRACT
Extant research on the effect of education system characteristics on school socio-economic segregation does not consider education as a complex system. This paper’s contribution lies in using agent-based modelling to simulate the effect of the interaction between families’ strategies for school selection and two education system characteristics: tracking – a system where students of different academic abilities are separated in different schools – and school accountability – the public availability of information on school quality. The model shows that school tracking and accountability tend to at the same time attenuate and increase school socio-economic segregation, but overall both policies tend to exacerbate segregation by eliciting competition for the best schools. The policy implications are: (i) tracking has a stronger exacerbating effect on segregation than accountability, (ii) the two polices interact to create compounding effects and (iii) by reducing residential segregation between families the segregating effect on schools of the two policies diminishes dramatically.
Introduction
School segregation – the unequal distribution of children from different socio-economic backgrounds across schools (Allen & Vignoles, Citation2007) – is an enduring problem in modern western societies (Gutiérrez et al., Citation2020). School segregation exacerbates inequalities in educational achievements (Langenkamp & Carbonaro, Citation2018; Levačić & Woods, Citation2002; Thrupp, Citation1995; Van Ewijk & Sleegers, Citation2010) and political competences (Janmaat, Citation2020), leads to larger inequalities in adult outcomes (Palardy, Citation2015), and threatens social cohesion (Mickelson & Nkomo, Citation2012). School segregation represents a challenge for research as it is the aggregate result of actions and preferences of families that give rise to emerging outcomes which were not intended by families or policy. This makes segregation a complex phenomenon, which cannot be studied as the sum of policies’ intentions or families’ strategies.
This paper focuses on two key education system characteristics which are consequential for school socio-economic segregation: school tracking, which determines how students are selected into schools, and school accountability, i.e., the mechanisms to hold schools responsible for the quality of their teaching. There are different forms of accountability, such as inspecting the financial management of the schools and involving students and parents in the school governance, yet this paper focuses on the public availability of information on school quality, which is the dimension of accountability that is most associated with students’ performance (Fuchs & Wößmann, Citation2007; Jürges et al., Citation2005; Woessmann, Citation2005). School accountability aims to improve schools’ performance by providing families with information on schools’ quality, but by encouraging competition between families for the best schools, it unintentionally affects school segregation. Families choose a particular school to benefit their children with no intention of affecting the broader community, yet with their choice they change the social composition of the school their child attends (Jenkins et al., Citation2008).
Educational tracking is the policy of allocating students into different types of school tracks varying in the content and level of the curriculum. Although all educational systems use some form of tracking or streaming, we follow previous comparative studies (Bol et al., Citation2014; Gorard & Smith, Citation2004; Jenkins et al., Citation2008; Van de Werfhorst & Mijs, Citation2010), and focus on curricular tracking between school types, i.e., a system where students of different academic abilities are separated in different schools. In most countries the tracking starts at age 15 or 16 with the transition to upper secondary education, offering one or more general or academic tracks preparing for higher education, and a series of vocational tracks offering training for specific occupations in the labour market. Academic tracks have higher esteem and accessing them is selective and is based on students’ prior academic achievement. The use of students’ prior achievement in the school admission policy aims to select students to cater education to the students’ needs. The policy does not intend to change the school’s socio-economic composition, yet one of its unintended consequences is a change in the socio-economic composition of the school because pupils’ academic achievement is associated with their socio-economic background (Thomson, Citation2018).
The analysis of school segregation is further complicated by residential segregation (Jenkins et al., Citation2008), which is external to the education system, but nonetheless has an impact on school segregation. The driving force of residential segregation – which has risen over the last two decades (Fujita & Maloutas, Citation2016; T. Tammaru et al., Citation2016, Citation2020) – is the choice of high-income socio-economic groups, which can afford to realise their residential preferences, whilst poorer socio-economic groups have more limited choice of where to live and over the school to enrol their children to (Hulchansky, Citation2010).
Conducting empirical analyses on the association between education system characteristics and school segregation is difficult, which explains why empirical studies on the determinants of school segregation are few. How schools select students and the degree to which schools are accountable for their performance are factors which vary across countries, requiring an international, comparative research design and data on families’ choices and school characteristics, which extant international datasets do not contain. The difficulties of conducting a statistical analysis at the country level with several explanatory factors and the lack of international data is a barrier to conducting research on the above questions. Indeed, only a handful of multi-country studies analysed the association between tracking and school segregation (Burger, Citation2019; Chmielewski, Citation2014; Chmielewski & Savage, Citation2015; Gorard & Smith, Citation2004; Jenkins et al., Citation2008; Murillo et al., Citation2018; Strello et al., Citation2022), and no study has simultaneously considered the effect of school accountability on school segregation. A few studies were conducted at the city level (Gortázar et al., Citation2020; Klaauw et al., Citation2019). However, the limited scope of these studies does not allow for conclusions about national policies, such as school accountability and school tracking. This paper uses agent-based modelling, which – based on realistic assumptions – runs simulations of the emerging segregation outcomes which result from different behavioural and policy hypotheses. Agent-Based Models (ABMs) are effective tools to conduct counterfactual analysis in situations like these where statistical analyses are not possible because of either the lack of data or limitations arising from small sample sizes. Another advantage of agent-B=based modelling is that it explains how individual actions give rise to complex, aggregate and emerging phenomena (Bianchi & Squazzoni, Citation2019; Epstein, Citation2008; Franck, Citation2013) such as school segregation. Rather than assuming the mechanisms that lead to macro phenomena such as segregation, this paper attempts to account for the actions and motivations of students and families which give rise to school socio-economic segregation.
The model we propose here is a typification (Boero & Squazzoni, Citation2005) of school segregation which refers to Western education systems and is intended to investigate some key general features of education systems rather than specifics of a particular region or country.The focus on macro characteristics that vary across countries is suitable to the creation of a typification, because a national-specific model would answer those questions with specific conditions (Boero & Squazzoni, Citation2005).
The model is abstract and generically applicable to several contexts, which are represented using OECD and other sources of international comparative data. Averaging household and students’ characteristics across Western countries, we construct an “ideal”, average context as a reference for our model. Grounded in this abstract context, the model aims to to analyse how family strategies and national policies drive segregation in state schools.Footnote1 Specifically, using evidence-based assumptions about individual preferences, the model simulates the effects of levels of school accountability (vs non-accountability) and selective (vs comprehensive) systems on school segregation. These are policies that typically vary across countries, with the majority of European countries being accountable and selective, Sweden, Canada and the United States being non-accountable and comprehensive, Spain and Italy being selective but non-accountable, and Norway being comprehensive but accountable (Leschnig et al., Citation2022). The proposed study offers one of the first analyses of the effects of education system characteristics on segregation. It is also unique in analysing the combined effects of macro characteristics and families’ preferences. As it is one of the first studies using ABMs in education research, it can also be considered a proof of concept for future analyses. As we will show below, the model is able to reproduce a realistic representation of segregation levels across Western societies (Gutiérrez et al., Citation2020).
School tracking and accountability
Previous research argued that school tracking increases social inequalities in educational attainment as it exacerbates the effect of parents’ socio-economic status (SES) on achievement and aspirations (Van de Werfhorst & Mijs, Citation2010). Research confirms that compared to the academic track, the non-academic track is typically not as resourced (Figlio & Page, Citation2002), is characterised by less academically oriented peers (Entorf & Lauk, Citation2008), is less demanding (Gamoran & Mare, Citation1989), and therefore has a negative effect on academic performance. As low SES students are disproportionally represented in the non-academic track the overall result is increasing educational inequalities between high and low SES children (Hallinan, Citation1994; Van de Werfhorst & Mijs, Citation2010). Empirical evidence points to increased SES inequalities in cognitive and non-cognitive outcomes, and educational attainment linked to school tracking (Hanushek & Woßmann, Citation2006; Lavrijsen & Nicaise, Citation2016; Parker et al., Citation2016; Reichelt et al., Citation2019; Strello et al., Citation2022; Van de Werfhorst & Mijs, Citation2010). The alternative view is that in a tracked system upper- and middle-class children are less likely to pursue “status maintenance” independent of academic ability as it is more difficult to enter the more academic track if their academic ability is not high enough. Consequently, the focus on academic performance could mitigate the effect of background on school choices, thus reducing segregation (Bol et al., Citation2014).
Only a few studies have analysed the association between school tracking and school SES segregation. The main findings are: (i) that there is considerable international variation in the degree of school SES segregation, confirming the importance of institutional, country level factors; (ii) the stability over time of school SES segregation (Gutiérrez et al., Citation2020; Jenkins et al., Citation2008); and, (iii) contrasting findings regarding the relationship between the degree of tracking and school socioeconomic segregation, with some studies suggesting that socio-economic segregation tends to be higher in countries implementing early tracking (starting at lower secondary) but others suggesting that high levels of segregation are instead associated with countries using late tracking (Burger, Citation2019; Chmielewski & Savage, Citation2015; Chmielewski, Citation2014; Gorard & Smith, Citation2004; Jenkins et al., Citation2008; Murillo et al., Citation2018, OECD Citation2019; Strello et al., Citation2022). These studies are limited by a relatively small sample size, which prevents multivariate analysis and makes it hard to analyse the interaction between the effect of tracking and that of other institutional factors such residential segregation and family school choice.
We now discuss the potential impact of accountability on school segregation. As there is no research on the topic, we propose two alternative hypotheses. We know that in systems where schools are accountable, academic performance is more important as it signals school quality (Fuchs & Wößmann, Citation2007). Hence, one hypothesis is that accountability incentivises families to choose good schools regardless of their social composition, which tends to reduce school segregation. If there is no public information on school performance, families will choose schools based solely on the school’s academic status and social composition, which exacerbates segregation. If information on performance is publicly available, then families weigh social composition, status and school performance, and high-income families have an incentive to choose the high performing schools regardless of their social composition. Empirical research showed that school accountability, and in particular central exit examinations – which are a more objective signal – mitigates the effect of tracking on inequality of opportunity (Bol et al., Citation2014). An implication of this finding is that school accountability might reduce school segregation.
Conversely, it is possible that accountability exacerbates segregation. Accountability changes the way in which individuals choose schools, generating competition between families and schools, which exacerbates inequalities in the housing market and could lead to marginalisation and segregation in schools (Benabou, Citation1993). The overall level of school segregation will depend on which of the two mechanisms prevails. So far, the empirical research on education has not considered the hypothesis of a possible exacerbating effect of accountability on segregation. Here we provide the first analysis of the diverse implications of accountability for school segregation using an agent-based model.
Despite the potential of ABMs in education research (Marlin & Sohn, Citation2016), ABMs have been rarely used in education research. Manzo (Citation2013) demonstrates that the interdependencies between educational choices within the relevant network of peers is key to explain social class inequalities in educational choices in France.
Moving to studies that used AB modelling to analyse education policies, Díaz et al. (Citation2019) analysed the consequence of a choice-based system as opposed to a residential system. They found that a choice-based system improves achievement overall by improving the achievement of low-income students. However, the model did not analyse segregation, but predicted an increase in enrolment of low-income students in higher achievement schools, suggesting that school choice tends to decrease school segregation. Millington et al. (Citation2014) analyse the implications of distance-based school-place allocation policies on London-based local educational authorities. Using aspirations for the best schools as the main parents’ characteristics, they found that it is families with above average, but not very high, aspirations that are unable to get their child into their preferred school more frequently than other parents. This study is relevant to the proposed model because it shows that school choice in combination with a distance-based admission policy can result in unexpected and suboptimal outcomes, i.e., parents with above average aspirations being penalised in school allocation. By contrast, Johansson (Citation2022) considered residential segregation in a model of school segregation and found that the impact of school allocation mechanisms such as distance-based or lottery-based methods is negligible compared to the impact of residential segregation.
Economic inequality and family choices
After moving to a bigger house and moving to a better area, school choice is a key reason for moving and parents are willing to pay significantly more to buy a house located near to better performing schools (Bernelius & Vilkama, Citation2019; Hansen, Citation2014; Owens, Citation2017). This suggests that the segregation of economically disadvantaged families in less desirable areas at least partly relates to school choice through the competition for houses in areas where schools perform better.
Families across the socio-economic spectrum, tend to choose schools proactively within their district based on academic quality and socio-economic composition (Riedel et al., Citation2010). Whilst research shows that families are proactive in selecting their children’s school, they are constrained by distance. A reform that extended the choice set of Madrid families from the schools within the district of residence to the schools of the entire city did not change the level of school segregation, suggesting that families prefer schools which are in their vicinity (Gortázar et al., Citation2020). Research conducted on school choices in the UK showed that the introduction of a distance-based school-place admission policy, which allocates places at over-subscribed (popular) schools according to how near a family lives from the school, did not significantly change the level of segregation in schools (Allen & Vignoles, Citation2007).
The distance from school is thus a key factor influencing school choice and will be included in the present model.
The proposed model considers that families move to the area in which the chosen school is located. This mechanism best describes systems which use a distance-based school-place admission policy, yet we propose that this may be a good approximation to understand school choice in other systems, too. Indeed, overall research – conducted across systems with and without a distance-based admission policy – shows that families prefer schools in the vicinity (Gortázar et al. (Citation2020), for a review see Black and Machin (Citation2011)). The plausible reason is the reduction of travel costs and hazards for young children associated with school vicinity (Guntermann & Colwell, Citation1983). We therefore assume that families avoid schools which would require commuting long distances to attend. In the model, this is translated into considering that families move to the “patch” where the school is located and do not commute between patches. This is a simplifying assumption of a more nuanced reality where the families’ propensity to commute reduces progressively for more distant patches.
The model
A complete model description, following the ODD (Overview, Design concepts, Details) protocol (Grimm et al., Citation2020) is provided in the supplementary material.
The proposed model aims to represent school choices and the consequent school segregation under various policy scenarios.
The model includes the following entities: schools and students. The state variables characterising those entities are listed in . Schools are created by assigning a special status to selected “patches”, whilst students are represented by “agents”.Footnote2
Table 1. Entities and state variables.
Spatial and temporal scales
Students and schools are placed randomly in a two-dimensional grid, with a total of 33 times 33 = 1089 square patches. The model runs at a 1-academic year time step and focuses on the choice of secondary school and its consequence for school segregation.
Environment
9000 Students are divided into two social classes − 2700 upper class and 6300 intermediate and working-class students – and choose between 30 schools of size 300, reflecting a typical scenario that students face when deciding to enter secondary schools (Giambona & Porcu, Citation2018; Leithwood & Jantzi, Citation2009). The two social classes have different (normally distributed) incomes so that the advantaged group (which includes 30% of families) have 55% of all the income, reflecting the average income distribution in 2019 across 49 countries represented in the WID (world inequality database, Alvaredo et al., Citation2018). 13 schools are assigned the status of academic school and 17 that of vocational secondary schools to reflect the higher incidence of vocational schools across education systems ().
Table 2. Variables defining the model’s environment and scenarios.
In systems where schools are accountable, information regarding the quality of schools is available to the public.
To measure school segregation, we use two commonly used indices – the dissimilarity index D (Massey & Denton, Citation1988; Duncan & Duncan, Citation1955) and the square root Index H (Hutchens Citation2001) – both of which capture the degree to which the distribution of two groups across schools differs from the distribution of the two groups in the broader population. Specifically, we have
where and
are the numbers of children of class
(upper class) and
(working/intermediate class) in each school
.
and
are the numbers of children of class
and
in the total population.
The index ranges from zero to one, whereby a value of zero indicates complete integration in that the proportion of both groups in every school is equal to the proportions found in the population; a value of one indicates that there is complete segregation of pupils in that each school hosts only one group of students. The index D has an intuitive interpretation as it represents the proportion of children that would need to be moved to a different school to have perfect school integration, where every school is a local representation of the distribution of classes in the overall population.
The index H:
The index H measures how far a school is from evenness in the distribution of students’ backgrounds. This is calculated as the difference between the geometrical mean of the proportions of students from different backgrounds in the absence of segregation, and the geometrical mean of the actual proportions.
Like previous studies (Gutiérrez et al., Citation2020; Jenkins et al., Citation2008), ours also shows that the two measures generate the same results. Hence, we use primarily the dissimilarity index D due to its ease of interpretation and its wide use in previous literature on school segregation (Burgess et al., Citation2019; Gorard, Citation2009; Gutiérrez et al., Citation2020; Jenkins et al., Citation2008). We test the robustness of the results to the use of the dissimilarity index in where we show the results obtained using the square root index H too. The conclusion is that the characteristics of the two indices do not affect the result. We do not use exposure measures, which are also commonly in social sciences, as they are not scale invariant (Frankel & Volij, Citation2007).
Table 3. School segregation by education policy and economic constraints. Dissimilarity index D and square root index H in parentheses (all standard errors are lower than 0.01).
Processes
The model allocates students to secondary schools based on students’ preferences and given budget constraints and school selectivity. Our model of student’s choices is based on the idea that the agents are boundedly rational. Following the seminal ideas of McFadden (Citation1974) school choices are assumed to be probabilistic, where noise in decision-making represents both potential factors influencing decisions which we do not explicitly account for and the limited knowledge and reasoning capabilities of the actors. In more detail, we model school choice using a probabilistic model called quantal choice model (Goeree et al., Citation2016; McKelvey & Palfrey, Citation1998) which is suitable to represent boundedly rational behaviour when the options are represented by a set of finite and discrete outcomes like in this case. To implement this, we proceed as follows. We first generate an individual rank ordering of schools using a Cobb-Douglas preference function , with
being the individual student (family) making the choice,
the set of schools and which implies that students trade-off between the different motives. The function calculates utilities from alternative choices and models the basis of selecting schools that maximise individual expectations. Students then select school
with probability
.
The utility function assumes that individuals tend to choose the best school they can enrol into, disregarding that individuals might decide to opt for a less ambitious and less optimal option. For example, individuals might decide not to opt for the most prestigious academic route because they deem this option as too risky (Pepper & Nettle, Citation2017). Whist we do not directly model these motives, we consider them and other factors that might reduce the tendency to choose the best option indirectly by introducing uncertainty and noise in the decision-making process. In the above, the parameter beta models the amount of noise in the decision-making process. Choosing then corresponds to a setting where all choices are equally likely, whereas a choice of large beta essentially recovers a choice where agents make decisions based on the strict preference ordering of the
. Intermediate beta values model choices driven by the preference ordering, but allows for deviations due to boundedly rational decision making (Fu et al., Citation2011).
Below, we follow Gortázar et al. (Citation2020) and assume that families prefer schools which are in the vicinity. Children do not commute to attend school, i.e., they attend the school in the area they live in. If they want to attend a school which is not in their area of residence, they (and their families) have to move to that area.
Families are constrained by the housing market. We model this constraint by narrowing the set of targeted schools to those ones attended by children whose family’s income is on average not much larger than the family which is choosing.
The simulation of school selection consists of the following steps:
First, students and schools are created and randomly located in the grid (see also ). As the purpose of the paper is to explore general mechanisms and not a specific school configuration, we thus abstract from modelling a specific geographical arrangement of schools and rather present averages over random configurations below.
Students identify eligible schools in terms of ability and income. Then, using a standard model of boundedly rational decision making, they probabilistically choose a school based on its utility from within this group and enrol in it. When students enrol in a school, families relocate from their initial random location to the area (“patch”) where the school is located. Some families will choose from a narrower pool of eligible schools because they are less willing to move for various reasons which make the family wanting to stay in the area they currently live in. Whilst we do not model explicitly the mechanisms that lead families not to relocate, we account for this possibility in a probabilistic way, such that families decide to move (and select a pool of eligible schools) with probability 0.9. This amounts to assume that 10% of families decide not to move regardless of whether or not their child meets the academic requirement for enrolment.
There are two settings to consider: one in which the system is tracked and one in which it is not. When the system is tracked, children with a performance of 1 SD below the school population average from the previous year, cannot access academic schools, hence they can only choose among vocational schools. There is also an economic constraint: economically disadvantaged families cannot access schools in which the average income of students’ parents is too high as described above. If the system is tracked and their academic ability is too low students can only target vocational schools. Within the group of eligible schools, students in random order pick the school that maximises their utility until the schools are gradually filled up. Schools enrol children on a first-come, first-served basis, until all places are filled. We use the term iteration to refer to one academic year. During the first iteration, students use the schools’ initial values on income and social composition to target a school. In the subsequent iterations, schools’ characteristics are updated using the previous cohort of students. When the schools are accountable, families include the school performance (calculated from the previous cohort) as a criterion to choose schools.
When the school’s average income of students’ parents is relatively high and the system is tracked it is possible that families do not have an eligible school in areas where they can afford to move to. Those families are assigned to the closest vocational school.
Once all children have enrolled in a school, their income and achievement are used to update the school variables, the round ends, the dissimilarity indices are computed, the current cohort of children leaves the school (i.e., is not part of the modelling anymore), and a new cohort of children is created and randomly placed in the grid for the next academic year/iteration where they will use the updated school variables to make their choice. Schools stay in their original location whilst their characteristics are updated as new cohorts of students enrol.
Results
School segregation over time/iterations
The simulations are stochastic (e.g., each iteration depends on probabilities and generates slightly different values each time it is repeated) and the results presented in the tables and in are averaged across 100 iterations. shows the dissimilarity index D over 120 iterations for a specific policy setting (comprehensive school system with accountable schools) with different initial levels of school segregation – complete segregation (70% of upper-class students in the 13 best performing schools and 0% in the 17 worst performing schools), average segregation (36% of upper-class students in the 13 best performing schools and 24% in the 17 worst performing schools) and no segregation (even distribution − 30% - of upper class students in each school). We notice that independent of initial conditions there is a transient of approximately five iterations. After this period the system settles into a pseudo-stationary state. In the following we are interested in average outcomes in the long term. Thus, we discard an initial transient of 20 iterations and calculate averages over the following 100 iterations from the stationary dynamics.
Figure 1. Segregation (dissimilarity index D) over 120 iterations (academic years) for different initial levels of school socio-economic segregation.
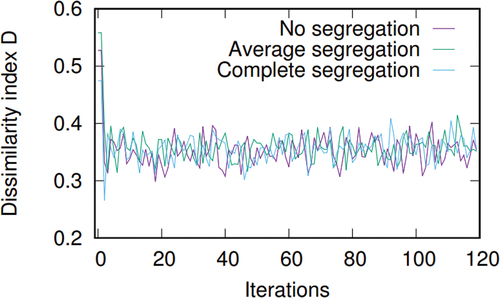
Results for typical simulation runs for the dissimilarity index D over iterations for three scenarios with different settings. Policy settings: comprehensive and accountable. Preference parameters: Performance = 0.4, Academic = 0, Social = 0.3, Cost = 0.15, Proximity = 0.15.
Model calibration and sensitivity analysis
presents the average level of segregation obtained for the different policy scenarios and economic constraints. Each line represents a combination of the two policies – tracking versus comprehensive system and school accountability versus non-accountability. averages the different sets of school preferences within each policy setting.Footnote3
Figure 2. Segregation (dissimilarity index D) by education policy and economic constraints.
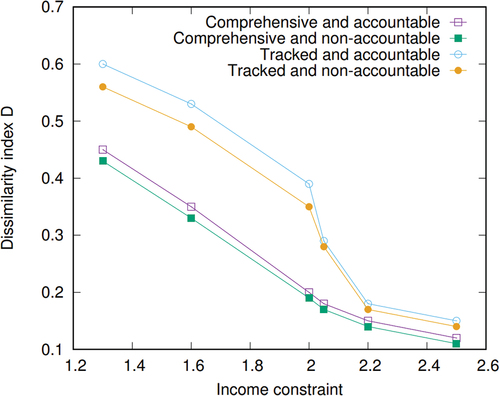
From , we see that the results corresponding to the income constraints in the range between 1.6 and slightly larger than 2 can replicate the range of values observed across OECD countries. Starting from plausible values taken from Van Ham et al. (Citation2015), we experimented with different values until we obtained unrealistically high values (income constraint = 1.3) and unrealistically low values of school segregation (income constraint = 2.5). Intermediate values of income constraint (1.6, 2, 2.05, and 2.2) provide more realistic values of school segregation, and we focus our discussion on these. Those intermediate values have been chosen because they mark a significant change in the level of segregation. Gutiérrez et al. (Citation2020) document that the average value of the dissimilarity index D is 0.38, with the Scandinavian countries having values of school segregation as low as 0.26 and, and central and Eastern European countries systems having values as high as 0.45 and we see that simulation outcomes are well within this range.Footnote4
Table 4. Segregation (dissimilarity index D) under different policy scenarios. Aggregate results (differences are significant at the 0.01 level and all standard errors are lower than 0.01).
Comparison between the dependence of the stationary level of segregation on the income constraint for the four different policy scenarios (also see ). Data points are calculated as averages from 400 iterations (100 per each set of school preferences) of the simulations in the stationary state after discarding an initial transient of 20 iterations (see ). Typical error bars are smaller than the size of points.
The impact of school tracking and accountability
We will now describe the results regarding the two education policies. The model compares the effect of each policy separately and in combination.
The model’s results show that both school tracking and, to a lesser extent, accountability exacerbate school socio-economic segregation ()
The horizontal axis in represents the income constraints. We have defined the constraint using the ratio of the average income of families of children who attend a given school to the income of the new entrant family. We have experimented with different ratio levels ranging from 1.3 (families can access schools where the average student has an income which is not more than 1.3 times higher than their own), to 2.5 (families can access schools where the average student has an income which is not more than 2.5 times higher than their own). The distance between each pair of lines is always statistically significant at any level of income constraints (t-test, p < 0.001).
Considering an intermediate income constraint of 2, tracked systems are associated with an index D of 0.37 (±0.01), whilst comprehensive systems have substantially lower values of 0.19 (+0.01) (). The competition for the academic schools marginalises disadvantaged families which have a lower income and a lower level of academic ability. Upper class and more academically oriented children tend to choose and be admitted to academic schools, whilst low ability children, which are disproportionally represented in the working/intermediate classes, end up in vocational schools. Accountability increases the segregation index by 0.01 point within the comprehensive system (1st versus 2nd row, ) and by 0.04 within the tracked systems (3rd versus 4th row, ).
Comparison between the dependence of the stationary level of segregation on the income constraint for the four different policy scenarios (also see ). Data points are calculated as averages from 400 iterations (100 per each set of school preferences) of the simulations in the stationary state after discarding an initial transient of 20 iterations (see ).
The effect of accountability on segregation is the result of two contrasting mechanisms. On the one hand, families will compete for the best schools using the available information on the school performance, which increases segregation. On the other the school’s performance competes with social composition as a selection criterion, which tends to reduce segregation. In systems with accountable schools the social composition of schools weighs on average 0.29 (or 29%) in comprehensive systems (average of weight of preference for social composition in comprehensive and accountable scenarios, , Model description document) and 0.2 (20%) in tracked systems relative to the other preference criteria (, model description document). Conversely, when schools are not accountable, the social composition of the school becomes more important: 42% versus 29% in comprehensive systems on average and 26% versus 20% in tracked systems on average (, model description document).
The larger effect of accountability within the tracked system indicates that two policies have compounding effects. In tracked systems which are also accountable, good schools and academic schools are desirable and eventually become more expensive to attend because of the competition for the houses in the vicinity of the desired school excluding low-income families from the competition. This conclusion is in line with Johnson et al. (Citation2021), who found that the academic achievement gap between high SES and low SES children is reduced more when policy interventions target multiple aspects of the school system.
We find that the effect of education policies varies for different levels of income segregation (). For high levels of income segregation, policies will have a larger effect. This is because school selection and economic segregation have compounding effects. Selective academic schools and good vocational schools, as an appealing target for wealthy families, are also more difficult to attend because of income requirements, with the consequence that selective and good schools become exclusive schools for wealthy families.
In typical simulation results (income constraint = 2, Academic = 0.6, performance = 0.2), 9 academic schools out of 13 will have an average income significantly higher than the average income of a working/intermediate class family (20000 EURO), and those schools will not be accessible for most children regardless of their academic achievement. Within academic schools there is also a correlation between average income and performance so that the academic schools which are accessible to average income working class children will have a lower performance. On the other hand, there will be a group of high income but low achieving students who cannot not enter academic schools who turn to vocational schools, which in turn become segregated into high achieving and in high demand schools and low achieving schools.
The impact of economic segregation
Most of the variation in the dissimilarity index D occurs between levels of income constraints. The dissimilarity index in increases as the income constraint becomes tighter (from 2.5 to 1.3 in ), while the gap between the lines representing the different policy scenarios is comparatively smaller. The line in grows steadily as the income constraint moves from 2.5 to 1.3. With an income constraint of 1.3 most students from the working/intermediate class families, whose average income is 20,000 EURO, will not be able to consider schools where the average income of the students is 26,000 EURO or higher, restricting considerably the pool of eligible schools and forcing many working/intermediate class families to segregate themselves in low performing schools. To understand that, let us consider the scenarios where education policy is “neutral” (there is no school selection and there is no school accountability) and families’ allocation to schools depends more on economic constraints (row 6, economic constraint = 1.6, ). In these scenarios the dissimilarity index D is 0.35 (±0.01) and typical simulation results show that 14 schools end up having an average income of families which is not larger than 32,000 and therefore are accessible to the average working/intermediate class family (20000 × 1.6 = 32000). The remaining 16 schools have an income larger than this threshold and are out of reach for most working class/intermediate class families.
The model’s results suggest that relatively small changes in economic segregation generate large effects in terms of reducing socio-economic school segregation. When the ratio between the average income in an area and the income of the poorest group in the area changes from 0.8 (income constraint = 1.3) to 0.6 (income constraint = 1.6), school socio-economic segregation drops by 0.1 points in tracked systems and 0.07 points in non-tracked systems ().
The model is also able to analyse what would happen if the levels of income segregation would drop more dramatically (income constraint = 2.5). In such a scenario, socio-economic segregation would be lower and policies would have a less strong effect. In other terms, when economic barriers are looser, differences in academic ability between individuals and differences between schools do not generate high levels of segregation on their own.
We now focus on the effect of the combination of preferences to assess the extent to which the results presented depends on the type of preferences theorised. We regress school segregation on the preference for academic schools (varying from 0 in comprehensive systems to 0.6 in a scenario where families assign a great deal of importance to choosing academic schools), school performance (varying from 0 in non-accountable systems to 0.4 in a scenario where families assign a great deal of importance to choosing good schools) and social composition and found that a 10% increase in the importance assigned to academic schools is associated with a 0.05 increase in the segregation index D (). The effect of performance is smaller (0.01) and just below the conventional significance threshold (p = 11%). The effect of social composition is small and non-significant.
Table 5. Regression analysis of the effect of main preference parameters on the segregation index D; betas (standard error in parentheses).
Higher values for the academic and performance parameters are associated with an increase in segregation levels, yet the conclusions regarding the exacerbating effect of both school tracking and to a lesser extent accountability with respect to school socio-economic segregation remain the same. This shows that our conclusions regarding the relative importance of the two education policies are independent from the specific configuration of the preference function.
Conclusions
The article proposes an agent-based model of school segregation. Using evidence about families’ characteristics and school choice strategies, the model simulated the effect of school tracking and school accountability on school segregation. The model is an illustration of the abstract relation between family, school and national system characteristics and does not intend to be specifically applicable to any case. It rather refers to the whole class of western societies as an ideal type, replicating the levels of segregations across western countries which range between the values of 0.26 and 0.45 of the dissimilarity index D (average 0.38, Gutiérrez et al., Citation2020). Compared to existing research (Burger, Citation2019; Chmielewski & Savage, Citation2015; Chmielewski, Citation2014; Gorard & Smith, Citation2004; Jenkins et al., Citation2008; Murillo et al., Citation2018; OECD Citation2019; Strello et al., Citation2022), which use country level samples with limited possibilities of conducting multivariate analysis and unpacking mechanisms that account for school segregation, the proposed model uses simulations to conduct counterfactual analysis, explicitly including families’ strategies. This represents an advantage as it allows to specify the diverse mechanisms of school segregation, i.e., the combination of different education policies and families’ preferences. The proposed model (i) presents the contrasting mechanisms through which the two education policies affect school segregation and (ii) is able to assess the combined effects of the policies, families’ strategies and residential segregation.
School tracking has an exacerbating effect on segregation because it encourages families to compete for the academic schools and because it prevents low achieving students – which are more likely to be from low SES families – from entering academic schools; yet it also has a mitigating effect on segregation, because the selective school admission policy prevents upper- and middle-class children from pursuing “status maintenance” independently of academic ability as it is more difficult to enter the more academic track if their academic ability is not high enough. The overall effect on segregation is large and positive, showing that the first mechanism prevails. Similarly, school accountability has diverse effects on school segregation. School accountability introduces measures of outcomes which incentives families to select schools based on performance over and above the social composition of the school. This tends to increase the competition among families for the better schools, but it also leads families to weigh less the socio-economic composition of the school. This is the first analysis that shows that school’s accountability simultaneously tends to reduce segregation by shifting the focus away from the socio-economic composition of the school and to increase segregation by eliciting competition between families for the best schools. The overall effect on segregation is exacerbating, which, although smaller relative to that of school tracking, means that the competition triggered by accountability has a stronger effect than the equalising effect of incentivising families to choose regardless of social composition. Our results show that those policies generate emerging outcomes, such as higher levels of school segregation, which were not part of the policy’s aim and through unintended mechanisms.
The model can assess the combined effect of the key elements of school segregation providing results which have important policy implications. Tracking has a stronger exacerbating effect on segregation than accountability and the two polices interact to create compounding effects. This is in contrast with Bol et al. (Citation2014), who concluded that school accountability mitigates the effect of tracking on inequality of opportunity, implying that school accountability might reduce school segregation.
A policy aiming at reducing school segregation should prioritise the reduction of the degree of tracking in the school system and should avoid having both tracking and accountability in the school system. Residential segregation is a major factor of school socio-economic segregation and exacerbates the segregating effect of the two education policies. Therefore, an effective way to reduce school socio-economic segregation without changing the education system is to reduce residential segregation between well-off and worse-off families. A reduction of residential segregation will dramatically diminish the segregating effect of education policy as worse-off families are locked out of the most desired areas and schools, no matter how motivated and academically talented they are. When the ratio between the average income in an area and the income of the poorest group in the area changes from a relatively high 0.8 to a more average 0.6, school socio-economic segregation drops by 0.1 points in tracked systems and 0.07 points in non-tracked systems (). This type of variation of income segregation is observed across cities in Europe (Van Ham et al., Citation2015), suggesting that those changes are within the capability of current policies.
Computational modelling is not frequently used in the social sciences. This paper shows that ABMs are a useful way to analyse complex phenomena by integrating theorisation and evidence. ABMs have the advantage of analysing both local interaction between agents and the effect of institutional factors (Bianchi & Squazzoni, Citation2019; Epstein, Citation2008; Franck, Citation2013). Considering the data limitations that researchers face when analysing complex phenomena, ABMs such as the one proposed here are valid tools to test theories and perform counterfactual analysis, making them a promising approach for future education research. A possible avenue to develop ABMs in education is to narrow the spatial focus of the model to develop analyses of geographically defined policies which reflects country/regional specific contexts and dynamics. A second is to assess the consequences of adopting a different conceptualisation of decision making. The presented model rests on the assumption that information about school characteristics is fully available to all individuals who use this information to make comparative judgements about schools. This approach could be extended by considering that the information is not equally available to all groups or that social groups have different reactions to the same information because of different expected returns (behaviour constellation of risk, Pepper and Nettle (Citation2017)). This implies that some groups might prefer less ambitious educational options because the more ambitious option is considered too risky (Pepper & Nettle, Citation2017). Although noise in defining preferences is considered indirectly via stochastic modelling of bounded rationality in decision-making, an explicit treatment of the heterogeneity of preferences is a development that future research should consider. We have also assumed in line with the existing research that families only attend schools which are in the vicinity. This makes the model particularly suitable to analyse systems with a distance-based admission policy, although we know that families tend to avoid schools requiring long commutes even in systems where a distance-based admission policy is not in place (Gortázar et al., Citation2020). Yet, the analysis depends on the assumption that families do not commute to distant schools and could change if we replace it with the more nuanced and realistic assumption that families’ propensity to commute declines with distance. Therefore, our model is suitable to illustrate segregation in distance-based admission systems and can be extended to other systems with less confidence.
The proposed agent-based model contributed not only to quantify the effect of school accountability and tracking on school segregation on school segregation but also to reveal the mechanisms that account for their effect. In conclusion, the proposed model provides a comprehensive framework that includes the key factors of school segregation: income inequality between families, family choices and education policy.
Supplemental Material
Download MS Word (104 KB)Disclosure statement
No potential conflict of interest was reported by the author(s).
Supplemental data
Supplemental data for this article can be accessed online at https://doi.org/10.1080/17477778.2024.2326138.
Notes
1. We focus on state schools as private ones have their own selection criteria, do not necessarily follow the national curriculum and require students’ families to pay fees.
2. The model is implemented in NetLogo 6.3.
3. Each set is characterised by different weights assigned to school’s performance, academic status, social composition, proximity, and housing cost.
4. We replicated the analyses using the median income as cut off point to divide the socio-economic groups, obtaining, as Gutiérrez et al. (Citation2020) did, the same results as those obtained using the 30th percentile as the cut-off point.
References
- Allen, R., & Vignoles, A. (2007). What should an index of school segregation measure? Oxford Review of Education, 33(5), 643–668. https://doi.org/10.1080/03054980701366306
- Alvaredo, F., Chancel, L., Piketty, T., Saez, E., & Zucman, G. (2018) World inequality database. Retrieved June, 2021, from https://wid.world.
- Benabou, R. (1993). Workings of a city: Location, education, and production. The Quarterly Journal of Economics, 108(3), 619–652. https://doi.org/10.2307/2118403
- Bernelius, V., & Vilkama, K. (2019). Pupils on the move: School catchment area segregation and residential mobility of urban families. Urban Studies, 56(15), 3095–3116. https://doi.org/10.1177/0042098019848999
- Bianchi, F., & Squazzoni, F. (2019). Modelling and social science: Problems and promises. In E. A. Moallemi, & F. J. de Haan (Eds.), Modelling transitions: Virtues, vices, Visions of the future (pp. 60–74). Routledge.
- Black, S. E., & Machin, S. (2011). Housing Valuation and School Performance. In E. Hanushek, S. Machin, & L. Woessmann (Eds.), Chap. 10 in Handbook in Economics of Education (Vol. 3, pp. 485–519). Elsevier.
- Boero, R., & Squazzoni, F. (2005). Does empirical embeddedness matter? Methodological issues on agent-based models for analytical social science. Journal of Artificial Societies and Social Simulation, 8(4), 1–6. https://www.jasss.org/8/4/6.html
- Bol, T., Witschge, J., Van de Werfhorst, H. G., & Dronkers, J. (2014). Curricular tracking and central examinations: Counterbalancing the impact of social background on student achievement in 36 countries. Social Forces, 92(4), 1545–1572. https://doi.org/10.1093/sf/sou003
- Burger, K. (2019). The socio-spatial dimension of educational inequality: A comparative European analysis. Studies in Educational Evaluation, 62, 171–186. https://doi.org/10.1016/j.stueduc.2019.03.009
- Burgess, S., Greaves, E., & Vignoles, A. (2019). School choice in England: Evidence from national administrative data. Oxford Review of Education, 45(5), 690–710. https://doi.org/10.1080/03054985.2019.1604332
- Chmielewski, A. K. (2014). An international comparison of achievement inequality in within-and between-school tracking systems. American Journal of Education, 120(3), 293–324. https://doi.org/10.1086/675529
- Chmielewski, A. K., & Savage, C. (2015). Socioeconomic segregation between schools in the United States and Latin America, 1970–2012. In G. W. McCarthy, G. K. Ingram, & S. A. Moody (Eds.), Land and the city (pp. 394–423). Lincoln Institute of Land Policy.
- Díaz, D. A., Jiménez, A. M., & Larroulet, C. (2019). An agent-based model of school choice with information asymmetries. Journal of Simulation, 15(1–2), 1–18. https://doi.org/10.1080/17477778.2019.1679674
- Duncan, O. D., & Duncan, B. (1955). A methodological analysis of segregation indexes. American sociological review, 20(2), 210–217.
- Entorf, H., & Lauk, M. (2008). Peer effects, social multipliers and migrants at school: An international comparison. Journal of Ethnic and Migration Studies, 34(4), 633–654. https://doi.org/10.1080/13691830801961639
- Epstein, J. M. (2008). Why model? Journal of Artificial Societies and Social Simulation, 11(4), 12.
- Erikson, R., Goldthorpe, J. H., & Portocarero, L. (2010). Intergenerational class mobility and the convergence thesis: England, France and Sweden 1. The British Journal of Sociology, 61(s1), 185–219. https://doi.org/10.1111/j.1468-4446.2009.01246.x
- Figlio, D. N., & Page, M. E. (2002). School choice and the distributional effects of ability tracking: Does separation increase inequality? Journal of Urban Economics, 51(3), 497–514. https://doi.org/10.1006/juec.2001.2255
- Franck, R. (Ed.). (2013). The explanatory power of models: Bridging the gap between empirical and theoretical research in the social sciences (Vol. 1). Springer Science & Business Media.
- Frankel, D. M., & Volij, O. (2007). Measuring segregation. Economics Working Papers (2002–2016). 180. http://lib.dr.iastate.edu/econ_las_workingpapers/180.
- Fuchs, T., & Wößmann, L. (2007). What accounts for international differences in student performance? A re-examination using PISA data. Empirical Economics, 32, 433–62.
- Fujita, K., & Maloutas, T. (Eds.). (2016). Residential segregation in comparative perspective: Making sense of contextual diversity. Routledge.
- Fu, F., Rosenbloom, D. I., Wang, L., & Nowak, M. A. (2011). Imitation dynamics of vaccination behaviour on social networks. Proceedings of the Royal Society B: Biological Sciences, 278(1702), 42–49. https://doi.org/10.1098/rspb.2010.1107
- Gamoran, A., & Mare, R. D. (1989). Secondary school tracking and educational inequality: Compensation, reinforcement, or neutrality? American Journal of Sociology, 94(5), 1146–1183. https://doi.org/10.1086/229114
- Giambona, F., & Porcu, M. (2018). School size and students’ achievement. Empirical evidences from PISA survey data. Socio-Economic Planning Sciences, 64, 66–77. https://doi.org/10.1016/j.seps.2017.12.007
- Goeree, J. K., Holt, C. A., & Palfrey, T. R. (2016). Quantal response equilibrium: A stochastic theory of games. Princeton University Press.
- Gorard, S. (2009). Does the index of segregation matter? The composition of secondary schools in England since 1996. British Educational Research Journal, 35(4), 639–652.
- Gorard, S., & Smith, E. (2004). An international comparison of equity in education systems. Comparative Education, 40(1), 15–28. https://doi.org/10.1080/0305006042000184863
- Gortázar, L., Mayor, D., Montalbán, J., Sarsanedas, E., Payà, A., Mañé, L., Pedro-Botet, J., & Benaiges, D. (2020). School choice priorities and school segregation: Evidence from Madrid (no. 1/2020). BMJ Open Diabetes Research and Care, 8(1). https://doi.org/10.1136/bmjdrc-2020-001254
- Grimm, V., Railsback, S. F., Vincenot, C. E., Berger, U., Gallagher, C., DeAngelis, D. L., Edmonds, B., Ge, J., Giske, J., Groeneveld, J., Johnston, A. S. A., Milles, A., Nabe-Nielsen, J., Polhill, J. G., Radchuk, V., Rohwäder, M.-S., Stillman, R. A., Thiele, J. C., & Ayllón, D. (2020). The ODD protocol for describing agent-based and other simulation models: A second update to improve clarity, replication, and structural realism. Journal of Artificial Societies and Social Simulation, 23(2). https://doi.org/10.18564/jasss.4259
- Guntermann, K. L., & Colwell, P. F. (1983). Property values and accessibility to primary schools. Real Estate Appraiser and Analyst, 49(1), 62–68.
- Gutiérrez, G., Jerrim, J., & Torres, R. (2020). School segregation across the world: Has any progress been made in reducing the separation of the rich from the poor? The Journal of Economic Inequality, 18(2), 157–179. https://doi.org/10.1007/s10888-019-09437-3
- Hallinan, M. T. (1994). Tracking: From theory to practice. Sociology of Education, 67(2), 79–84. https://doi.org/10.2307/2112697
- Hansen, K. (2014). Moving house for education in the pre‐school years. British Educational Research Journal, 40(3), 483–500.
- Hanushek, E. A., and Wößmann, L. (2006). Does early tracking affect educational inequality and performance? differences-in-differences evidence across countries. The Economic Journal, 116(510), C63–C76.
- Hulchansky, D. (2010). The three cities in Toronto: Income polarization among Toronto’s neighbourhoods, 1970–2005. University of Toronto.
- Hutchens, R. (2001). Numerical measures of segregation: Desirable properties and their implications. Mathematical Social Sciences, 42(1), 13–29.
- Janmaat, J. G. (2020). School social segregation and social inequalities in political engagement among 16 to 20 year olds in fourteen countries. Research Papers in Education, 37(1), 1–22. https://doi.org/10.1080/02671522.2020.1789716
- Jenkins, S. P., Micklewright, J., & Schnepf, S. V. (2008). Social segregation in secondary schools: How does England compare with other countries? Oxford Review of Education, 34(1), 21–37. https://doi.org/10.1080/03054980701542039
- Johansson, O. (2022). How do independent school admission rules affect school segregation?: An agent-based model in a Swedish context. Linköping University, Department of Management and Engineering, LIU-IEI-FIL-A–22/03962—SE.
- Johnson, J. J., IV, Padilla, J. J., & Diallo, S. Y. (2021). Closing the academic achievement gap: A system dynamics study. Journal of Simulation, 15(4), 284–308. https://doi.org/10.1080/17477778.2020.1718021
- Jürges, H., Schneider, K., & Büchel, F. (2005). The effect of central exit examinations on student achievement: Quasi-experimental evidence from TIMSS Germany. Journal of the European Economic Association, 3(5), 1134–1155. https://doi.org/10.1162/1542476054729400
- Klaauw, H., Sóvágó, S., & Oosterbeek, B. (2019). Why are schools segregated? Evidence from the secondary-school match in Amsterdam. Journal of Health Economics, 63, 145–158. https://doi.org/10.1016/j.jhealeco.2018.11.001
- Langenkamp, A. G., & Carbonaro, W. (2018). How school socioeconomic status affects achievement growth across school transitions in early educational careers. Sociology of Education, 91(4), 358–378. https://doi.org/10.1177/0038040718802257
- Lavrijsen, J., & Nicaise, I. (2016). Educational tracking, inequality and performance: New evidence from a differences-in-differences technique. Research in Comparative & International Education, 11(3), 334–349.
- Leithwood, K., & Jantzi, D. (2009). A review of empirical evidence about school size effects: A policy perspective. Review of Educational Research, 79(1), 464–490. https://doi.org/10.3102/0034654308326158
- Leschnig, L., Schwerdt, G., & Zigova, K. (2022). Central exams and adult skills: Evidence from PIAAC. Economics of Education Review, 90, 102289. https://doi.org/10.1016/j.econedurev.2022.102289
- Levačić, R., & Woods, P. A. (2002). Raising school performance in the league tables (part 1): Disentangling the effects of social disadvantage. British Educational Research Journal, 28(2), 207–226. https://doi.org/10.1080/01411920120122158
- Manzo, G. (2013). Educational choices and social interactions: A formal model and a computational test. In Class and stratification analysis (Vol. 30, pp. 47–100). Emerald Group Publishing Limited.
- Marlin, B., & Sohn, H. (2016). Using DEA in conjunction with designs of experiments: An approach to assess simulated futures in the Afghan educational system. Journal of Simulation, 10(4), 272–282. https://doi.org/10.1057/jos.2015.14
- Massey, D. S., & Denton, N. A. (1988). The dimensions of residential segregation. Social Forces, 67(2), 281–315. https://doi.org/10.2307/2579183
- McFadden, D. (1974). Conditional logit analysis of qualitative choice behavior. In P. Zarembka (Ed.), Frontiers in Econometrics (pp. 105–142). Academic Press.
- McKelvey, R. D., & Palfrey, T. R. (1998). Quantal response equilibria for extensive form games. Experimental Economics, 1(1), 9–41. https://doi.org/10.1023/A:1009905800005
- Mickelson, R. A., & Nkomo, M. (2012). Integrated schooling, life course outcomes, and social cohesion in multiethnic democratic societies. Review of Research in Education, 36(1), 197–238. https://doi.org/10.3102/0091732X11422667
- Millington, J., Butler, T., & Hamnett, C. (2014). Aspiration, attainment and success: An agent-based Model of distance-based school allocation. Journal of Artificial Societies and Social Simulation, 17(1), 10. https://doi.org/10.18564/jasss.2332
- Murillo, F. J., Hernandez-Castilla, R., Martínez-Garrido, C., & Hidalgo, N. (2018). Una Panoramica de la Segregacion Social de los Centros de Educacion Secundaria en Iberoamerica. In F. J. Murillo (Ed.), Avances en Democracia y Liderazgo Distribuido en Educacion: Actas del II Congreso Internacional de Liderazgo y Mejora de la Educacion (pp. 559–564).
- OECD. (2018). Equity in education: Breaking down barriers to social mobility. OECD Publishing. https://doi.org/10.1787/9789264073234-en
- OECD. (2020). PISA 2018 results (volume V): Effective policies, successful schools. OECD Publishing. https://doi.org/10.1787/ca768d40-en
- Owens, A. (2017). Racial residential segregation of school-age children and adults: The role of schooling as a segregating force. RSF: The Russell Sage Foundation Journal of the Social Sciences, 3(2), 63–80. https://doi.org/10.7758/rsf.2017.3.2.03
- Palardy, G. J. (2015). High school socioeconomic composition and college choice: Multilevel mediation via organizational habitus, school practices, peer and staff attitudes. School Effectiveness and School Improvement, 26(3), 329–353. https://doi.org/10.1080/09243453.2014.965182
- Parker, P. D., Jerrim, J., Schoon, I., & Marsh, H. W. (2016). A multination study of socioeconomic inequality in expectations for progression to higher education: The role of between-school tracking and ability stratification. American Educational Research Journal, 53(1), 6–32.
- Pepper, G. V., & Nettle, D. (2017). The behavioural constellation of deprivation: Causes and consequences. Behavioral and Brain Sciences, 40, e314. https://doi.org/10.1017/S0140525X1600234X
- Reichelt, M., Collischon, M., & Eberl, A. (2019). School tracking and its role in social reproduction: Reinforcing educational inheritance and the direct effects of social origin. The British Journal of Sociology, 70(4), 1323–1348.
- Riedel, A., Schneider, K., Schuchart, C., & Weishaupt, H. (2010). School choice in German primary schools. How binding are school districts? Journal for Educational Research Online, 2(1), 94–120.
- Strello, A., Strietholt, R., & Steinmann, I. (2022). Does tracking increase segregation? International evidence on the effects of between-school tracking on social segregation across schools. Research in Social Stratification and Mobility, 78, 100689. https://doi.org/10.1016/j.rssm.2022.100689
- Tammaru, T., Marcin´czak, S., Aunap, R., van Ham, M., & Janssen, H. (2020). Relationship between income inequality and residential segregation of socioeconomic groups. Regional Studies, 54(4), 450–461. https://doi.org/10.1080/00343404.2018.1540035
- Tammaru, T., Marcińczak, S., van Ham, M., & Musterd, M. (2016). Socioeconomic segregation in European capital cities: East meets west. Routledge.
- Thomson, S. (2018). Achievement at school and socioeconomic background—an educational perspective. Science of Learning, 3(1), 1–2. https://doi.org/10.1038/s41539-018-0022-0
- Thrupp, M. (1995). The school mix effect: The history of an enduring problem in educational research, policy and practice. British Journal of Sociology of Education, 16(2), 183–203. https://doi.org/10.1080/0142569950160204
- Van de Werfhorst, H. G., & Mijs, J. J. (2010). Achievement inequality and the institutional structure of educational systems: A comparative perspective. Annual Review of Sociology, 36(1), 407–428. https://doi.org/10.1146/annurev.soc.012809.102538
- Van Ewijk, R., & Sleegers, P. (2010). The effect of peer socioeconomic status on student achievement: A meta-analysis. Educational Research Review, 5(2), 134–150. https://doi.org/10.1016/j.edurev.2010.02.001
- Van Ham, M., Marcińczak, S., Tammaru, T., & Musterd, S. (2015). A multi-factor approach to understanding socio-economic segregation in European capital cities. In T. Tammaru, M. van Ham, S. Marcińczak, & S. Musterd (Eds.), Socio-economic segregation in European Capital Cities (pp. 1–29). East Meets West. Taylor & Francis.
- Woessmann, L. (2005). The effect heterogeneity of central examinations: Evidence from TIMSS, TIMSS‐Repeat and PISA. Education Economics, 13(2), 143–169. https://doi.org/10.1080/09645290500031165