
ABSTRACT
An analysis of published flood fatalities in Australia occurring between 1960 and 2015 revealed that 49% of 229 flood fatalities were vehicle related. After reviewing previous work on vehicle-related flood fatalities, this study examines attributes of roadways that may have influenced driver decisions to enter floodwaters and the survivability of people in vehicles that did so and concludes by discussing policy implications. Characteristics most frequently present were small upstream catchment length that may influence the rate of rise of floodwaters; the absence of roadside barricades; deep flooding immediately adjacent to the roadway; the absence of lighting; dipping road grades that lead floodwaters to increase once a vehicle enters them; the lack of curb and guttering and the inability of motorists to easily turn around. Each of these factors were observed in at least 50% of the cases studied and provide a risk-based means of assessing other sites vulnerable to flooding but where fatalities have not been observed to date.
Introduction
Research in many countries has highlighted risks to motorists entering floodwaters. This paper, first, reviews this research, before exploring the possible influence of road characteristics on flood fatalities.
In Australia, Haynes et al. (Citation2017) found 49% of flood fatalities that occurred between 1960 and 2015 were vehicle related, a figure almost identical to an earlier study by Fitzgerald, Du, Jamal, Clark, and Hou (Citation2010) who examined the period 1997–2008 and Peden, Franklin, Leggat & Aitken (Citation2017) who examined between 2002 and 2012. Between 1960 and 2015, 64% of these 229 vehicle-related deaths were associated with sedans and 19% with four-wheel-drive (4WD) vehicles (Haynes et al., Citation2017). Since 2000, fatalities associated with 4WD vehicles have increased by five times the number experienced in the previous decade, with flood deaths equally distributed between 4WD vehicles and sedans (Haynes et al., Citation2017). This may reflect the increasing popularity of 4WD and sport-utility vehicles (SUV) (Australian Bureau of Statistics, Citation2015); that drivers of 4WD vehicles are more likely to enter floodwater (Gissing, Haynes, Coates, & Keys, Citation2016) and the increased availability of information from coronial inquest reports over this time period (Haynes et al., Citation2017).
The Australian experience broadly mimics that of other developed countries. In the United States, for example, Ashley and Ashley (Citation2008) found 63% of flood fatalities to be vehicle related while Špitalar et al. (Citation2014) found that 68% of flash flood fatalities were vehicle related and Terti, Ruin, Anquetin, and Gourley (Citation2016) 68%. In a study of flood fatalities across Europe and the United States, Jonkman and Vrijling (Citation2008) found that 32% were associated with vehicles, while in Greece, Diakakis and Deligiannakis (Citation2015) found some 40% of flood fatalities have been associated with vehicles and that this proportion was growing over time. In other countries, the proportions have been lower although still significant with France at 30% (Vinet, Boissier, & Saint-Martin, Citation2016) and Portugal, 14% (Pereira, Diakakis, Deligiannakis, & Zêzere, Citation2017). The larger proportion of fatalities in the United States may be related to its poor road safety record in comparison with other OECD countries (Bureau of Infrastructure, Transport and Regional Economics, Citation2018).
Other studies have examined the different ‘modes of failure’ that lead to car occupants putting themselves at risk. Motorists may deliberately or unwittingly enter floodwaters or find themselves in circumstances where floodwaters rise around their vehicle (Diakakis & Deligiannakis, Citation2015), whereupon floodwaters may submerge the vehicle or sweep it away. In testing the impact of various flood conditions on vehicles, Smith, Modra, and Felder (Citation2019) found in fast flowing floodwaters it could take a water depth of just 15 cm to render a small passenger vehicle unstable and only 30 cm for a 4WD vehicle.
Once vehicles enter water they undergo a three phase process of floating, sinking and submersion (Molenaar, Giesbrecht, & McDonald, Citation2014). The floating phase may only last from 30 to 120 s, and then the vehicle will sink within another 2–4 min (McDonald & Giesbrecht, Citation2013; Molenaar et al., Citation2014). Vehicles may enter floodwaters upright or roll into the stream (Smith et al., Citation2019). Occupants may experience difficulty in escaping their vehicles due to flood conditions, physical trauma, failure of electric windows, automatic locking doors or the activation of airbags (Molenaar et al., Citation2014). Vehicles entering deeper water have been associated with lower survival rates (McDonald & Giesbrecht, Citation2013).
Explanations offered for why motorists deliberately choose to enter floodwater are myriad and inter alia include: drivers not taking warnings seriously (Drobot, Benight, & Gruntfest, Citation2007), underestimating the risk (Diakakis & Deligiannakis, Citation2013; Drobot et al., Citation2007; Maples & Tiefenbacher, Citation2009) and being impatient and thinking that they are invincible (Franklin, King, Aitken, & Leggat, Citation2014). Drivers may develop a false sense of security whilst inside a vehicle (Diakakis & Deligiannakis, Citation2013; Jonkman & Kelman, Citation2005; Maples & Tiefenbacher, Citation2009) and it is possible that they do not fully appreciate the influence that water depth and velocity may have on vehicle stability and thus their safety (Diakakis & Deligiannakis, Citation2013; Yale, Cole, Garrison, Runyan, & Ruback, Citation2003).
It has also been suggested that motorists may recognise the risk but fail to personalise it in the sense of believing that it does not apply to them (Pearson & Hamilton, Citation2014). Hamilton, Peden, Keech, and Hagger (Citation2016) identify a number of factors that may influence driver decision making including past experience; pressures to get to a destination; perception that a situation is different from that described in the warnings; fear of isolation; pressure from other drivers; encouragement by passengers; security of others in the car if rescue was needed; and overestimating their knowledge and skills and vehicle performance.
Australian approaches to reducing vehicle-related flood fatalities have to date focused on education campaigns such as the Queensland Government's ‘If it is flooded, forget it’ campaign and more recently the Victorian Government's ‘15 to float’ campaign. In the United States, authorities have conducted a campaign called ‘Turn around don't drown’. The effectiveness of these campaigns is unknown. Peden et al. (Citation2004) concluded that road safety campaigns could influence behaviour when used in conjunction with legislation and law enforcement, but, in isolation, they do not generally deliver tangible and sustained reductions in deaths or serious injuries.
Risk is defined as a function of hazard, vulnerability and exposure (Cardona et al., Citation2012; McAneney, McAneney, Musulin, Walker, & Crompton, Citation2016). The risk to motorists in respect to floodwaters depends not only on driver decisions and flood hazard but also upon the characteristics of the location (vulnerability) and it is the later which is the primary subject of this study. While some Australian research has focused on the demographics and activity of the deceased (Haynes et al., Citation2009; Fitzgerald et al., Citation2010; Coates, Citation1999; Haynes et al., Citation2017) and reasoning (Hamilton et al., Citation2016; Hamilton, Price, Keech, Peden, & Hagger, Citation2018), the characteristics of roadways where fatalities have occurred have been largely ignored. Austroads (Citation2015), a peak body for road management in Australia, has stated that the vast majority of the approximate 20,000 floodways in Australia and New Zealand have not been constructed in accordance with required design and hydraulic standards, lack appropriate signage and that depth gauges where present were liable to misinterpretation by motorists. In the first study of its kind, the characteristics of roads relevant to Australian vehicle-related flood fatalities are examined, and policy implications discussed.
Methodology
Data entries relating to flood fatalities in Risk Frontiers’ proprietary natural peril database, PerilAUS, were combined with recent media articles to identify the locations where vehicle-related flood fatalities had occurred. PerilAUS contains information on natural peril events that have caused either loss of life or material damage to property and is considered complete since 1900 (e.g. Coates et al. Citation2014; Crompton et al. Citation2010).
A selection of 21 sites across the Australian state jurisdictions of New South Wales (NSW), Queensland (QLD), Western Australia (WA), Victoria (VIC) and the Australian Capital Territory (ACT) were identified as suitable for analysis based upon the quality of information available and ease of access to the site by the authors. These sites accounted for 28 deaths, representing approximately 50% of total vehicle-related flood fatalities between 2010 and March 2017. provides a list of the sites inspected including location and year of the incident. The geographical location of sites is shown in . Specific details regarding the number of fatalities and associated circumstances were obtained from media articles, emergency service press releases and publicly available coronial records.
Figure 1. Geographical distribution of study sites.
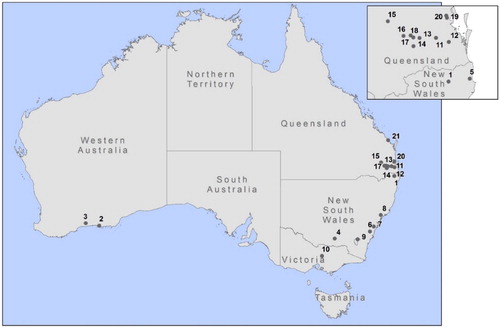
Table 1. Sites visited for this study.
For each site, observational assessments were made in regard to the road characteristics present. Descriptions for each of these elements are provided in .
Table 2. Elements assessed.
Onsite assessments were conducted on 18 of the 21 sites with the others (Lismore/Kyogle, Mullumbimby and Bundaberg) analysed using Google street view and media imagery. Stream lengths were calculated through interpretation of aerial imagery contained within Google Earth.
To further ensure that the data collected through site visits reflected the condition of the roadway at the time of the incidents, Google Earth and media imagery were cross referenced and local emergency service personnel and road operators consulted. Where other information relating to whether a vehicle had been washed from the road and whether emergency services and passers-by were in close proximity to assist was available in media reports or publicly available coronial records, it has been included as part of the analysis. We were unable to assess flow velocity and distance of flooding over the roadway at the time of fatal incidents due to the absence of data.
Results
Overall results are presented in . The 21 sites assessed comprised a mixture of different roadway structures, with the most frequent being floodways (n = 10) and bridges (n = 7). In 86% of cases, roads were sealed (n = 18) and 14% were gravel (n = 3) (Gravel roads generally have a lower coefficient of friction and a lower threshold for sliding than sealed roads (Smith et al., Citation2019; Wong, Citation1993).) Fifteen sites (73%) were located in rural environments, with only one site classified as urban. The remainder were classified as peri-urban.
Table 3. Site inspection results.
Road speed limits varied from 50 to 110 km/h, with 60 km/h most common. No data was available regarding the likely speed that the vehicles may have been travelling when upon entering floodwaters.
Some 57% of sites (n = 12) were located in upper catchment areas with upstream channel lengths less than 20 km. 95% of sites (n = 20) had upstream channel lengths less than 50 km. Such characteristics would have likely led to rapid rates of rise and fast flowing floodwaters. In at least three cases, it was reported that water either rose rapidly around the vehicle or that the vehicle was struck by a wave of water washing it downstream. During flooding in Toowoomba, Queensland, in 2011, a driver stopped her vehicle in very shallow water, waiting to see if it was safe to proceed. Floodwaters then rose rapidly around the vehicle eventually sweeping it and its occupants downstream (Office of the State Coroner, Citation2012). Rapid rates of water rise also mean that if a vehicle was swept downstream into a survivable location, rising floodwaters could quickly inundate or sweep the vehicle further downstream. This was the case in 2016 in Canberra, ACT, where a vehicle was first swept onto a small gravel island within the stream bed only for floodwaters to rise further and sweep the vehicle further downstream.
To limit any bias introduced in the selection of sites a qualitative assessment of catchment size for the remaining sites (not visited) where fatalities occurred between 2010 and March 2017 was performed utilizing Google Maps. 78% of these were also located in the upper reaches of catchments.
At 14 of the sites (66%), the roads were local and would normally accommodate low traffic flows. Only four (19%) of the sites were identified as major roads that would usually accommodate a high traffic flow. It is possible that during episodes of flooding traffic flow may deviate from normal conditions in particular if a road was a nominated evacuation route, or if a major traffic route were closed. In such cases, the number of vehicles travelling along the road may increase the number of motorists exposed. It could also reduce the ability of motorists to turn around or to reverse if floodwaters were observed ahead on a roadway or if flash flooding were to strike a road experiencing traffic gridlock. This was the case in a fatal incident in 2011 on the Warrego Highway, Queensland, where a motorist attempted to reverse but was unable to due to traffic behind the vehicle (Office of the State Coroner, Citation2012).
At 90% of the sites (n = 19), motorists were washed from the road pavement. It is likely the remainder of victims accidently drove off the road and into floodwaters. At Bowral in 2016, a victim may have accidently reversed into the floodwater. At two sites, two fatal incidents in separate vehicles occurred during the same flood. In 35% (n = 4) of cases, multiple persons were inside the vehicle and at least one person survived. For example, at Junction View near Toowoomba, Queensland in 2010, a family of four was in a vehicle struck by floodwater as it crossed a creek bed. Three of the four occupants survived (Calligeros, Citation2010).
None of the sites assessed had side barriers at the point that vehicles were most likely to have entered floodwaters. In some cases, some form of barrier may have been present, but did not provide coverage along the road edge adjacent to the floodplain. An example of this is bridges where barriers are common on the decking over the main waterway but not at the approaches. Curb and guttering were largely absent, only being observed at five sites.
It is difficult to assess flood conditions present at the site when the victim's vehicle was washed away and there are no precise measurements of depths directly adjacent to the roadway. Assuming floodwaters covered the road pavement at the time of the incident it is likely that in 16 cases motorists entered deep water greater than one metre directly adjacent to the edge of the roadway. Average depths immediately downstream were likely to have been some 2 m in these cases.
At 17 of the sites, downstream vegetation or obstacles (e.g. rocks and fences) were present within the channel or on the adjacent floodplain.
At 12 of the sites signage was likely present at the time of the incident. However, it is difficult to be absolutely confident of this since changes may have occurred to signage since the incident. Depth markers were the most common form of signage and present (at the time of inspection at least) at 50% of sites, followed by ‘road subject to flooding’ signs (29%) and ‘floodway’ or ‘causeway’ signs (11%).
Seven incidents occurred during evening hours, with street lighting only present at two of these sites. No specific dynamic roadside flood warning systems were present at any of the sites. Dipping road grades were identified at 11 sites (52%). At five sites (25%), the alignment of the road may have meant that the driver was unable to adequately see the floodwater as they approached. In several of these cases tight bends were located directly before floodways.
At 14 sites (70%), a driver of a sedan would not have been easily able to turn around upon becoming aware of floodwaters on the road. Drivers of larger vehicles would have encountered greater difficulty. Factors constraining the ability to turn around include traffic flow, vehicle size, narrow road width and soggy or steep road edges.
At eight sites (38%), emergency services or passers-by were on site within seconds to several minutes to either call for further assistance or attempt rescue. This shows how quickly flood fatalities can occur and that it is not always possible to rescue people once a vehicle has entered floodwater even when other people and/or emergency services are present. Given that 15 sites (73%) were in rural locations (some with limited or no cell phone reception), it would be difficult for emergency services to attend the scene within minutes of a vehicle being washed away.
Discussion
Reducing vehicle-related flood deaths poses a significant policy challenge for road safety experts, emergency managers and floodplain management professionals. In what is believed to be the first study of its kind, road characteristics that have influenced vehicle-related flood fatalities have been examined. While some roadways are clearly more dangerous than others, differing risk profiles are largely ignored in emergency planning or existing floodplain risk management approaches which tend to be heavily focused on urban flood risk. The large number of flood-prone road sections means that it will be necessary to prioritise those locations that most require safety improvements. This should be done on a risk-informed basis. Ultimately policy that gives consideration to road characteristics in flood-prone areas in addition to other interventions such as education, law enforcement and emergency response has the potential to reduce vehicle-related flood fatalities.
Road flood risk factors can be categorised into those that influence a motorist's decision to enter floodwaters; factors that influence whether a vehicle might be washed or driven from the road, and those that influence survivability of occupants once a vehicle is in floodwaters. These factors are listed and described in .
Table 4 . Road flood risk factors.
Of the factors that were considered but not listed in , downstream vegetation or obstacles cannot be considered definitive risk factors as they may have both positive and negative impacts. On the one hand, obstacles may provide points for a vehicle to temporally rest providing time for rescue or occupants to escape and after escaping vegetation might provide something to hold onto. However, vegetation or other obstacles may also halt the passage of a vehicle drifting downstream causing it to rapidly submerge. This was the case in Seymour, Victoria, in 2016, where a small van was swept downstream into the main channel of a creek. A large tree in the middle of the channel blocked the vehicle's passage, whereupon floodwaters rapidly submerged the van.
Of the measures assessed small upstream stream length (rate of rise); the absence of roadside barricades; depth of flooding immediately adjacent to the roadway; absence of lighting; dipping road grade; lack of curb and guttering; and the inability of motorists to easily turn around were the factors most commonly present at fatality sites involving vehicles. Each of these factors were observed in at least 50% of cases studied and provide a basis for assessing other sites vulnerable to flooding but where fatalities have not been observed to date. The probability of a roadway being flooded, and exceeding vehicle stability criteria (see Martínez-Gomariz, Gómez, Russo, & Djordjević, Citation2018; Shah, Mustaffa, Martinez-Gomariz, Kim, & Yusof, Citation2019; Smith et al., Citation2019; Xia, Falconer, Lin, & Tan, Citation2011) must also be considered a precursor condition.
Policy implications
At present, there is no standard practice for the risk assessment of flood-prone road sections. Given the large number of road sections that may not be constructed to safe design and hydraulic standards it is important that road operators assess and prioritize potentially vulnerable locations based on their relative risk profile. Typically road safety agencies assess risk through historical data including crash numbers, hospital and insurance data (Austroads, Citation2006). Emergency services could also assist road operators in their task of proactively identifying high-risk road sections by providing data about the location of flood rescues. However, the frequency of flood rescues at specific sites also requires information about the severity of the incident. Currently in Australia, this information is not routinely collected and there is no standard system to categorise flood rescue severity post-incident. One simple system would be to record if a vehicle had been swept from a roadway or not.
Historical data though can be subject to bias given the differing frequency of floods across a region. Hence, the need for a proactive approach based upon road characteristics outlined here to understand vulnerability combined with flood hazard information including flood extents, depths and velocities for different flood frequencies, and vehicle safety criteria.
This study supports conclusions made by Austroads (Citation2015) and Gissing et al. (Citation2016) in relation to the limitations of roadside signage in preventing motorists from entering floodwater. Although in some cases, signs may have been absent or obscured, in the main our observations suggest that motorists either chose to ignore, misinterpret or simply do not see the signage. Current signage policy needs to be reviewed so that it can be more readily seen and interpreted as part of a wider approach to flood adaptation. Improved signage could assist to decrease vulnerability and ultimately reduce risk along flood-prone road sections. The introduction of more dynamic signage may assist in improving compliance, and in recent years such systems have been installed in areas of South East Queensland. Higgins, Balke, and Chrysler (Citation2012) concluded that drivers placed more trust in dynamic signage and emphasized the need to provide visual cues to inform driver decision making. Similar research in the context of railway crossings has shown higher rates of compliance with dynamic signage when compared to passive signage (Tey, Ferreira, & Wallace, Citation2011). Existing signage is also one dimensional and ignores the critical role of water velocity (Austroads, Citation2015) and dangers that may exist below floodwaters. Again, consideration should be given to signage that holistically communicates flood hazard rather than flood depth only.
The absence of roadside barriers and lighting at fatality sites presents a need to further investigate their efficacy to reduce the likelihood of a vehicle being driven or washed from a flooded road. Our study suggests that consideration should be given to their installation at high-risk sites.
Conclusion
Our study clearly shows that road characteristics have a significant potential to influence vehicle-related flood deaths. The assessment of risks associated with roadways should be an important consideration for floodplain risk management as well as for the prioritization of emergency management activities during floods and future investments in flood-fatality prevention. Our research provides the basis for a risk-based assessment procedure. The results can also be utilised to improve the future design of roads in flood-prone areas. Further research to build upon the evidence base presented here could include an analysis of road characteristics where near misses have occurred and where flood rescues have been successfully performed. Road side barriers, improved signage and lighting options should also be evaluated for their capacity to reduce risks by lessening vulnerability. In some instances, it may be necessary to adopt new road designs.
Acknowledgements
The authors wish to thank Katharine Haynes for comments on an earlier version of this research, and Jonathan Van Leeuwen for assistance with imagery interpretation. Completion of this research was funded through the Australian Bushfire and Natural Hazards Cooperative Research Centre. The support of the Commonwealth of Australia through the Cooperative Research Centre program is acknowledged.
Disclosure statement
No potential conflict of interest was reported by the authors.
Additional information
Funding
References
- Ashley, S. T., & Ashley, W. S. (2008). Flood fatalities in the United States. Journal of Applied Meteorology and Climatology, 47(3), 805–818. doi: 10.1175/2007JAMC1611.1
- Australian Bureau of Statistics (2015). 9314.0 – Sales of New Motor Vehicles, Australia, December 2015. Retrieved from http://www.abs.gov.au/AUSSTATS/[email protected]/allprimarymainfeatures/232B9C938D66D507CA257F5700228276?opendocument
- Austroads. (2006). Guide to road safety: Part 7 road Network crash risk assessment and management. Sydney, Australia: Austroads Incorporated.
- Austroads. (2015). Safety provisions for floodways over roads.
- Bureau of Infrastructure, Transport and Regional Economics (2018) International road safety comparisons 2016. Retrieved from https://bitre.gov.au/publications/ongoing/files/International_2016_III.pdf
- Calligeros, M. (2010). Flood Victim, 14, ‘had fighting spirit’. Brisbane Times. Retrieved from http://www.brisbanetimes.com.au/queensland/flood-victim-14-had-fighting-spirit-20100207-nkkr.html
- Cardona, O. D., van Aalst, M. K., Birkmann, J., Fordham, M., McGregor, G., & Mechler, R. (2012). Determinants of risk: Exposure and vulnerability. In C. B. Field, V. Barros, & T. F. Stocker (Eds.), Managing the risks of extreme events and disasters to advance climate change adaptation. Cambridge: Cambridge University Press.
- Coates, L. (1999). Flood fatalities in Australia, 1788-1996. Australian Geographer, 30(3), 391–408. doi: 10.1080/00049189993657
- Coates, L., Haynes, K., O’Brien, J., McAneney, J., & De Oliveira, F. D. (2014). Exploring 167 years of vulnerability: an examination of extreme heat events in Australia 1844–2010. Environmental Science & Policy, 42, 33–44. doi: 10.1016/j.envsci.2014.05.003
- Crompton, R. P., McAneney, K. J., Chen, K., Pielke, R., & Haynes, K. (2010). Influence of location, population, and climate on building damage and fatalities due to Australian bushfire: 1925–2009. Weather, Climate, and Society, 2(4), 300–310. doi: 10.1175/2010WCAS1063.1
- Diakakis, M., & Deligiannakis, G. (2013). Vehicle-related flood fatalities in Greece. Environmental Hazards, 12(3–4), 278–290. doi: 10.1080/17477891.2013.832651
- Diakakis, M., & Deligiannakis, G. (2015). Flood fatalities in Greece: 1970–2010. Journal of Flood Risk Management, doi: 10.1111/jfr3.12166
- Drobot, S. D., Benight, C., & Gruntfest, E. (2007). Risk factors for driving into flooded roads. Environmental Hazards, 7(3), 227–234. doi: 10.1016/j.envhaz.2007.07.003
- Fitzgerald, G., Du, W., Jamal, A., Clark, M., & Hou, X. Y. (2010). Flood fatalities in contemporary Australia (1997–2008): Disaster medicine. EMA – Emergency Medicine Australasia, 22(2), 180–186. doi: 10.1111/j.1742-6723.2010.01284.x
- Franklin, R. C., King, J. C., Aitken, P. J., & Leggat, P. A. (2014). ‘Washed away’—assessing community perceptions of flooding and prevention strategies: A North Queensland example. Natural Hazards, 73(3), 1977–1998. doi: 10.1007/s11069-014-1180-x
- Gissing, A., Haynes, K., Coates, L., & Keys, C. (2016). Motorist behaviour during the 2015 Shoalhaven floods. Australian Journal of Emergency Management, 31(2), 23–27.
- Hamilton, K., Peden, A., Keech, J., & Hagger, M. (2016). Deciding to drive through floodwater: A qualitative analysis through the lived experience. Sydney: Royal Life Saving.
- Hamilton, K., Price, S., Keech, J., Peden, A., & Hagger, M. (2018). Driving through floodwater: Exploring driver decisions through lived experience. International Journal of Disaster Risk Reduction, doi: 10.1016/j.ijdrr.2018.12.019
- Haynes, K., Coates, L., Leigh, R., Handmer, J., Whittaker, J., Gissing, A., … Opper, S. (2009). ‘Shelter-in-place’ vs. Evacuation in flash floods. Environmental Hazards, 8, 291–303. doi: 10.3763/ehaz.2009.0022
- Haynes, K., Coates, L., van den Honert, R., Gissing, A., Bird, D., Dimer de Oliveira, F., … Smith, C. (2017). Exploring the circumstances surrounding flood fatalities in Australia – 1900–2015 and the implications for policy and practice. Environmental Science and Policy, 76, 165–176. doi: 10.1016/j.envsci.2017.07.003
- Higgins, L., Balke, K., & Chrysler, S. (2012). Driver responses to signing treatments for flooded roads. Transportation Research Record: Journal of the Transportation Research Board, 2321, 98–107. doi: 10.3141/2321-13
- Jonkman, S., & Kelman, I. (2005). An analysis of the causes and circumstances of flood disaster deaths. Disasters, 29(1), 75–97. doi: 10.1111/j.0361-3666.2005.00275.x
- Jonkman, S., & Vrijling, J. (2008). Loss of life due to floods. Journal of Flood Risk Management, 1(1), 43–56. doi: 10.1111/j.1753-318X.2008.00006.x
- Maples, L. Z., & Tiefenbacher, J. P. (2009). Landscape, development, technology and drivers: The geography of drownings associated with automobiles in Texas floods, 1950–2004. Applied Geography, 29(2), 224–234. doi: 10.1016/j.apgeog.2008.09.004
- Martínez-Gomariz, E., Gómez, M., Russo, B., & Djordjević, S. (2018). Stability criteria for flooded vehicles: A state-of-the-art review. Journal of Flood Risk Management, 11, S817–S826. doi: 10.1111/jfr3.12262
- McAneney, J., McAneney, D., Musulin, R., Walker, G., & Crompton, R. (2016). Government-sponsored natural disaster insurance pools: A view from down-under. International Journal of Disaster Risk Reduction, 15, 1–9. doi: 10.1016/j.ijdrr.2015.11.004
- McDonald, G. K., & Giesbrecht, G. G. (2013). Vehicle submersion: A review of the problem, associated risks, and survival information. Aviation, Space, and Environmental Medicine, 84(5), 498–510. doi: 10.3357/ASEM.3151.2013
- Molenaar, J., Giesbrecht, G., & McDonald, G. (2014). Rescue Techniques in submerged vehicles Drowning. Berlin: Springer.
- Office of the State Coroner. (2012). Inquest into the deaths caused by the south-east Queensland floods of January 2011. Brisbane. Retrieved from http://www.courts.qld.gov.au/__data/assets/pdf_file/0019/152362/cif-seq-floods-20120605.pdf
- Pearson, M., & Hamilton, K. (2014). Investigating driver willingness to drive through flooded waterways. Accident Analysis & Prevention, 72, 382–390. doi: 10.1016/j.aap.2014.07.018
- Peden, A., Franklin, R., Leggat, P., & Aitken, P. (2017). Causal pathways of flood related river drowning deaths in Australia. PLOS Currents Disasters, 1, 1–24.
- Peden, M., Scurfield, R., Sleet, D., Mohan, D., Hyder, A. A., Jarawan, E., & Mathers, C. (2004). World Report on road traffic Injury prevention. Geneva: World Health Organisation.
- Pereira, S., Diakakis, M., Deligiannakis, G., & Zêzere, J. (2017). Flood Mortality in Portugal and Greece (Western and Eastern Mediterranean). International Journal of Disaster Risk Reduction, 22, 147–157. doi: 10.1016/j.ijdrr.2017.03.007
- Shah, S. M. H., Mustaffa, Z., Martinez-Gomariz, E., Kim, D. K., & Yusof, K. (2019). Criterion of vehicle Instability in floodwaters: Past, present and future. International Journal of River Basin Management, 1–41. doi: 10.1080/15715124.2019.1566240
- Smith, G. P., Modra, T. A., & Felder, S. (2019). Full-scale testing of stability curves for vehicles in flood waters. Journal of Flood Risk Management, doi: 10.1111/jfr3.12527
- Špitalar, M., Gourley, J. J., Lutoff, C., Kirstetter, P.-E., Brilly, M., & Carr, N. (2014). Analysis of flash flood parameters and human impacts in the US from 2006 to 2012. Journal of Hydrology, 519, 863–870. doi: 10.1016/j.jhydrol.2014.07.004
- Terti, G., Ruin, I., Anquetin, S., & Gourley, J. J. (2016). A situation-based analysis of flash flood fatalities in the United States. Bulletin of the American Meteorological Society, 98(2), 333–345. doi: 10.1175/BAMS-D-15-00276.1
- Tey, L.-S., Ferreira, L., & Wallace, A. (2011). Measuring driver responses at railway level crossings. Accident Analysis & Prevention, 43(6), 2134–2141. doi: 10.1016/j.aap.2011.06.003
- Vinet, F., Boissier, L., & Saint-Martin, C. (2016). Flashflood-related mortality in southern France: first results from a new database. E3S Web of Conferences.
- Wong, J. Y. (1993). Theory of ground vehicles (2nd ed.). New York: John Wiley & Sons.
- Xia, J., Falconer, R. A., Lin, B., & Tan, G. (2011). Numerical assessment of flood hazard risk to people and vehicles in flash floods. Environmental Modelling & Software, 26(8), 987–998. doi: 10.1016/j.envsoft.2011.02.017
- Yale, J. D., Cole, T. B., Garrison, H. G., Runyan, C. W., & Ruback, J. K. R. (2003). Motor vehicle—related drowning deaths associated with inland flooding after Hurricane Floyd: A field investigation. Traffic Injury Prevention, 4(4), 279–284. doi: 10.1080/714040485