
 ?Mathematical formulae have been encoded as MathML and are displayed in this HTML version using MathJax in order to improve their display. Uncheck the box to turn MathJax off. This feature requires Javascript. Click on a formula to zoom.
ABSTRACT
We examine the impact of the earthquake sequence in 2010–2012 on labour productivity in New Zealand's Canterbury region, utilising a dynamic Difference-in-Differences approach and a comprehensive administrative dataset of all firms operating in New Zealand. We find a statistically significant and large positive effect on labour productivity in Christchurch City, particularly in the construction sector. This led to an observable increase in overall regional labour productivity in the Canterbury region in 2013, 2015, and 2016. In Christchurch City itself (the area most heavily impacted by the earthquakes), the positive effect lasts until 2018 and possibly later (though it is no longer statistically observable). The re-construction of the region will not continue forever, so the implications of this winding down in re-construction for labour productivity and income are potentially a matter of present and future concern.
1. Introduction
Labour productivity measures the efficiency of the workforce in producing goods and services. Typically represented as the ratio of output (production) to input (labour employed), it quantifies the volume of goods or services produced per unit of labour input. Labour productivity growth is widely seen as essential for sustained economic development and increased living standards. Higher labour productivity enables businesses to produce more with the same labour resources, leading to cost-efficiency and improved competitiveness. This increased competitiveness attracts investment, creates job opportunities, and raises overall living standards.
Aotearoa New Zealand (henceforth NZ) is situated at the edge of both the Australian and Pacific tectonic plates. To the northeast of New Zealand, and underneath North Island, the Pacific Plate is moving towards, and being subducted below, the Australian Plate. To the south of New Zealand, the two plates are also moving towards each other but here the Australian Plate is being subducted under the Pacific Plate. Consequently, New Zealand experiences approximately 20,000 earthquakes each year, with around 30 reaching a magnitude of 5 or higher. Moreover, this frequent seismic activity leads to landslides, rockfalls, tsunamis (particularly after shallow quakes), and liquefaction – a key hazard impacting land, structures, and infrastructure. Earthquake events caused an average annual loss around NZD 522 million from 1968 to 2019 (GeoNet statistics, Citationn.d.; McAneney et al., Citation2022).
On September 4, 2010, a quake of a magnitude of 7.1 hit the Canterbury region and set in motion a chain of aftershocks. This first earthquake damaged many buildings but caused no immediate loss of life. However, an aftershock on February 22, 2011, one that struck much closer to the centre of the city of Christchurch, was significantly more destructive. This second event resulted in 185 deaths and extensive damage to over 100,000 structures. In the following 10 months, Christchurch and its surrounding towns experienced two additional damaging earthquakes along with over 11,200 aftershocks. This series of seismic events is collectively referred to as the Canterbury Earthquake Sequence, with its main event occurring on 22/02/2011.
From 1968 to 2019, earthquakes have been responsible for 79% of the normalised privately – insured losses from natural hazard disasters that are listed by the Insurance Council of New Zealand, with the Canterbury Earthquake Sequence costing NZD 20.1 billion to private insurers (normalised to 2018 monetary values), by far the costliest event in this dataset (ICNZ, Citation2024; McAneney et al., Citation2022). For more detail about the extensive property damage from the earthquake, see Potter et al. (Citation2015), Poontirakul et al. (Citation2017), and Nguyen and Noy (Citation2020).
Few studies have previously examined the impact of disasters on productivity. One of these (Leiter et al., Citation2009) examined the impact of floods on firms’ productivity (value added) in France, Italy, Spain, and the United Kingdom. Their study found that, in the short term, companies in flood-affected areas had lower firm-level productivity. However, these companies showed higher growth in assets and increased workforce numbers compared to companies in regions that were not affected by floods. Similarly, Dieppe (Citation2021) explored the impact of various disasters, including earthquakes, tsunamis, volcanic activity, extreme heat and cold, and droughts, on labour productivity (output per labour) in both advanced economies and Emerging Markets and Developing Economies. Their findings indicated a significant negative impact of disasters on labour productivity.
Disasters can impact labour productivity through various channels. Firstly, they can harm health, resulting in physical injuries, long-term disabilities, and psychological damage, leading to heightened stress and difficulties in focus. Good health correlates with higher productivity and commitment to work (CERA, Citation2013; Goldmann & Galea, Citation2014; Sharpe & Mobasher Fard, Citation2022).
Secondly, disasters can influence technological innovation. According to Chen et al. (Citation2021) disasters (measured by their occurrence and consequence) have a significant impact on technological innovation (as proxied by patents). Indeed, in some cases disasters were also found to increase innovation (patents), but these were typically specific to the disaster risk itself (e.g. heatwaves and air-conditioning – see Noy & Strobl, Citation2022, Citation2023). More broadly, increasing innovation is typically associated with a significantly positive impact on labour productivity (Passarelli et al., Citation2023; Samargandi, Citation2018).
Thirdly, changes in foreign direct investment (FDI) flows post-disaster impact labour productivity. According to Neise et al. (Citation2022), disasters have adverse effects on foreign direct investment (FDI) in the short term (but the flow of foreign direct investment increases later, 3–5 years after the event). Saha (Citation2023) identified a positive impact of FDI on labour productivity in countries above the Productive Capacity Index (PCI) threshold, where PCI represents the marginal effect of FDI on labour productivity. In contrast, countries below the PCI threshold, experienced a negative effect of FDI.
Lastly, disasters could affect labour productivity by decreasing the available capital, as disasters may wreak havoc on vital capital assets that are used as production inputs, and cause damage to essential infrastructure. According to Zhang and Ruan (Citation2020), regions with a high frequency of natural disasters experience a reduction in the expected rate of return from physical capital. As a result, individuals exposed to such disasters may tend to prioritise investments in human capital over physical capital, another channel of impact with adverse consequences for long-term productivity.
Here, we investigate the impact of the very destructive Canterbury earthquake sequence on labour productivity at the individual firm level in the decade following the earthquakes. To do this, we use the comprehensive administrative tax records of all firms in NZ, while differentiating among firms’ main activity sectors, including agriculture, forestry and fishing, construction, manufacturing, and retail trade. Our study, using annual data from 2000 to 2020, examines the Canterbury region as the ‘treated’ group, and uses the Waikato region as the ‘control’ group. We employ a dynamic Difference-in-Differences (DiD) modelling approach to assess the impact of the earthquakes on labour productivity in the Canterbury region.
Our contribution represents the first attempt, to our knowledge, of assessing the long-term impact of earthquakes on labour productivity across various economic sectors. Using a unique administrative dataset from StatsNZ and employing a Dynamic DiD approach, we provided a deeper understanding of how earthquakes affect labour productivity dynamically. The rest of the paper is organised as follows: Section 2 discusses the DiD model and its assumptions. Sections 3 and 4 present the data and descriptive statistics. Section 5 describes the results, and the final section provides some concluding observations.
2. Methodology
The Difference-in-Differences (DiD) approach is a widely employed quasi-experimental methodology used to estimate causal effects by comparing differences in the change of an outcome variable between treatment and control groups over time. DiD allows researchers to evaluate the impact of policy interventions, programme implementations, or other treatments when experiments (i.e. randomised controlled trials) are not feasible. The DiD approach has been used in investigating the effects of disasters on different economic indicators (e.g. Leiter et al., Citation2009; Mendoza et al., Citation2020; Ta, Citation2022; Tanaka, Citation2015).
Our econometric specifications employ a dynamic Difference-in-Differences (DiD) approach to investigate the effect of the Canterbury earthquakes on labour productivity in the Canterbury region, in Christchurch City, and separately in the rest of the Canterbury region (excluding Christchurch City). We estimate the following equation:
(1)
(1) In Equation (1), LP represents labour productivity, calculated by dividing the real value-added for each firm by the number of employees within that firm (as defined by OECD, Citation2016). Here, i and t correspond to firm and time, respectively. Treatment is a dummy variable equal to 1 if a firm is located in the defined treated (earthquake-affected) region or 0 if a firm is located in the control region unaffected by the earthquakes (Waikato). The subscript R is employed to represent the three treatment groups: the entire Canterbury region, Christchurch city, and the areas of Canterbury excluding Christchurch city.
is a vector of coefficients representing the average difference in labour productivity between the treatment and control regions for each year throughout the study period (2000–2020). The terms
,
signify time-fixed effects and firm-fixed effects, respectively.
There is no specific test to assess the parallel trend assumption, so we adopted a comprehensive approach. Firstly, we plotted the average labour productivity for both control and treatment groups, comparing their trends before the earthquakes (from 2000 to 2009). This visual analysis offered an initial insight into the trends in the pre-earthquake period. Following this, we utilise t-test to explore the significant difference between the slope of the average of the labour productivity in Waikato with the same slope for Canterbury region, Christchurch city, and the Canterbury region excluding Christchurch city for each year prior to the earthquakes (2000–2009), as shown in .
Furthermore, a prerequisite for applying the DiD methodology is the independence between the treatment group (Canterbury) and the control group (Waikato) to prevent the spillover of treatment effects into the control group. The Canterbury region is situated in the mid-section of South Island, while the Waikato is in the mid-section of the North Island of New Zealand, with relatively few economic links between the two regions (the main hubs of inter-regional economic connections are Wellington and Auckland). In addition, the available evidence suggests that the initial impact of the earthquakes did not extend to any observable and statistically significant initial impact to other regions in New Zealand – barring possibly, the neighbouring regions to Canterbury in the South Island (Parker & Steenkamp, Citation2012; Wood et al., Citation2016).
3. Data
The data used in this study is obtained from the Longitudinal Business Database (LBD) collated by Statistics New Zealand from firm surveys and linked (but de-identified) administrative data from government agencies. It includes data on all firms, and provides information on business financials, business practices, employment, and international trade.
In New Zealand, the financial year starts on April 1st. Hence, the two major earthquakes occurred within the same 2010 financial year (April 2010–March 2011). Consequently, all firms established on or after 2010 were excluded from the dataset, along with those that ceased operations before 2010. Additionally, firms with zero employees or lacking workforce information (due to missing values) were removed. We used the Consumer Price Index from the International Monetary Fund (IMF) to convert nominal values into real values, with 2010 as the base year.
We divided the Canterbury region into two distinct areas: Christchurch City and the rest of Canterbury. This division was based on the observation that Christchurch was more significantly affected than the rest of the Canterbury region – especially by the second and most destructive earthquake of February 2011. The Canterbury region comprises 10 territorial authorities: Kaikōura, Hurunui, Selwyn, Waimakariri, Christchurch City, Ashburton, Mackenzie, Timaru, Waimate, and Waitaki. Among these, Christchurch is the region’s urban centre, and is a home to 62% of the region's population, according to the most recent 2018 Census (Stats NZ, Citation2019).
The Waikato region was chosen as the control group due to its similarities with the Canterbury region in terms of economic and sectoral characteristics (Ta, Citation2022). According to StatsNZ (Citation2023), in 2022 the Canterbury region accounted for approximately 12% of New Zealand's GDP, while the Waikato region contributes around 9%. The gross regional product per capita for Canterbury and Waikato regions in 2022 was recorded at $67,400 and $63,713, respectively. In both, the agriculture sector plays a significant role; in 2021, it contributed around 8.1% and 7.0% to the Waikato and Canterbury regions regional production, respectively (StatsNZ, Citation2023). Both regions’ agricultural sectors rely heavily on dairy farming (they are the two largest dairy regions in NZ, and dairy is by far the largest agricultural sector in the country). The area dedicated to farms constitutes 63.9% of the total land area in Waikato and 57.8% in Canterbury, further emphasising the significant role of the agriculture sector in both regions (Stats NZ, Citation2021). The LBD dataset includes information on 23,805 firms in these regions: 12,705 firms were located in Canterbury, while 11,100 firms were in Waikato. Within the Canterbury region, 54% of the firms were in Christchurch, with the remaining 46% distributed across the rest of region.
Throughout the study period, spanning from 2000 to 2020, we categorised firms based on their economic activities; this classification was based on the Australian and New Zealand Standard Industrial Classification 2006 (ANZSIC06). In Canterbury, 13.8% were involved in agricultural, forestry, and fishing activities, while 5.5% were in construction. Manufacturing accounted for 4.9%, and 5.1% were engaged in retail trade. A significant portion, 24.1%, participated in various other activities. Similarly, in Waikato, 19.6% were engaged in agricultural, forestry, and fishing activities, with 4.1% involved in construction. Manufacturing represented 3.3%, and 4% were in retail trade. Additionally, 15.8% of firms were involved in other activities. It is noteworthy that 2,085 firms changed their classification during the study period, with 51 of them undergoing changes three times.
According to the Ministry of Business, Innovation and Employment (MBIE, Citation2017) definitions, micro firms employed fewer than 5 workers, small firms employed 5–20 workers, medium-sized firms had an average workforce ranging from 21 to 49 individuals, and large firms had a staff of more than 49 employees. Therefore, most of the sample consisted of micro firms, accounting for approximately 83.7% of the total. Small firms made up 12.7% of the sample, while medium-sized firms constituted 2.5%, and large firms comprised only 1.1% of the total. The classification of firm sizes was based on the average number of permanent employees during the specified study period.
4. Descriptive statistics
In the period before the earthquakes (2000–2009), annual labour productivity in Canterbury averaged NZD 169.9 thousand per worker. After the earthquakes (2010–2020), there was a notable increase to NZD 192.2 thousand per worker annually. Specifically, Christchurch witnessed a 7.25% rise, while the rest of Canterbury experienced a larger 15% increase. In contrast, labour productivity in the Waikato region decreased slightly from NZD 158.2 thousand per labourer annually before the earthquakes to NZD 157.0 thousand per labour annually afterward.
When evaluating labour productivity across economic activities in Canterbury, a distinct pattern emerges. Pre-earthquakes (2000–2009), the manufacturing sector led in labour productivity, in contrast with the construction sector, which had the lowest productivity. Post-earthquakes (2010–2020), the agriculture, fishing, and forestry sector experienced a remarkable 40% surge in labour productivity. Simultaneously, the construction sector saw a substantial 15% increase, while the manufacturing sector experienced a decline of approximately 14%.
Labour productivity displayed distinct patterns in both Christchurch City and the rest of the Canterbury region after the earthquakes. In Christchurch City, productivity growth was observed solely in the agriculture and construction sectors, while other sectors experienced a decline. In the rest of the Canterbury region, labour productivity increased across all sectors except manufacturing.
provides a summary of the mean, standard deviation, and the number of observations for labour productivity (including value-added and the number of workers) in Canterbury, Waikato, Christchurch City, and the rest of Canterbury (excluding Christchurch City) before and after the earthquakes. provide more detailed information on labour productivity, differentiated by economic activity.
Table 1. Labour productivity by region.
Table 2. Labour productivity by economic activity in the Canterbury region.
Table 3. Labour productivity by economic activity in Christchurch City.
Table 4. Labour productivity by economic activity in the rest of Canterbury (excluding Christchurch City).
Table 5. Labour productivity by economic activity in the Waikato region.
5. Result
The effects of the Global Financial Crisis are clearly evident within the years 2008–2009, as shown in . During this period, the gross domestic product (GDP) in New Zealand declined. As a result of this Crisis, labour productivity also saw a drastic decrease in both the Canterbury and Waikato regions, reaching its lowest level in 2009. Subsequently, labour productivity began to recover, as illustrated in . Our findings’ credibility depends on satisfying the parallel trend criterion. shows a parallel trend in average labour productivity for Canterbury, Christchurch city, and the rest of Canterbury region when compared to Waikato. The t-test comparisons confirm this parallel trend between Canterbury and Christchurch versus Waikato. However, no such trend is observed between the rest of Canterbury and Waikato, specifically in 2000–2001, 2002–2003, and 2007–2008 as shown in .
Figure 1. Percentage change in production -based real gross domestic product (GDP) in New Zealand. Source: Reserve Bank of New Zealand. https://www.rbnz.govt.nz/statistics/series/economic-indicators/gross-domestic-product.
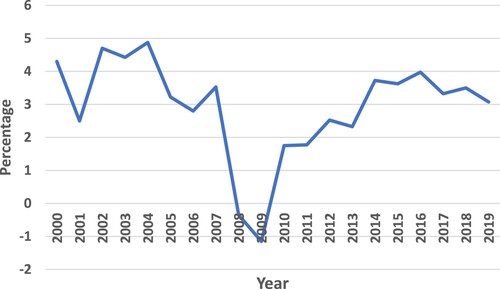
Figure 2. Average labour productivity for Canterbury and Waikato.
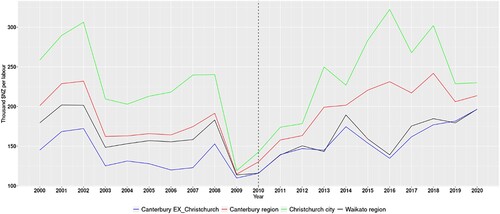
Table 6. t-Test for parallel trend.
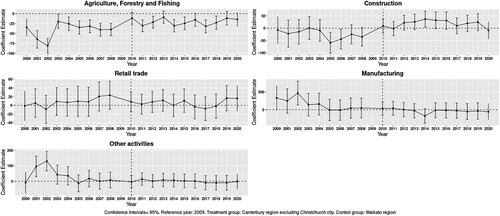
illustrates the estimated coefficients from Equation (1), where the coefficients in this figure representing the average difference in labour productivity between Canterbury, Christchurch city, and the rest of Canterbury versus Waikato for each year throughout the study period. shows the average labour productivity by sector, while the coefficients in represent the average difference in sector-specific labour productivity between the treatment groups (Canterbury or Christchurch) and the control group (Waikato). The bars in the figures represent 95% confidence intervals. Based on , there is a notable increase in average labour productivity in firms located in the Canterbury region during the years 2013, 2015, and 2016 compared to their counterparts in the Waikato. This increase was statistically significant in Christchurch city for the years 2013, 2015, 2016, 2017, and 2018, with a p-value < .05.
Figure 3. Dynamic effect of the Christchurch earthquakes on labour productivity in Canterbury region, Christchurch city, and Canterbury region excluding Christchurch city.
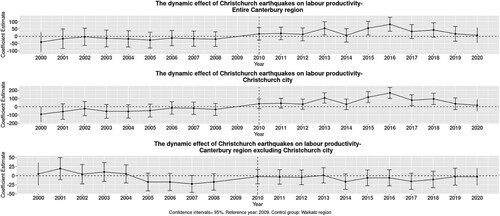
Figure 4. Average labour productivity by economic activity.
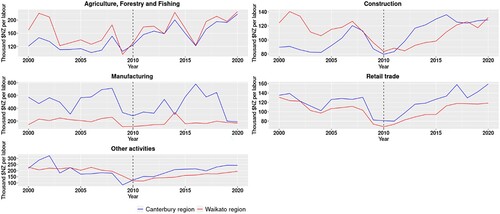
Figure 5. Dynamic effect of the Christchurch earthquakes on labour productivity according to the economic sectors in the Canterbury region.
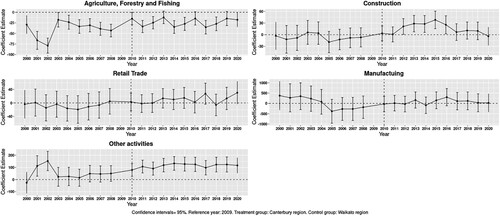
Figure 6. Dynamic effect of the Christchurch earthquakes on labour productivity according to the economic sectors in the Christchurch city.
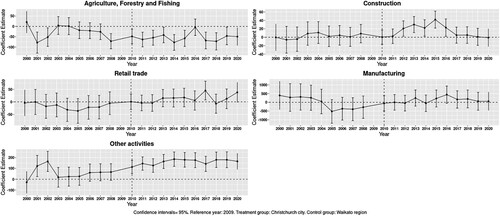
Figure 7. Dynamic effect of the Christchurch earthquakes on labour productivity according to the economic sectors in the Canterbury region excluding Christchurch city.
shows that there is a lack of parallel trends in the average labour productivity between the Canterbury region and the Waikato region in the manufacturing sector and in other activities. However, a parallel trend can be observed in the average labour productivity for construction, retail trade, and agriculture, forestry, and fishing activities.
shows a significant disparity in labour productivity averages in agriculture, forestry, and fishing activities between the Canterbury region and Waikato region before the earthquakes, where the confidence intervals for all estimated coefficients exclude zero for each year preceding 2010. Therefore, we cannot definitively attribute the observed impact post-2010 to the earthquakes. Consequently, we conclude the parallel trend condition is not observable in the agriculture sector, and interpretable results are confined only to retail trade and construction activities, both of which meet the parallel trend condition necessary for the difference-in-differences approach.
According to , a significant increase in the labour productivity in construction activities was observed in the Canterbury region, Christchurch city, and the rest of the Canterbury region compared to their counterparts in the Waikato region in the aftermath. This statistically significant increase was notable from 2012 to 2016 in the entire Canterbury region and in Christchurch city, while the effect was only observed in 2014 for the rest of the Canterbury region.
In retail trade activities, a significant increase in labour productivity was observed in Christchurch city compared to its counterparts in the Waikato region. This increase, as indicated in , was only evident in 2017. It is challenging to attribute this increase directly to the Christchurch earthquakes, as the effect emerged six years after the earthquakes for only one year and subsequently disappeared. Furthermore, there was no significant effect on retail trade activities in the entire Canterbury region and the rest of the Canterbury region.
6. Conclusions and discussion
In this paper, we employed the dynamic Difference-in-Differences (DID) approach to examine the impact of the Christchurch earthquakes on labour productivity in the Canterbury region of New Zealand. Our findings reveal a significant and positive impact of the earthquakes on labour productivity in Christchurch, particularly in the construction sector. This led to a substantial increase in the aggregate regional labour productivity in the Canterbury region in 2013, 2015, and 2016. Moreover, this increase persisted until 2018 in Christchurch city, a full 7 years after the earthquakes.
The results can be interpreted as a consequence of changes in firm profits (value added) and labour re-allocation in the Canterbury region following the earthquakes. Post-disaster, the primary focus inevitably shifted to reconstruction, leading to a substantial increase in the average number of workers in the construction sector. Concurrently, however, there was a notable rise in value added, surpassing the percentage increase in the average workforce. In contrast, the aftermath saw a significant decrease in both the average number of workers and value added in manufacturing, retail trade, and other activities, as evident in .
Furthermore, following the Canterbury earthquakes sequence, insurers have played a central role in the recovery period by ensuring the availability of funding for reconstruction works post-disaster. The estimated total of claim costs is approximately $38 billion, with about 66% of insurance claim payments were ultimately absorbed by global reinsurers. Consequently, the inflow of funds from overseas, particularly from reinsurance, plays a pivotal role during the reconstruction and recovery period (Ito & McCauley, Citation2022; RBNZ, Citation2021).
These findings align partially with Wood et al.'s (Citation2016) descriptive paper, indicating that the ratio of construction employment in Canterbury, compared to nationwide construction employment, almost doubled. At the same time, the ratios in other industries either decreased or remained relatively stable after the seismic events.
Our findings differ from those of Leiter et al. (Citation2009) in several aspects. In our study, we defined labour productivity as the ratio of value added per firm to the number of workers. We found that the value-added increased by a higher percentage than the increase in the number of workers in the construction sector, resulting in a significant and positive increase in labour productivity in the Canterbury region. In contrast, Leiter et al. (Citation2009) investigated the effects of floods on firms’ productivity and measured firm productivity based solely on value-added. Their study found a decrease in value-added for firms in the flooded areas.
Another significant difference lies in the study periods. Our study spanned 10 years after the event, while Leiter et al. (Citation2009) only examined the first two years after the flood events they investigated. The impact of the earthquakes we analysed fully emerged only three years after the beginning of the earthquakes as the process of reconstruction took much longer (indeed, it is still ongoing in 2024).
In summary, our study, employing the dynamic Difference-in-Differences approach, revealed a significant positive impact of the Christchurch earthquakes on labour productivity in Christchurch, particularly in the construction sector, leading to a substantial increase in the average labour productivity throughout the entire Canterbury region. However, the re-construction of the region will not continue forever, and there are some signs that is has been winding down recently. The implications of this slowdown in construction for labour productivity and incomes are, of course, not yet identifiable in the existing data. However, this reversal may lead to an un-welcome negative adjustment to the positive picture that our research painted.
In short, our study has uncovered a possibly unexpected positive impact of the earthquakes on labour productivity, but most of it, maybe predictably, concentrated within the construction sector. This finding underscores the necessity for further investigation into the mechanisms by which earthquakes can foster labour productivity that can be sustained. Moving forward, continued exploration of these mechanisms and their potential implications to other shocks, to other sectors, or to different regions will enhance resilience in post-disaster scenarios and aid in shaping more effective disaster response strategies.
Author contributions
Both authors contributed to the study's conception and design. Material preparation, data collection and analysis, and the first draft were completed by Yousef Abdeljawad. Both authors commented on all previous versions of the manuscript, read and approved the final manuscript.
Disclaimer
These results are not official statistics. They have been created for research purposes from the Longitudinal Business Database (LBD) which is carefully managed by Stats NZ. For more information about the LBD please visit https://www.stats.govt.nz/integrated-data/
Disclosure statement
No potential conflict of interest was reported by the author(s).
Additional information
Funding
References
- CERA, Canterbury Wellbeing Index. (2013). Canterbury Earthquake Recovery Authority, Christchurch, New Zealand. (PUB 145. 1306). https://thehub.swa.govt.nz/assets/documents/canterbury-wellbeing-index-20140205.pdf
- Chen, Y., Li, C., Chang, C., & Zheng, M. (2021). Identifying the influence of natural disasters on technological innovation. Economic Analysis and Policy, 70, 22–36.
- Dieppe A. (2021). Global productivity: Trends, drivers, and polices. Washington, DC: World Bank. http://hdl.handle.net/10986/34015
- GeoNet. (n.d.). Earthquake statistics. https://www.geonet.org.nz/earthquake/statistics
- Goldmann, E., & Galea, S. (2014). Mental health consequences of disasters. Annual Review Public Health, 35, 169–183. https://doi.org/10.1146/annurev-publhealth-032013-182435
- Insurance Council of New Zealand (ICNZ). (2024). Canterbury earthquakes. Canterbury Earthquakes - ICNZ | Insurance Council of New Zealand.
- Ito, H., & McCauley, R. N. (2022). A disaster under-(re)insurance puzzle: Home bias in disaster risk-bearing. IMF Economic Review, 70, 735–772. https://doi.org/10.1057/s41308-022-00172-w
- Leiter, A., Oberhofer, H., & Raschky, P. (2009). Creative disasters? Flooding effects on capital, labour, and productivity within European firms. Environ Resource Econ, 43, 333–350. https://doi.org/10.1007/s10640-009-9273-9
- McAneney, J., Timms, M., Browning, S., Somerville, P., & Crompton, R. (2022). Normalised New Zealand national disaster insurance losses: 1968-2019. Environmental Hazards, 21(1), 58–76. https://doi.org/10.1080/17477891.2021.1905595
- Mendoza, C. A., Breglia, G., & Jara, B. (2020). Regional labour markets after an earthquake. Short-term emergency reactions in a cross-country perspective: Cases from Chile, Ecuador, Italy. Review of Regional Research, 40(2), 189–221. https://doi.org/10.1007/s10037-020-00144-5
- Ministry of Business, Innovation and Employment (MBIE). (2017). Briefing for the Incoming Minister for Small Business October 2017. Briefing for the incoming Minister for Small Business (mbie.govt.nz).
- Neise, T., Sohns, F., Breul, M., & Diez, J. (2022). The effect of natural disasters on FDI attraction: A sector-based analysis over time and space. Natural Hazards, 110, 999–1023. https://doi.org/10.1007/s11069-021-04976-3
- Nguyen, C., & Noy, I. (2020). Comparing earthquake insurance programs: How would Japan and California have fared after the 2010-2011 earthquakes in New Zealand? Disasters, 44(2), 367–389. https://doi.org/10.1111/disa.12371
- Noy, I., & Strobl, E. (2022). Heat waves and innovation in Air conditioning in the United States. Weather, Climate, and Society, 14(1), 143–154. https://doi.org/10.1175/WCAS-D-21-0095.1
- Noy, I., & Strobl, E. (2023). Creatively destructive hurricanes: Do disasters spark innovation? Environmental and Resource Economics, 84(1), 1–17. https://doi.org/10.1007/s10640-022-00706-w
- OECD. (2016). OECD compendium of productivity indicators 2016. OECD Publishing. https://doi.org/10.1787/pdtvy-2016-en
- Parker, M., & Steenkamp, D. (2012). The economic impact of the Canterbury earthquakes. Reserve Bank of New Zealand Bulletin, 75(3), 13–25. https://www.rbnz.govt.nz/-/media/13c98384fb6042b9a0a5478448c8d1b0.ashx?sc_
- Passarelli, M., Bongiorno, G., Cucino, V., & Cariola, A. (2023). Adopting new technologies during the crisis: An empirical analysis of agricultural sector. Technological Forecasting & Social Change, 186(2), 1–13.
- Poontirakul, P., Brown, C., Seville, E., Vargo, J., & Noy, I. (2017). Insurance as a double-edged sword: Quantitative evidence from the 2011 Christchurch earthquake. Geneva Papers on Risk and Insurance, 42, 609–632. https://doi.org/10.1057/s41288-017-0067-y
- Potter, S., Becker, J., Johnston, D., & Rossiter, K. (2015). An overview of the impacts of the 2010-2011 Canterbury earthquakes. International Journal of Disaster Risk Reduction, 14, 6–14. https://doi.org/10.1016/j.ijdrr.2015.01.014
- Reserve Bank of New Zealand (RBNZ). (2021). Funding and reserving Canterbury earthquake insurance claims. AN2021/02. https://www.rbnz.govt.nz/hub/publications/analytical-note/2021/an2021-02.
- Saha, SK. (2023). Does the impact of the foreign direct investment on labor productivity change depending on productive capacity? Journal of the Knowledge Economy, https://doi.org/10.1007/s13132-023-01444-0
- Samargandi, N. (2018). Determinants of labour productivity in MENA countries. Emerging Markets Finance and Trade, 54(5), 1063–1081. https://doi.org/10.1080/1540496X.2017.1418658
- Sharpe, A., & Mobasher Fard, S. (2022). The current state of research on the two-way linkages between productivity and well-being, ILO Working Paper 56 (Geneva, ILO). https://www.ilo.org/wcmsp5/groups/public/—dgreports/—inst/documents/publication/wcms_839845.pdf
- Stats NZ. (2019). 2018 census population and dwelling counts. https://www.stats.govt.nz/information-releases/2018-census-population-and-dwelling-counts
- Stats NZ. (2021). Agricultural Production Survey. https://statisticsnz.shinyapps.io/farm_area_count_apr21/_w_71f19be2/session/ab332c88050546aa8c6f58f139c501b3/download/download_data?w=71f19be2
- Stats NZ. (2023). Regional gross domestic product: Year ended March 2022. https://www.stats.govt.nz/assets/Uploads/Regional-gross-domestic-product/Regional-gross-domestic-product-Year-ended-March-2022/Download-data/regional-gross-domestic-product-year-ended-march-2022-corrected.xlsx
- Ta, Q. (2022). Essays on economic impacts of disasters: The aggregate and disaggregate evidence. Victoria University of Wellington. https://openaccess.wgtn.ac.nz/articles/thesis/Essays_on_Economic_Impacts_of_Disasters_The_Aggregate_and_Disaggregate_Evidence/20417652
- Tanaka, A. (2015). The impacts of natural disasters on plants’ growth: Evidence from the Great Hanshin-Awaji (Kobe) earthquake. Regional Science and Urban Economics, 50, 31–41. https://doi.org/10.1016/j.regsciurbeco.2014.11.002
- Wood, A., Noy, I., & Parker, M. (2016). The Canterbury rebuild five years on from the Christchurch earthquake. Reserve Bank of New Zealand Bulletin, 79(3), 1–16. https://api.semanticscholar.org/CorpusID:130995741
- Zhang, Z., & Ruan, J. (2020). Do long-run disasters promote human capital in China? The impact of 500 years of natural disasters on county-level human capital accumulation. International Journal of Environmental Research and Public Health, 17(20), 7422. https://doi.org/10.3390/ijerph17207422