
 ?Mathematical formulae have been encoded as MathML and are displayed in this HTML version using MathJax in order to improve their display. Uncheck the box to turn MathJax off. This feature requires Javascript. Click on a formula to zoom.
ABSTRACT
We use data from a leading global database, primarily the reported numbers of fatal ‘hydrological’, ‘meteorological’ and ‘geophysical’ disasters and associated fatalities, to elucidate long-term trends in natural disaster impact. There are very strong upward trends in the number of reported disasters. However, we show that these trends are strongly biased by progressively improving reporting. We apply well-established methods based on analysing evolving differences in the patterns of large (many fatalities) to small (fewer fatalities) events to assess and quantify this bias. For all disaster types investigated, the long-term (multi-decade) true number of disasters appears to be unexpectedly stable over time. There was, however, a clear temporary increase between 1980 and 1990 for hydrological and meteorological disasters. Importantly, there has been a large long-term decline in total fatalities reported for weather-related disasters, attributable to very effective mitigation for larger disasters. Probably due to improved mitigation rather than reduced hazard, data for the most recent decades shows a systematic decrease in the number of larger (more fatality) weather-related disasters compared to smaller ones. In contrast, for the geophysical disasters, predominantly earthquakes, the relative numbers of larger versus smaller disasters, are fairly constant, as are total fatalities.
Introduction
Natural hazards, such as earthquakes, floods and storms, can cause natural disasters, i.e. significant negative impacts on human society in the form of loss of life and property, and socio-economic disruptions (Onyango & Uwase, Citation2017). Assessed possible future impact of a disaster is referred to as disaster risk (UN, Citation2016), and understanding trends in disaster risk based on experiences of previous events is crucial in devising optimal disaster risk reduction and mitigation strategies. Relevant data for such analyses is collated by various actors on both national and global levels (Mazhin et al., Citation2021).
In this study, we examine the reporting completeness of the widely cited ‘EM-DAT’ Emergency Events Database (Guha-Sapir (Citation2023)) and its implications on the interpretations of trends. We use the term true number of disasters to refer to the actual number of ‘disasters’, where our chosen definition of ‘disaster’ means at least one fatality. Not all such disasters may be reported, partly as the event may be completely unknown to the database and also because known events are included in the database (‘reported’) only if these fulfil the database’s entry criteria. We use the term completeness to refer to how closely the reported number of disasters in the database reflects the true number of disasters.
The primary purpose of this study is to help elucidate the long-term global evolution of some disaster impacts, quantified by human impact (fatalities rather than e.g. economic losses). While analysis of local and regional impact is vital, especially for planning mitigation actions, the limited number of disasters in most regions means that various factors can combine to lead to very large fluctuations in disaster impact over shorter time periods, especially for limited geographical areas, concealing possible underlying trends. Our study (below) demonstrates that by averaging globally and over longer time periods, relatively stable results can be obtained, allowing for a reliable trend analysis that can help guide mitigation actions even when data is sparse.
The very extensively used EM-DAT database focuses on human impacts and is fully open (not all others are). It is well-suited for our analysis as it contains disaster information from 1900, and collates and presents data in a homogeneous manner, assisting in analyses of relative trends for different disaster types.
Various authors (Field et al., Citation2012; Gall et al., Citation2009; Hoeppe, Citation2016; Pielke, Citation2021) have noted that there are reporting deficiencies in the EM-DAT data that may affect trends but proceed to present trend analyses without correction. The EM-DAT operators themselves discourage using EM-DAT data from before 2000 for trend analysis (Guha-Sapir (Citation2023)). Recently, Jones et al. (Citation2022) investigated the 20 most cited empirical studies utilising EM-DAT as the primary or secondary data source and found that, with only one exception, the mention of data incompleteness was limited to a couple of sentences, if mentioned at all. Based on trend analysis, Alimonti and Mariani (Citation2023) conclude that EM-DAT can be regarded as relatively complete since 2000.
Long-time periods are relevant for trend analysis of disaster data, especially as major disasters can be very rare because weather patterns and associated hazards vary significantly and because there may be long-term changes in hazards driven by climate change (the normal definition of ‘climate’ is based on weather averaged over 30 years, NOAA, Citation2023a). Data only since 2000 is, therefore, of limited interest to the type of trend analysis we wish to conduct. The methods described below for assessing and compensating for incompleteness allow trend analyses for the entire EM-DAT dataset, from 1900.
We investigate EM-DAT geophysical, hydrological and meteorological disaster data. We present and compare cumulative frequency-fatality distributions of each disaster type for consecutive time periods between 1900 and 2020, using a methodology that was applied to flood (hazard) data by Malamud and Turcotte (Citation2006) and earthquake disaster data by Nishenko and Barton (Citation1995) and Joshi et al. (Citation2024). We then present a smoothed time series of data subsets. The results reveal some strong apparent, but severely biased, trends. We demonstrate a simple methodology for identifying and compensating for some of the biases.
Materials and methods
We analyse disaster EM-DAT geophysical, hydrological and meteorological data with at least one reported fatality. The geophysical disaster subgroup includes earthquakes (83% of these events), mass movement (dry) and volcanic activity. The hydrological disaster subgroup includes floods (87% of these events) and landslide disasters. The meteorological disaster subgroup includes storms (87%), extreme temperature and fog. The EM-DAT catalogue also contains a related category ‘climatological disasters’, including droughts. We do not include this data in our analysis as there are relatively few events (figures included in supplementary). We focus on reported fatalities in EM-DAT, partly because these are the ‘the quintessential aspect of a major crisis’ (Guha-Sapir et al., Citation2004) and partly because these are generally considered the most robust impact parameter (e.g. Jones et al., Citation2022).
EM-DAT event entry criteria are one or more of the following (Guha-Sapir, Citation2023): 10 or more deaths, 100 or more people affected/injured/homeless, declaration of a state of emergency and/or appeal for international assistance (see also supplementary). Events with fewer than 10 fatalities are not registered in EM-DAT unless another criterion is fulfilled, so only a proportion of few fatality events will be registered. However, importantly for trend analysis, EM-DAT applies the same criteria for all time periods, so if all events are known, then this proportion should be fairly constant over time.
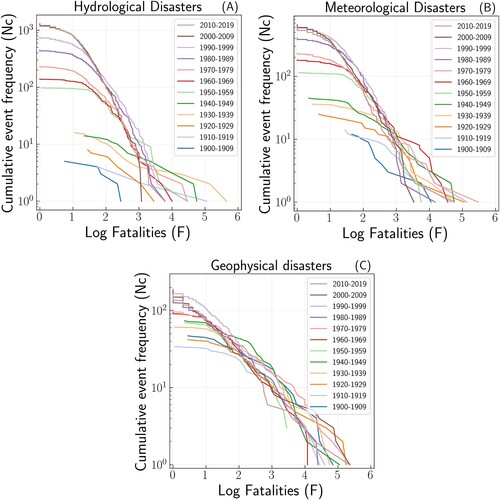
A complex natural phenomenon such as a hurricane, flood, storm or earthquake can often be characterised by ‘point’ data in the sense of a single number summarising the size of some aspect of the phenomenon, such as earthquake magnitude. It has been observed that much such data for natural hazards are often, in total or partially, consistent with power-law size-frequency distributions (Corral & González, Citation2019; Gutenberg & Richter, Citation1944; Malamud & Turcotte, Citation2006), in that the total number of events of given ‘magnitude’ decreases systematically with magnitude (see below). Quantified impacts of natural disasters (e.g. fatalities per disaster) originating from these hazards are often similar in character to such hazard data in the sense that small (e.g. few-fatality) disasters are far more frequent than large disasters (Nishenko & Barton, Citation1995). In some cases, such data also exhibits power-law-like frequency-size distributions. Similar to Nishenko and Barton (Citation1995), we plot the cumulative number of disasters of a given type, with fatalities equal to or exceeding F, against fatalities incurred in each disaster (F), on a log–log scale. presents together data for twelve 10-year periods between 1900 and 2020, plotted separately for each period, for the three major natural disaster subgroups. Much of the data displays near-linear (near power law) linear segments in the middle of the graphs. At these mid-fatalities, there are generally many events, so this data provides a stable representation of any underlying statistical distribution. For large (many fatalities) events, there is usually more scatter, which may be expected if there is (pseudo)randomness in the occurrence of these relatively few major disasters. There are fewer smaller (few fatalities) events, but as we show below, underreporting of these is significant. A linear segment on a frequency-size graph, implying a power-law relationship between the number of disasters and fatalities incurred (Clauset et al., Citation2009; Newman, Citation2005), follows the equation:
where k is a constant and l is the slope of the straight line in the log–log graph. Towards lower fatality values, we see () that the data deviate away from straight-line behaviour. The world is complex, and, in general, there is no theoretical a priori reason that hazard and disaster data should exhibit behaviour similar to a particular type of ‘extreme value distribution’ (Alves & Neves, Citation2011; Gumbel, Citation1958) or power-law distribution at any or all ‘magnitudes’ (F). However, show clear empirical evidence for near straight-line behaviour on the graphs, except for smaller fatalities. There are various possible reasons why power-law-like behaviour in the data may disappear for, e.g. smaller events (small F). However, in many cases, e.g. for earthquake hazard, it is very well-established that a flattening off of such curves at smaller F is usually simply the result of underreporting of a proportion of the smaller events, i.e. that in reality, the near power-law behaviour continues for smaller events, but that some of these are not ‘detected’ and included in the data set. In such a case, fewer small events are observed than the number, which would be consistent with the extrapolation of apparent power-law (straight line) behaviour seen for larger events. The magnitude (in , fatality) value at the point on the graph where the line to the left deviates from straight line behaviour is referred to as the limit (or magnitude) of completeness. Several methods exist for estimating this threshold value (e.g. Mignan & Woessner, Citation2012). Estimation of completeness is a routine part of seismological data analysis, and the method used below has already been demonstrated and verified for the EM-DAT earthquake disaster subset (Joshi et al., Citation2024).
Figure 1. Frequency-fatality plots (cumulative) for (A) hydrological, (B) meteorological and (C) eophysical disasters in the EM-DAT database, for sequential periods. Cumulative event frequency on the y-axis refers to the cumulative number of disasters with fatalities equal to or exceeding a given number of fatalities reported for each individual disaster (
, x-axis).
EM-DAT’s entry criteria mean that not all events causing fewer than 10 fatalities will be completely reported. Thus, for , EM-DAT could be ‘complete’ according to EM-DAT’s entry criteria but incomplete in the sense that not all events killing less than 10 people are included. However, the formal EM-DAT entry criteria are the same for all times, so observed time evolution in the apparent limit of completeness should be unaffected by this formal entry criterion. Examining the frequency-size plots from sequential time windows () and simple time series of disaster data ( and ) reveals systematic changes over time in the character of the data. We also examine two other, in some ways more detailed, databases to elucidate if it is plausible that the near power-law behaviour observed in EM-DAT would extend to events with few fatalities if data were available.
Figure 2. Ten-year running average of the annual number of (A) hydrological, (B) meteorological and (C) eophysical disasters per year in EM-DAT, separately for disasters with fatalities between 1–9, 10–99, 100–999, 1000 and above. For clarity, the annual data are not shown.
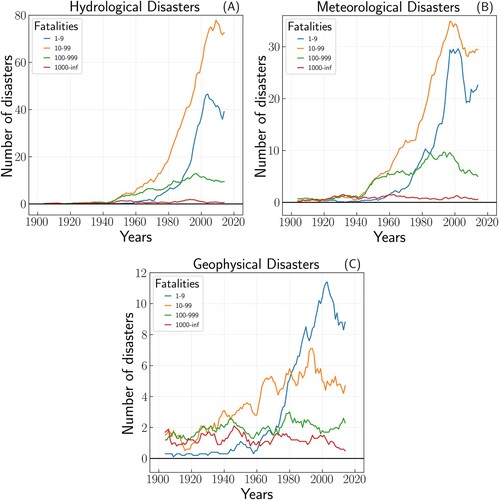
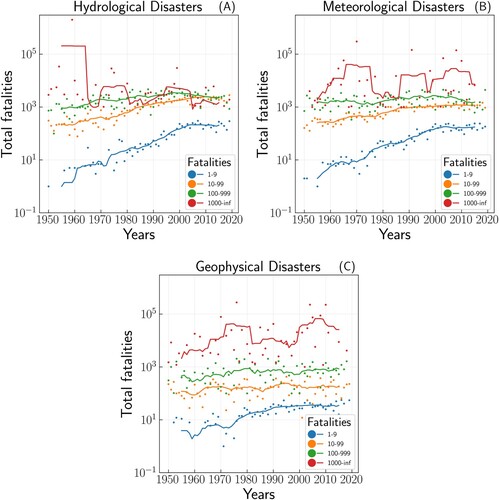
Figure 3. Ten-year running average (lines) of the total annual fatalities and annual data (dots) from (A) hydrological, (B) meteorological and (C) geophysical disasters per year in EM-DAT, separately for disasters with fatalities between 1–9, 10–99, 100–999, 1000 and above.
Results
show the cumulative frequency-fatality plots for disasters recorded in the hydrological, meteorological and geophysical disaster subgroups in EM-DAT, for ten-year periods. Clear near straight-line (power law) sections are seen for all, or almost all, data subsets but not for the smaller (fewer fatality) disasters.
For the hydrological disasters in (A), the lines for the earliest time periods (1900–1950) deviate strongly from the curves for later years, with very few reported events, some of which are massively fatal flood events. The frequency-size graphs for these decades stretch far to the right on the figure, contrasting strongly with data from 1960 and after. After 1950, the only recorded hydrological disaster in the database with fatalities exceeding 100,000 is the Great Chinese Famine, where the weather is known to also have played an important role (Ashton et al.,Citation1984; Houser et al., Citation2009). The lack of hydrological mega-disasters after this is attributed to the fact that changes in society and technological advances have been extremely effective in mitigating the effects of such disasters. EM-DAT contains very few hydrological disasters with fewer than 100 fatalities before 1950. We believe that this reflects underreporting, not that there were few or no such disasters during these decades. There is a gradual and fairly continuous movement for successive time periods of where, at smaller fatalities (F, Equation 1), the curves in (A) deviate from straight-line behaviour, with this deviation appearing at progressively smaller F over time. Such behaviour is fully consistent with significant underreporting, which decreases gradually over time (Mignan & Woessner, Citation2012). The observed changes in the shape of the frequency-size curves from 1960 until the present are very clear and systematic, and we believe that the only tenable explanation for the earlier major absence of small relative to larger events is underreporting.
The evolution of the data can be further investigated by examining smoothed time series of subsets of the data, where each subset includes only events with reported fatalities within a given range (). After the mid-1900s, there were massive increases in the number of smaller (fewer fatalities) disasters compared to the largest disasters. Naively, this might be attributed to increasing risk due to climate change, population growth and demographic changes together with gradually improving risk reduction actions. However, that in the 1950s, there were approximately the same number of hydrological disasters killing 100–999 people as killing 10–99 ((A)) is not plausible. Nor is that until about 1990, but not after, there were more events killing 100–999 than killing 1–9 people. The very large increases in the number of reported hydrological disasters can, therefore, be attributed, at least primarily, to improved reporting of small (few fatality) disasters. This improved data completeness manifests itself in the straight-line segment in (A) extending farther to the left. Thus, the form of the frequency-size graphs ((A)) strongly implies that significant underreporting existed until fairly recently even for events with 10–99 reported fatalities, i.e. above EM-DAT’s F = 10 entry criterion. From about 1980, this hydrological data appears to be near complete for events killing slightly over 100 people. The data is more complete for the last two decades, but if an assumption that the straight line (power law) behaviour should continue to few-fatality events is correct (discussed below), then even this data appears to be slightly but significantly incomplete even after 2000, even for events with ten or more reported fatalities.
(B), meteorological disasters, demonstrates gradually improving reporting very similar to that for the hydrological events. The geophysical data ((C)) shows similar effects but of clearly lower size, showing that reporting for geophysical disasters has also improved but has been consistently more complete than both the meteorological and hydrological data since 1900. It is not surprising that the earthquake catalogue is relatively complete because any large earthquake disaster (with 100 or more fatalities) was likely caused by a sufficiently large earthquake that would have been observed on seismological networks internationally even 100 years ago, signalling to the world that a natural disaster may have occurred. Our interpretation of (C) is that the reporting of geophysical disasters with more than 1000 fatalities is mostly complete since 1900. Completeness for events with 1000 fatalities or more was likely not attained for meteorological disasters until the 1930s and for hydrological disasters in the 1950s. Closer examination indicates that most meteorological disasters with more than 100 fatalities have likely been reported since the 1960s. For the last two decades, the meteorological disasters appear to be almost complete or complete for events with 10 or more fatalities (EM-DAT’s entry criterion). The geophysical disasters ((C)) appear complete for disasters with a few tens of casualties already in the 1960s and from 1970 for disasters with 10 or more fatalities. Completeness for the hydrological data appears to have increased most but from initial lower levels.
The event underreporting into EM-DAT also affects the aggregated figures for the total number of reported fatalities. How ‘sensitive’ the total fatality numbers are to the underreporting is largely governed by the slope of the curves (Equation 1, ), reflecting the proportions of higher to lower fatality events. The maximum likelihood (Aki, Citation1965; Utsu, Citation1965) slopes for the three disaster categories are very different, for 2000–2019 0.46 ± 0.04 (geophysical, see supplementary), 0.81 ± 0.04 (meteorological) and 0.96 ± 0.03 (hydrological). The low slope for geophysical events means that the relatively few larger events dominate aggregated fatalities. In contrast, the slope close to one for hydrological disasters means that smaller-fatality events from each decade in fatality (10–99, 100–999 etc) contribute approximately equally to total fatalities.
The effects of underreporting can be clearly seen in the fatality-band time series of total fatalities (), as can the greater proportion of total fatalities from few-fatality disasters for the weather-related events compared to the geophysical. For the relatively few many-fatality events, the decadal average data () show abrupt changes due to individual large events, even for earthquakes where underlying (time-averaged) hazard is driven by constantly ongoing large scale tectonic processes and is essentially time-stationary. demonstrates that, because of the frequency-size distributions of the phenomena, assessing the underlying evolution of risk directly from time series of total annual fatalities is not a robust approach. Assessing evolution from the frequency-size distributions () is clearly more reliable.
Summarising the above, the well-sampled mid-fatality data () are close to time-invariant since 1960, being similar in character and overlapping (see also Figures SD.6). If the character of the few-fatality data is similarly time-invariant, then the differences in the level of the few-fatality events on can with confidence be largely attributed to underreporting. Supporting evidence for this is that it is well-known that reporting has improved over time, that we see very similar evolution for weather-related and solid earth-related disasters, that the changes over time on are clear and systematic, and that data for some decades ago has implausibly low numbers of few-fatality disasters relative to larger. We cannot ‘recreate’ data for the missing individual events but, based only on an assumption of time-invariance, can deduce the approximate minimum numbers of missing events of given fatality, under the assumption that the shapes of the curves in for the older data should be similar to the more recent data (the intersect with the vertical axis is the total number of events). The overlap of the well-constrained data in implies that the decadal global number of fatalities, including those not reported, has been fairly constant over time for some decades.
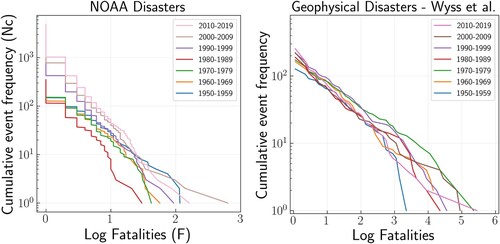
The above deductions are not in any way dependent upon the data being near power law. We now perform a separate analysis to consider if it is plausible that the observed near power-law behaviour would extend to the smallest fatality events if reporting were complete. The gradual extension with time in of the near straight-line (near power law) segments of the graphs to the left, which we attribute to improving reporting, indicates that this may be the case, but as EM-DAT’s entry criteria mean that it should not include all the smallest events, this data cannot be used to assess if the true power-law behaviour does extend to events with few fatalities. We investigate this using other data sets that aim to include all smaller disasters. There are various such databases focused on particular types of disasters or on specific geographical regions. We present two examples of such data in . One of these is a global earthquake disaster database (Wyss et al., Citation2023). This partly overlaps with EM-DAT but also includes more few-fatality events while specifically excluding some types of earthquake disasters not directly caused by ground shaking. The second is a database from NOAA (NOAA, Citation2023b). It includes some hydrological and a few geophysical events but contains largely events that would probably be classed by EM-DAT as ‘meteorological’. The frequency-fatality graphs for these data show apparent power-law behaviour extending to the smallest events (one reported fatality), making it likely that the power-law behaviour seen in the EM-DAT data would extend to the smallest events if all data on few-fatality events were available and included. In this case, we can, with a power-law assumption, extrapolate the near straight-line parts of the frequency-size curves in order to estimate the ‘true’ number of fatal events of the different categories and thereby estimate what proportion of fatal events of these types are included in EM-DAT. For the period 2000–2019, results (supplementary) indicate that only 16%, 39% and 92% of the fatal hydrological, meteorological and geophysical events are included in EM-DAT, corresponding to approximately 1465 (19%) hydrological, 305 (2%) meteorological and 4 (0.01%) geophysical ‘missed’ total fatalities per year.
Figure 4. Frequency-fatality plots of data from two more limited but more detailed databases than EM-DAT, showing clear near power-law behaviour even for events with very few fatalities. (Left) NOAA storm events database (NOAA, Citation2023b) contains data from January 1950 to August 2023, with a large increase in the number of event types included since 1996. All time periods show near power-law behaviour. (Right) Wyss et al. (Citation2023) database mainly contains disasters with building collapse as the main cause. No separation between fatalities from landslides, fire and liquefaction exists, and total fatalities are used in all cases. The database does not contain the high-fatality events with tsunamis as a main cause of death, leading to fewer high-fatality events than on , ‘distorting’ the curves. Apart from the part of the curves affected by this effect, the near-linear behaviour continues to the low-fatality disasters.
Finally in this section, we consider if significant real (not underreporting artefacts) deviations from time-invariability can be seen in . The considerable scatter observed at large fatalities is to be expected if the observed data for a given period is a single random realisation of an underlying statistical (risk) distribution, because we can by chance expect to see significant differences for the few largest events in the different time periods. Such ‘scatter’ is observed. The major decrease in the number of very large (fatality) hydrological disasters in the mid-1900s is, however, well-constrained (supplementary). While the well-constrained mid-fatality data in are similar for all data after 1960, there are some differences. During the 1980s and 90s, a consistent upwards shift is seen for the clearly near-linear segments of the hydrological and meteorological disasters in (A and B) (see also supplementary). For the meteorological data, Monte Carlo simulations show that this shift is significant at far above the 95% confidence level. The cause of these shifts is discussed below.
Discussion
EM-DAT certainly reflects many important aspects of disasters even though it does not include all disaster impacts (not e.g. biodiversity loss), not all impacts are easily robustly quantifiable and it is well-known that disaster reporting reliability has increased greatly. Our approach described above allows estimation of the evolving level of underreporting, allowing less biased estimation of trends in EM-DAT fatality data.
This underreporting in EM-DAT appears to be of major practical significance because various studies have interpreted the very large observed increase (factor 4, 5 or even 10) in the reported global number of weather-related natural disasters since 1960 to be real and a consequence of climate change. This includes studies from MunichRe (Hoeppe, Citation2016), the Asian Development Bank (Thomas & López, Citation2015) and the WMO (World Meteorological Organization, Citation2021) (the latter two used the same EM-DAT that we have used). Various authors (Field et al., Citation2012; Gall et al., Citation2009; Hoeppe, Citation2016; Pielke, Citation2021) have noted that there are reporting deficiencies in the data that may affect trends but proceed to present trend analysis without correction (see also Jones et al., Citation2022). In contrast, our frequency-magnitude approach allows the assessment of trends in the true number of events and of the level of underreporting. Our results are in agreement with Alimonti and Mariani (Citation2023), in that reporting has improved, although we show that this is more gradual over time and that reporting completeness has evolved differently for different disaster types.
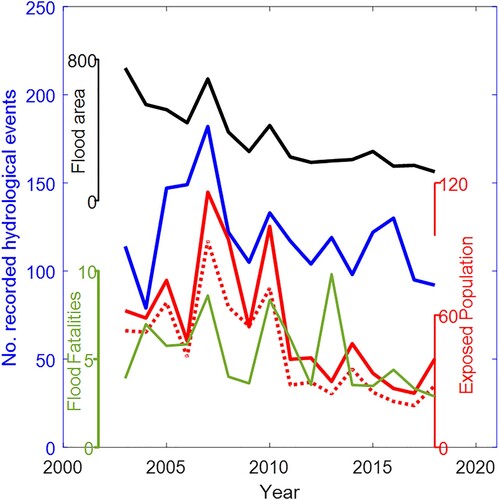
Our assessments of underreporting are based on clearly observed consistency over time (). We attribute the ‘minor,’ but statistically significant, observed shifts up, then down again, for some of the weather-related data (1980–2000, discussed above) to real temporal changes in weather-related hazard. The well-constrained parts of the frequency-size data () are similar for the periods before 1980 and after 2000 implies that the clear recent decline in these data is not primarily due to a down-going trend in vulnerability but to real changes in hazard. Atmospheric and ocean dynamics mean that global weather-related hazards can, in some cases, be time-variable on decadal time scales, so fluctuations in risk levels may be expected, even if the longer-term hazard is increasing due to climate change. For example, the 2021 study of Tellman et al. (Citation2021) shows correlated inter-annual variations in hazard and risk, and a decrease in estimated annual global flood area between 2003 and 2018 (), consistent with our findings of a recent decrease in hydrological disaster numbers ( and ). A likely explanation for the temporary increase in risk (via hazard) for 1980–2000 is El Niño (Wooster et al., Citation2012). This 20-year period (1980–2000) included the two strongest El Niño events on record (1997–1998 and 1982–1983), along with an unprecedented series of more frequent, but weaker, El Niños. Recent peaks in the occurrence of weather-related disasters are seen clearly in . The corresponding geophysical data also shows a recent, numerically smaller, peak for the lower fatality events. Possible explanations are that this peak is not statistically significant, that weather phenomena affected some aspects of seismic risk (e.g. stimulated landslides) or that there was a period of enhanced seismic risk due to temporal clustering in the form of destructive aftershocks after massive earthquakes that occurred at the relevant time.
Figure 5. Annual flood area 2003–2018 estimated from satellite data (black, thousands ) and corresponding ‘exposed population’ and ‘adjusted exposed population’ (modified after Tellman et al. (Citation2021), red and dotted red, millions). Green is the annual flood fatalities in EM-DAT (thousands), and blue is the corresponding EM-DAT annual number of events. Note that the flood area and exposed population data for the years 2000–2002 of Tellman et al. (Citation2021) have been omitted due to the NASA Aqua satellite not coming into operation until 2002-05-04 (https://www.earthdata.nasa.gov/learn/articles/aqua-at-20 Accessed on 12/11/2023). The flooded areas for those years were likely to be underreported relative to the subsequent years (Tellman et al., Citation2021). Note also the decrease in the flood area estimates from 2003 to 2018, and the corresponding similar decrease in the number of hydrological disasters as well as the population exposure estimates. The apparently slightly anomalous peak in fatalities in 2013 is primarily due to a single Monsoon-induced flood event in one state in India (6000 fatalities).
1980–2000 was a period of clearly increasing global temperature (Gillett et al., Citation2021). Despite some hazard-driven variations and ongoing climate change, our analysis of incompleteness demonstrates that most of the major increase in the number of reported meteorological and hydrological events during this period is a reporting artefact. also shows that after 2000, there was a clear decrease in the number of events in most fatality bands for both hydrological and meteorological disasters, irrespective of underreporting.
The very large and very long-term (120 years) reduction in reported total fatalities from meteorological and hydrological disasters (Figure S3) is attributed to reduced vulnerability, not decreased hazard or reporting artefacts (World Meteorological Organization, Citation2021). The down-going trend in fatalities is strongest for the hydrological disasters. Analysing how this major improvement has been achieved is outside the scope of this study, but it is clear (Cools et al., Citation2016; Liu et al., Citation2018; Perera et al., Citation2019, Citation2020; Thielen-del Pozo et al., Citation2015) that one relevant factor is the relatively slow evolution of large scale flooding together with increasing ability to quickly warn and move exposed populations. Another major factor is improved abilities after the disaster, to, e.g. better supply of potable water, food and shelter. Even if hazard increases, impact (fatalities) may decrease if the total vulnerability of the exposed populations has decreased sufficiently. The steeper gradients (l-value) for the more recent weather-related data ( and supplementary) shows that while there is little evidence that the mitigation actions have reduced the true number of weather-related fatal disasters, according to EM-DAT’s figures they have been very successful in disproportionately reducing the risk of many deaths when a disaster occurs.
clearly shows that since about 1960 total fatalities and the proportion of large- to few-fatality events have been rather constant. This means a near-constant time-averaged global number of fatalities, and thus, the observed risk of death for an average human due to the aggregated effects of the relevant type of hazard decreased roughly in proportion to global population growth. This automatically includes the effects of relative population movements into and out of areas of hazard, i.e. if people have chosen to live in hazard areas. Global population is well-known so this is a robust normalisation of total fatalities, allowing direct comparison of fatality-risk from different natural hazards and also with other risks society faces, and is thus relevant when considering how risk mitigation resources might best be used, in a broad perspective.
Risk per capita is one of many ways to quantify ‘vulnerability’ (supplementary). Other studies use other metrics. For example, using similar data but a different approach Formetta and Feyen (Citation2019) estimated that global vulnerability for some weather-related hazards decreased by a factor of 6.5 after 1980, a much larger decrease than our conceptually similar estimate of about 1.45 (i.e. population growth over the relevant period). Defined ‘vulnerability’ to natural hazards is generally a normalised estimate of how sensitive society is to a given hazard or hazards, conceptually ‘risk’/’hazard’, normalised with, e.g. exposed population. Formetta and Feyen (Citation2019) do not directly consider hazards but normalise with the number of all reported disasters, essentially using this as a proxy for the number of significant hazards. Our global risk estimate implicitly includes a similar approach. The estimate of Formetta and Feyen (Citation2019) is thus sensitive to possibly evolving entry criteria and incompleteness in the data set they used (supplementary). We do not have access to that commercial database, nor do we know the exact entry criteria, but Formetta and Feyen (Citation2019) report that the fatality data are very similar to that in EM-DAT. The differences in our risk per capita versus their vulnerability estimates are, therefore, primarily attributable to the increasing number of reported disasters in the database they use. We are aware of no empirical data, suggesting that there have been massive increases in hazard that would be necessary to cause such an increase in the number of disasters, e.g. an approximately 100-fold increase since 1980 in the number of flash floods (supplementary). The increasing number of reported events could presumably be due to a combination of increased hazard, incomplete data, and possibly disaster definition criteria (e.g. including economic aspects). Some effects can cause a correct, but potentially misleading, increase in the number of events classed as ‘disasters’. Irrespective of the explanation, our results show that Formetta and Feyen’s figure of a decrease in global vulnerability by 85% since 1980 is potentially misleading, given that the risk to an average individual decreased by far less than this, i.e. that mitigation actions regarding these weather-related disasters have been far less effective than Formetta and Feyen (Citation2019) appear to imply.
As we noted above, there is a clear increase in gradient (l-value, and ) for the hydrological and meteorological data for the most recent decades, which we attribute to highly successful mitigation actions successfully reducing fatalities for the higher fatality events. It is natural to suspect that this is related to increasing global wealth and effective organisation in modern society. It is, therefore, interesting to note that the gradient of the USA data () is significantly higher than for the related global data shown in . This implies that, other things remaining equal, the global curves for hydrological and meteorological disasters will continue to become progressively steeper, implying further reductions in total fatalities. It remains to be seen if possible increasing hazard, driven by climate change and perhaps other factors, will counteract this plausible very positive development.
Fatality figures can be uncertain and different estimates of fatalities are sometimes made for the same event for various reasons including how attribution is done. Different types of assessment have limitations and possible biases. For example, excess heat is believed to be a growing risk (IPCC, Citation2023), heat-related fatalities will be included in EM-DAT only if classed as part of a ‘disaster’, and heat fatalities numbers from excess mortality or documented ‘cause of death’ can be very different. The limited number of extreme temperature event data in EM-DAT (about 10 per year in the last decade) makes numerical assessments very uncertain. However, the extreme temperature data in EM-DAT do indicate an approximately doubling of fatal events over the last few decades, consistent with IPCC’s assessment of significant risk of increasing mortality from such events. This has limited effect on (B) as over 80% of those events are storms.
Considering the long time periods we examine, there is the potential for some systematic spurious bias in trends due to incorrect fatality figures rather than ‘missed’ events. However, it is the logs of the values, which are shown in , making this relatively insensitive to errors in the exact numbers of fatalities.
Conclusions
We have analysed global geophysical, hydrological and meteorological disaster data from 1900 to investigate trends. The use of a long time period is important in the context of climate change, given that major anthropogenic global warming first became apparent after 1980. We have not attempted to conduct a comprehensive correlation analysis with the relevant natural hazards. Nor have we investigated vulnerability (fatalities/exposed population) for individual events. Instead, we have successfully revealed trends by investigating the global structures in the database in terms of the time evolution of the numbers of few- versus many-fatality events. The data shows an unequivocal dramatic decrease in the fatalities reported from weather-related disasters over the last century. As reported fatalities from earthquake disasters have not decreased in a similar manner, total reported fatalities from earthquakes and the weather-related disasters are now comparable. Our analysis also shows that the strong upward trend in the number of global geophysical, hydrological and meteorological disasters recorded in the EM-DAT database, notably between 1950 and 2000 is, at least largely, caused by decreasing underreporting of disasters. The true number of fatal such disasters has in fact been fairly constant over this period, as have the underlying global multi-year averages of total fatalities. Global risk of fatality from such disasters has therefore decreased approximately in proportion to population growth (variable SP.POP.TOTL, World Bank Database) since the mid-1900s. This is very positive. Our robustly estimated reduction in vulnerability is, however, far less than that from some studies where global vulnerability to weather-related disasters was estimated using a different methodology. Those estimates may, while correct, be potentially misleading as they might be misinterpreted to imply that mitigation actions have been much more successful than is the case.
The geophysical disasters are different in character from the weather-related disasters in that for the former the relatively few larger-fatality disasters dominate total fatalities. This implies that if the aim is a mitigation action to achieve a reduction in total fatalities, for the geophysical events, the most aggressive hazards should be in focus whereas for the weather-related disasters, even the smaller disasters are very important, as there are so many of them.
Our analysis methodology also allows us to assess shorter-term (e.g. decadal) variations in disaster impact than is possible, e.g. using direct time series analysis of global fatalities. This reveals a temporary increase in the number of weather-related disasters during the period 1980–2000, followed by a return to similar levels as in the 1970s. We attribute this temporary increase and subsequent decline to variations in global hazard, superimposed on a presumed up-going trend in hazard driven by climate change and declining vulnerability.
Using an assumption strongly supported by complementary datasets, we extrapolate to estimate the numbers of events and associated fatalities not included in the global database that we have used in our main analysis. Results indicate that a significant proportion of fatal hydrological and meteorological events is absent in the database, meaning that for these disasters, direct use of the data in the database significantly underestimates total global fatalities for all times.
Thus, inappropriate use of EM-DAT data may lead to underestimates of the current total impacts of weather-related disasters, may lead to incorrectly inferring strong up-going trends in the number of such disasters and may obscure the influence of multi-year variations in hazard on disaster impacts. Our methods allow some elucidation of these matters and facilitate comparisons of the impacts and evolution of disasters of different types. Extra focus is motivated on mitigation actions where up-going trends are clear or suspected (e.g. extreme temperature), or earlier mitigation actions have not yet been successful in radically reducing fatalities (e.g. earthquakes).
Even if aggregated risk has not increased globally, it may have increased significantly in some geographical areas. Mitigation actions must often be planned and implemented locally to address a specific identified hazard, and trends in local or regional hazard may deviate from the global averages. Reliable local hazard estimation is therefore vital. Our study does not focus on the local or regional scale. However, perceptions of the global trends may influence perceptions of local hazards, especially as it seems that the trend artefacts for different types of disaster appear to be of significantly different magnitude, e.g. the trend bias in the number of meteorological and hydrological events is different, and different methods and data can produce very different apparent trends in vulnerability.
Revised_main_supplement.CLEAN.docx
Download MS Word (842.6 KB)Acknowledgements
We thank the CRED team for granting access to the emergency events dataset (EM-DAT). All authors are grateful for the support from the Centre of Natural Hazards and Disaster Science (CNDS).
Disclosure statement
No potential conflict of interest was reported by the authors.
Data availability statement
The EM-DAT database, Version: 2023-05-10, was used in this study and is freely available upon registration at https://public.emdat.be/register.
Global population data was accessed from https://data.worldbank.org/indicator/SP.POP.TOTL. The NOAA data was accessed from https://www.ncdc.noaa.gov/stormevents/ftp.jsp and the (Wyss et al., Citation2023) data was accessed from https://fatal-earthquakes.icesfoundation.org/publications.html.
References
- Aki, K. (1965). Maximum likelihood estimate of b in the formula logN = a-bM and its confidence limits. Bulletin of the Earthquake Research Institute, University of Tokyo, 43(2), 237–239. https://doi.org/10.15083/0000033631
- Alimonti, G., & Mariani, L. (2023). Is the number of global natural disasters increasing? Environmental Hazards, 23(2), 186–202. https://doi.org/10.1080/17477891.2023.2239807
- Alves, M. I. F., & Neves, C. (2011). Extreme value distributions. International Encyclopedia of Statistical Science, 2, 493–496. https://doi.org/10.1007/978-3-642-04898-2_246
- Ashton, B., Hill, K., Piazza, A., & Zeitz, R. (1984). Famine in China, 1958-61. Population and Development Review, 10(4), 613. http://doi.org/10.2307/1973284
- Clauset, A., Shalizi, C. R., & Newman, M. E. J. (2009). Power-law distributions in empirical data. SIAM Review, 51(4), 661–703. https://doi.org/10.1137/070710111
- Cools, J., Innocenti, D., & O’Brien, S. (2016). Lessons from flood early warning systems. Environmental Science & Policy, 58, 117–122. https://doi.org/10.1016/j.envsci.2016.01.006
- Corral, Á., & González, Á. (2019). Power law size distributions in geoscience revisited. Earth and Space Science, 6(5), 673–697. https://doi.org/10.1029/2018ea000479
- Field, C. B., Barros, V., Stocker, T. F., & Dahe, Q. (2012). Managing the risks of extreme events and disasters to advance climate change adaptation: Special report of the intergovernmental panel on climate change. Cambridge University Press. https://doi.org/10.1017/CBO9781139177245.
- Formetta, G., & Feyen, L. (2019). Empirical evidence of declining global vulnerability to climate-related hazards. Global Environmental Change, 57, 101920. https://doi.org/10.1016/j.gloenvcha.2019.05.004
- Gall, M., Borden, K. A., & Cutter, S. L. (2009). When do losses count? Bulletin of the American Meteorological Society, 90(6), 799–810. https://doi.org/10.1175/2008bams2721.1
- Gillett, N. P., Kirchmeier-Young, M., Ribes, A., Shiogama, H., Hegerl, G. C., Knutti, R., Gastineau, G., John, J. G., Li, L., Nazarenko, L., Rosenbloom, N., Seland, Ø., Wu, T., Yukimoto, S., & Ziehn, T.. (2021). Constraining human contributions to observed warming since the pre-industrial period. Nature Climate Change, 11(3), 207–212. https://doi.org/10.1038/s41558-020-00965-9
- Guha-Sapir, D. (2023). “EM-DAT, CRED/UCLouvain, Brussels, Belgium – Www.emdat.be.” Center for Research on the Epidemiology of Disasters (CRED). www.emdat.be
- Guha-Sapir, D., Hargitt, D., & Hoyois, P. (2004). Thirty years of natural disasters 1974–2003: The numbers. Presses univ. de Louvain.
- Gumbel, E. J. (1958). Statistics of extremes. Columbia university press.
- Gutenberg, B., & Richter, C. F. (1944). Frequency of earthquakes in California. Bulletin of the Seismological Society of America, 34(4), 185–188. https://doi.org/10.1785/BSSA0340040185
- Hoeppe, P. (2016). Trends in weather related disasters – consequences for insurers and society. Weather and Climate Extremes, 11, 70–79. https://doi.org/10.1016/j.wace.2015.10.002
- Houser, D., Sands, B., & Xiao, E. (2009). Three parts natural, seven parts man-made: Bayesian analysis of China’s Great Leap Forward demographic disaster. Journal of Economic Behavior & Organization, 69(2), 148–159. http://doi.org/10.1016/j.jebo.2007.09.008
- IPCC. (2023). Climate Change 2023: Synthesis Report. Contribution of Working Groups I, II and III to the Sixth Assessment Report of the Intergovernmental Panel on Climate Change [Core Writing Team, H. Lee & J. Romero (Eds.)]. IPCC, Geneva, Switzerland, 184 pp. https://doi.org/10.59327/IPCC/AR6-9789291691647
- Jones, R. L., Guha-Sapir, D., & Tubeuf, S. (2022). Human and economic impacts of natural disasters: Can we trust the global data? Scientific Data, 9, 572. https://doi.org/10.1038/s41597-022-01667-x
- Joshi, N., Roberts, R., Tryggvason, A., & Lund, B. (2024). Earthquake disaster fatality data: Temporally stable power law behavior and effects of underreporting. Seismological Research Letters, 95(4), 2422–2427. https://doi.org/10.1785/0220230342
- Liu, C., Guo, L., Ye, L., Zhang, S., Zhao, Y., & Song, T. (2018). A review of advances in China’s flash flood early-warning system. Natural Hazards, 92(2), 619–634. https://doi.org/10.1007/s11069-018-3173-7
- Malamud, B. D., & Turcotte, D. L. (2006). The applicability of power-Law frequency statistics to floods. Journal of Hydrology, 322(1), 168–180. https://doi.org/10.1016/j.jhydrol.2005.02.032
- Mazhin, S. A., Farrokhi, M., Noroozi, M., Roudini, J., Hosseini, S. A., Motlagh, M. E., Kolivand, P., & Khankeh, H. (2021). Worldwide disaster loss and damage databases: A systematic review. Journal of Education and Health Promotion, 10(1), 329. https://doi.org/10.4103/jehp.jehp_1525_20
- Mignan, A., & Woessner, J. (2012). Estimating the magnitude of completeness for earthquake catalogs. Community Online Resource for Statistical Seismicity Analysis. https://doi.org/10.5078/CORSSA-00180805. Available at http://www.corssa.org
- Newman, M. E. J. (2005). Power laws, pareto distributions and zipf’s law. Contemporary Physics, 46(5), 323–351. https://doi.org/10.1080/00107510500052444
- Nishenko, S. P., & Barton, C. C. (1995). Scaling laws for natural disaster fatalities. US Department of the Interior, US Geological Survey.
- NOAA. (2023a). New 1991–2020 climate normals. National oceanic and atmospheric administration. https://www.weather.gov/tbw/newnormals
- NOAA. (2023b). Storm events database. NOAA national centers for environmental information. https://www.ncdc.noaa.gov/stormevents/
- Onyango, M. A., & Uwase, M. (2017). Humanitarian response to complex emergencies and natural disasters. In S. R. Quah (Ed.), International encyclopedia of public health (2nd ed.), pp. 106–116. Academic Press. https://doi.org/10.1016/B978-0-12-803678-5.00220-4.
- Perera, D., Agnihotri, J., Seidou, O., & Djalante, R. (2020). Identifying societal challenges in flood early warning systems. International Journal of Disaster Risk Reduction, 51, 101794. https://doi.org/10.1016/j.ijdrr.2020.101794
- Perera, D., Seidou, O., Agnihotri, J., Rasmy, M., Smakhtin, V., Coulibaly, P., & Mehmood, H. (2019). Flood warly warning systems: A review of benefits, challenges and prospects. UNU-INWEH, Hamilton.
- Pielke, R. (2021). Economic ‘normalisation’ of disaster losses 1998–2020: A literature review and assessment. Environmental Hazards, 20(2), 93–111. https://doi.org/10.1080/17477891.2020.1800440
- Tellman, B., Sullivan, J. A., Kuhn, C., Kettner, A. J., Doyle, C. S., Brakenridge, G. R., Erickson, T. A., & Slayback, D. A. (2021). Satellite imaging reveals increased proportion of population exposed to floods. Nature, 596(7870), 80–86. https://doi.org/10.1038/s41586-021-03695-w
- Thielen-del Pozo, J., Thiemig, V., Pappenberger, F., Revilla-Romero, B., Salamon, P., De Groeve, T., & Hirpa, F.. (2015). The benefit of continental flood early warning systems to reduce the impact of flood disasters; EUR 27533 EN; https://doi.org/10.2788/46941
- Thomas, V., & López, R. (2015). Global increase in climate-related disasters. Asian Development Bank Economics Working Paper Series No. 466. SSRN Electronic Journal https://doi.org/10.2139/ssrn.2709331 or https://ssrn.com/abstract=2709331
- UN, United Nations General Assembly. (2016). Report of the open-ended intergovernmental expert working group on indicators and terminology relating to disaster risk reduction.”.
- Utsu, T. (1965). A method for determining the value of b in a formula Log n = a-bM showing the magnitude-frequency relation for earthquakes. Geophysical Bulletin of the Hokkaido University, 13(February), 99–103. https://doi.org/10.14943/gbhu.13.99
- Wooster, M. J., Perry, G. L. W., & Zoumas, A. (2012). Fire, drought and El niño relationships on borneo (Southeast Asia) in the Pre-MODIS Era (1980–2000). Biogeosciences (Online), 9(1), 317–340. https://doi.org/10.5194/bg-9-317-2012
- World Meteorological Organization. (2021). WMO atlas of mortality and economic losses from weather, climate and water extremes (1970–2019). Technical Report.
- Wyss, M., Speiser, M., & Tolis, S. (2023). Earthquake fatalities and potency. Natural Hazards, 119(2), 1091–1106. https://doi.org/10.1007/s11069-022-05627-x