
 ?Mathematical formulae have been encoded as MathML and are displayed in this HTML version using MathJax in order to improve their display. Uncheck the box to turn MathJax off. This feature requires Javascript. Click on a formula to zoom.
ABSTRACT
Using multivariate partial least squares regression (PLS) to perform visual quality grading of sawn timber requires a training set with known quality grades for the training of a grading model. This study evaluated the grading accuracy of an independent test set of sawn timber when changing the aspects of class-balance and class-overlap of the training set consisting of 251 planks. The study also compared two ways of expressing the reference-grade of the training set; by grading images picturing the planks, and by grading the product produced from the planks. Two grading models were trained using each reference-grade to establish a baseline for comparison. Both models achieved a 76% grading accuracy of the test set, indicating that both reference-grades can be used to train comparable models. To study the class-balance and class-overlap aspects of the training set, 25% of the training set was removed in two training scenarios. The models trained on class-balanced data indicated that class-imbalance of the training set was not a problem. The models trained on data with less class-overlap using the product-grade reference suffered a 4%-points grading accuracy loss due to the smaller training set, while the model trained using the image-grade reference retained its grading accuracy.
1. Introduction
Automatic visual quality grading of kiln-dried Scots pine sawn timber can be implemented using machine learning. This paper uses multivariate partial-least squares regression (PLS Geladi and Kowalski Citation1986, Wold et al. Citation2001), which can mimic the holistic and subjective grading performed by manual graders. Using multivariate grading for automatic sorting of sawn timber for a specific product have been implemented in the studies by Olofsson et al. (Citation2019b, Citation2019c), and for similar visual classification purposes by Broman (Citation2000), Lycken and Oja (Citation2006), Breinig et al. (Citation2015), Berglund et al. (Citation2015), and Olofsson et al. (Citation2017). These studies showed the benefits of using multivariate PLS regression models in sawmills, but do not properly discuss the intricacies of selecting training data for machine-learning. Lycken and Oja (Citation2006) tested how a PLS grading model trained on one dimension of planks performed on a different dimension of planks. Olofsson et al. (Citation2019a) showed how a model trained on sawn timber from Scots pine top-logs performed when grading different material sawn from butt-logs (much fewer knots, smaller, and almost exclusively dead) – both providing some insight in how different training material affect the grading outcome.
Using machine learning for automatic sorting of kiln-dried sawn timber requires not only a data set with a large number of observations to train an accurate grading model on but also a high-quality dataset, i.e. a dataset with a high correlation between the automatically measured variables of the sawn timber and the assigned quality grade of every single piece of sawn timber.
This study focuses on understanding how different aspects of a training set affects the grading outcome of automatic sorting of kiln-dried sawn timber using multivariate PLS regression. More specifically, the aspects of class-imbalance and class-overlap. In the context of sorting sawn timber using machine-learning techniques, the aspect of class-imbalance means to use a dataset with two or more classes of sawn timber that are not equal in numbers. Uneven distribution of classes is the typical case of most sawing batches due to the way the grading standards used at the sawmill defines classes (Swedish Sawmill Managers Association Citation1994). The aspect of class-overlap means how closely related observations of different classes are by a set of measurements. A high class-overlap is the typical case of most sawing batches as the grading standards used separates classes by limits, e.g. ‘maximum number of dead knots’. Using limits to separate between classes means two observations of different classes could possibly be distinguished only by a single knot, and since a large number of features can be used to describe a piece of sawn timber, the class-overlap is considerable. The class-overlap and class-balance aspects of classification problems are well known in the machine learning literature where Prati et al. (Citation2004) explain these two aspects for synthetic data sets, using a k-nearest-neighbours approach.
Prati et al. (Citation2004) showed that the problems of class-imbalance or class-overlap when training a machine-learning model is not the only obstacle for applying machine-learning algorithms to real-world problems, but rather the combination of the two. In the works by Olofsson et al. (Citation2019b, Citation2019c) the problems of class-imbalance and class-overlap was implicitly shown but neither highlighted nor appropriately discussed. The present study investigated how class-balance and class-overlap affect the training of a PLS grading model by testing different training scenarios. By using different training data with different properties, the performance of the PLS grading model is expected to change. Therefore, the present study compared different PLS models based on the same data, but with a different number of class-members and with different amount of class-overlap, and how this changes the grading accuracy and grading outcome.
The investigation of class-balance and class-overlap was performed with two different reference grades of the training material. (1) Like in the earlier cited works, the sawn-timber grade was assigned by a product manufacturer assessing the split, milled, and planed finished wall panel product produced by each piece of sawn timber. (2) The same product manufacturer graded images of each piece of sawn timber to assess their suitability for the intended product. The reasoning for investigating the second image-grade reference is that such training data is much easier and cheaper to acquire compared to having to process and grade large batches of unsorted sawn timber by a customer. Testing the effect of class-balance and class-overlap using these two different grading references for training may show if the subjective image-grade reference performs differently than the more objective product-grade reference.
2. Material and method
The implementation of PLS Discriminant Analysis in the present study followed the methodology applied by Olofsson et al. (Citation2019b), where an almost identical implementation was presented in more detail. The study was executed in cooperation with Kåge Sawmill (Norra Timber) and Lundgren's planing mill, both located in northern Sweden. Since the available training data for this study was limited by the number of images graded by the customer, the only way to manipulate the different aspects of the training data was by removing observations. Since it is always desirable of a grading model to perform as accurately as possible, one should carefully consider the effect of removing training data before actual implementation. Furthermore, the specific implementation of PLS regression in this study makes the data unsuitable for re-sampling techniques, such as the well-known and otherwise useful SMOTE algorithm (Chawla et al. Citation2002). Other implementations of machine-learning techniques for automatic grading of sawn timber could benefit from such techniques.
2.1. Reference grades of the material
Three data sets from earlier studies were used (Olofsson et al. Citation2019b, Citation2019c, Citation2019a), consisting of nearly 300 Scots pine (Pinus sylvestris L.) planks each, for a total of 846 planks. All planks were cant-sawn from top logs or middle logs to the dimensions and the target moisture content after drying was 14%. The planks had a length between 3.6 m and 5.4 m at the dry-sorting station where cameras automatically scanned the planks. No distinction was made between the data sets used in this paper. Sample images can be seen in in Olofsson et al. (Citation2019c).
The quality grade of each plank was determined in two ways. (1) The planks were delivered to Lundgren's planing mill where each plank was split into three boards (); each milled, planed, and manually graded as an accepted or rejected piece of wall panel. The resulting grade of each plank was the majority of the produced three pieces of boards, meaning a plank that produced two accepted and one rejected board would be given the grade A, meaning accepted, or vice versa the grade B, meaning rejected. This A or B grade of each plank was called the ‘product-grade’. (2) Images of all plank faces of a sub-set of 251 planks, extracted from the automatic grading system at the sawmill's dry-sorting station, were presented to the quality expert at Lundgren's planing mill. The quality expert was instructed to only consider knot features when asked to try and predict if each plank would produce a majority of A quality boards, and in that case give that plank the grade A, and vice versa for grade B. This A or B grade was called the ‘image-grade’. The quality expert graded the images of each plank with grade A or grade B, and also labelled 64 planks as ‘not-clearly’, meaning each plank was labelled with one of four labels: A, not-clearly A, not-clearly B, or B.
The focus of this study was to study different aspects of the training data when using a PLS regression model to grade sawn timber automatically. To be as consistent as possible when selecting training data for the comparison between models trained using the product-grade reference and the image-grade reference, the sub-set of 251 planks with both a product-grade reference and an image-grade reference was used as the so-called ‘baseline’ dataset for training. The outcome of the two grading processes of the baseline training set is presented in .
Table 1. Results of the product-grade reference and image-grade reference of the baseline training data set consisting of 251 planks.
The remaining 595 planks, not part of the baseline training set, with only a product-grade, were used as a large test set for all tests. The grading accuracy of any model is how accurately it grades the test set to match the product grade reference, consisting of 386 planks of grade A and 209 planks of grade B.
2.2. PLS-DA implementation
Each plank was associated with a set of aggregated feature-variables regarding knots and a binary quality grade. At the sawmill's dry-sorting station, an automatic scanning and grading system by FinScan, called Boardmaster (Anon Citation2018), was used for detection of plank features (knots). The knots were classified as, e.g. sound or dead, and their size and position were determined. These measurements were used to create a set of 3564 aggregated variables, described like ‘The total number of sounds knots on the inner face side of the plank’ (Olofsson et al. Citation2019b). These variables were created for each plank and stored as an -matrix.
The product-grade and image-grade data were stored as two binary response -vectors. Using the plank features stored in
, and the plank grade in
(product grade and image grade separately), the SIMCA 14 software (Anon Citation2019) was used to correlate
and
of a training set, using multivariate Partial Least Squares Discriminant Analysis (PLS-DA). Only one PLS-component was used to separate between the two grades in all tests as using two PLS-components showed signs of overfitting the training data. The trained model was then used to predict the grade of the test set.
2.3. Training and testing procedure
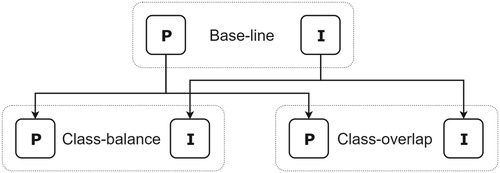
The baseline training set shown in was used to train two PLS models, one using the product-grade reference and one using the image-grade reference (). Once the baseline grading outcome was established, planks were removed from the baseline training dataset to change the class-overlap and class-balance aspects of the training data. For each of the new training scenarios, two new models were created for a total of six models. All trained models were used to predict the product-grade of the test set, i.e. the models trained on the image-grade were also used to predict the product-grade.
Figure 1. Flow-chart showing the different training scenarios and prediction models. Solid boxes represent models trained on the product-grade (P) or the image-grade (I), respectively. Dotted boxes show the different training scenarios where the two models are compared with the baseline training scenario.
In order to be able to attribute the changes in the grading outcome, or lack thereof, to the changes in the training set in each training scenario, each model's class-separating threshold was calibrated to achieve a specific grading outcome (see Olofsson et al. Citation2019b for further details regarding the class-separating threshold). The grading outcome was controlled such that each grading model forcefully achieved the proportions of grade A and grade B planks of the test set; the test consisting of 595 planks had a ratio of grade A and grade B planks of 2:1 and the class-separating threshold was calibrated such that each model graded grade A and B planks in a 2:1 ratio. Furthermore, any grading errors made by the models will be evenly distributed between false-negatives and false-positives for a simpler comparison.
2.3.1. Class-overlap
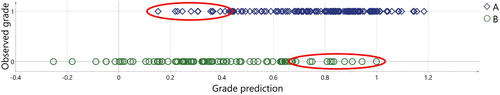
Since the class-overlap aspect of the training data is different for the product-grade and image-grade references, the class-overlap aspect was manipulated separately for each reference. (1) For the image-grade reference, the decision of which planks to remove was made based on the image-grading performed by the quality expert at Lundgren's planing mill. To reduce the class-overlap (make the classes more distinct) of the training set, the 64 planks labelled ‘not-clearly’ in were removed. (2) For the product-grade reference, the product-grade trained model from the baseline scenario was used to produce an observed-predicted plot of the baseline training data (predicting the data it was trained on), shown in . The encircled observations in had a low correlation between their variables in and product-grade in
since the model did not accurately capture their grade. To reduce the class-overlap of the training data, 64 observations like the encircled ones were removed in order of lowest correlation (left to right for grade A planks, and right to left for grade B).
Figure 2. The observed-predicted plot of the baseline training data, using the model trained on the baseline training data with the product-grade reference. The upper observations (1) represents grade A, and the lower (0) represents grade B. The y-axis shows the grade of each plank as the actual binary grade, and the x-axis shows the continuous grade predicted by the model. The encircled observations have a weak correlation between their measured features and their assigned grade, i.e. an observation in the bottom right looks to the model as, and would have been predicted as, a plank of grade A (1) while the product-grade was grade B (0).
Once 64 planks were removed from each reference-grade for the class-balance training scenario, two new models were trained on the remaining 187 planks, using the product-grade and the image-grade respectively. Note that different planks were removed for the training of each of the two models in this scenario, but the same number of planks were removed each time such that differently sized training sets do not influence the comparison of these two models, but only the difference of the class-balance aspect. Out of the removed 64 planks, 25 planks (36%) were removed from both reference grades while 39 unique planks (64%) were removed in each case.
2.3.2. Class-balance
For the training scenario where class-balance was investigated, the number of planks in the training set of each reference-grade was reduced to the largest possible number of observations that resulted in an equal number of grade A planks and grade B planks. For the product-grade reference, 63 planks were removed from the baseline training set, and the remaining 188 planks consisted of 94 planks of each grade. For the image-grade reference, 87 planks were removed, and the remaining 164 planks consisted of 82 planks of each grade.
3. Results
To investigate the effect of the class-balance and class-overlap aspects of training data on the grading outcome relative to a baseline training scenario, using two different reference grades for training, six multivariate PLS-DA models were trained. The grading outcome of the same test set of each of the six models is shown in .
Table 2. Misclassification tables for the three training scenarios: baseline, class-overlap, and class-balance.
For further comparison of the grading outcome for different training scenarios, the grading agreement between the different models, i.e. the proportion of individual planks in the test set that was graded the same by two models, is presented in .
Table 3. Grading agreement of all models, showing the proportion of the test set graded identically by two models measured in percent (%). The headers show the training scenario and the two corresponding models of that scenario, trained on the reference product-grade (P) and image-grade (I), respectively.
4. Discussion
The baseline training scenario ((a)) showed that the product-grade reference and image-grade reference resulted in the same grading accuracy, i.e. 76%. The two baseline models predicted the test set with an 88% agreement (). No qualitative investigation was made to investigate if any systematic difference could be detected. The reason for the higher grading accuracy of grade A planks for both models is partly due to the moderately overrepresented number of grade A planks in the training set, resulting in a slightly biased model with a higher grading accuracy for grade A planks. Furthermore, the higher grading accuracy of grade A planks can be attributed to the more homogeneous nature of grade A planks, as they are specifically graded for a wall panelling product for which a homogeneous knot-pattern is preferred, whereas grade B planks are much more heterogeneous in their knot-pattern. The similar total grading accuracy is strong evidence that a grading model using an image-based grading reference for training would perform as good as a model trained on the product-grade reference – which is much more tedious and costly to acquire due to having to process the training data into a finished product before reference grading.
The class-overlap training scenario ((b)), where training observations were removed to increase the separation between the classes showed that the model trained on an image-grade reference retained a grading accuracy of 76%, and 96% of the test set was predicted identically as the corresponding baseline model (). This result implies that the 64 ‘not-clearly’ labelled observations in that was removed contributed very little to the model. For future studies using a similar image-grade reference this shows that if a quality-expert is not sure about the desirability of a specific plank, that plank might as well be removed from the experiment entirely, as it will probably not contribute much to a grading model. Future studies might also want to design the image-grading process in such a way that large quantities of distinct grade A and grade B planks can be processed efficiently, e.g. using images of automatically pre-sorted planks.
The model trained on the product-grade reference in the class-overlap training scenario surprisingly suffered a loss of 4% points of total grading accuracy, as the 64 observations that were removed, shown in , were considered to be directly misleading during the training of the model. However, it is reasonable to assume that the objective nature of the product-grade reference contributes more to the grading performance of the model, however weak, than the observation labelled ‘not-clearly’ did for the image-grade reference trained model. Hence the results indicate that the more objective product-grading reference does not benefit from a smaller class-overlap at the cost of removing observations for training – at least not for this data set.
For the class-balance training scenario, both models performed again very similarly in terms of grading performance (), and 87% of the test set observations were predicted the same by both models (). Both models had a total grading accuracy of 74%, down from 76%. These results show that the performance of the baseline models is not hindered by an over-representation of grade A planks in the training set and that removing observations to achieve a class-balanced training set lowers the grading accuracy of the model in this study. The lower grading accuracy is assumed to be because of the smaller training set. Ideally, the training set should consist of an equal number of observations from each grade to remove any bias introduced when training on a class-imbalanced training set. However, due to the natural distribution of grade A and grade B observations found in the raw-material (2:1 ratio), and since removing grade A observations to achieve a class-balanced training set reduced the grading accuracy, the remaining alternative is to generate more observations of grade B artificially. However, due to the way the aggregated knot-feature variables were created, and due to their large number, using re-sampling techniques, like the SMOTE algorithm (Chawla et al. Citation2002), was considered to be unsuitable for this study. Future studies could instead try to simulate sawn timber from which the aggregated variables were created.
Overrepresentation of a class in a training set leads typically to a bias in the model that predicts the overrepresented class member more often than the underrepresented class (seen in the results in this study and in Olofsson et al. (Citation2019b, Citation2019c, Citation2019a)). However, in the context of dry-sorting sawn timber, this is sometimes desirable since the unbalanced nature of the training set is usually reoccurring in the test set. Another reason for the lower grading accuracy of grade B planks than grade A planks is their more heterogeneous knot-pattern. Furthermore, the problem of class-balance was determined to be moderate in this study and the related cited works. In this study, the entire data available had roughly a 2:1 ratio of grade A planks to grade B planks according to the product-grade, in comparison to, e.g. medical studies dealing with cancer patients of a population with a vastly disproportionate number of healthy and sick subjects. For futures studies, these results show that the class-imbalance problem can be solved by changing the class-separating threshold, rather than sacrificing grading accuracy by removing training observation to achieve a class-balanced training set.
5. Conclusions
When training a PLS model for automatic grading of kiln-dried sawn timber for a customer's product, this study indicates that when using the objective product-grade reference, i.e. the product grade outcome of each piece of sawn timber, training on all available data will give the highest grading accuracy (76% correctly graded pieces of sawn timber). Removing observations from the training set to achieve a training set with less class-overlap, or a class-balanced training set, did not improve the grading accuracy (72% and 74%, respectively). When using the subjective image-grade reference for training, i.e. the grade given by the customer to images of each piece of sawn timber, removing training data to achieve a class-balanced training set did not improve the grading accuracy (74%). The results regarding class-balance indicate that the common problem of training machine-learning models on a class-imbalanced training set does not seem to be a problem in the context of dry-sorting sawn timber, as the class-imbalance of such data sets is only moderate, i.e. roughly 2:1 in this study.
Using the image-grade reference, training on all data achieved the same grading accuracy (76%) as the corresponding model trained with the product-grade reference. This shows that a product-adapted grading model could be trained using images extracted from the dry-sorting station of a sawmill, instead of having to process the training data into a split, milled, and planed product. Removing observations of the image-grade reference data, for which the customer had difficulty in determining the grade, in reducing the class-overlap retained the grading accuracy (76%). This retention in grading accuracy showed that there are benefits to be had with a more carefully structured image-grading procedure, as the removed training data had a net-zero effect on grading accuracy, i.e. a waste of time for the customer.
Acknowledgments
Financial support from the Swedish Innovation Agency (Vinnova), project Sawmill 4.0 – Customised flexible sawmill production by integrating data-driven models and decisions tools 2018-02749, is gratefully acknowledged. The authors also gratefully acknowledge the support of the CT-Wood – a centre of excellence at Luleå University of Technology for the development of X-ray computed tomography applications for use in the forest products industry.
Disclosure statement
No potential conflict of interest was reported by the author(s).
Additional information
Funding
References
- Anon (2018) Boardmaster. Accessed 12 June 2018, available at: https://finscan.fi/products/boardmaster/?lang=en. Note: Older predecessor to BoardmasterNOVA.
- Anon (2019) Simca. Accessed 3 January 2019, available at: https://umetrics.com/products/simca.
- Berglund, A., Broman, O., Oja, J. and Grönlund, A. (2015) Customer adapted grading of scots pine sawn timber using a multivariate method. Scandinavian Journal of Forest Research, 30(1), 87–97. doi: 10.1080/02827581.2014.968359
- Breinig, L., Leonhart, R., Broman, O., Manuel, A., Brüchert, F. and Becker, G. (2015) Classification of wood surfaces according to visual appearance by multivariate analysis of wood feature data. Journal of Wood Science, 61(2), 89–112. doi: 10.1007/s10086-014-1410-6
- Broman, O. (2000) Means to measure the aesthetic properties of wood. PhD thesis, Luleå University of Technology.
- Chawla, N. V., Bowyer, K. W., Hall, L. O. and Kegelmeyer, W. P. (2002) SMOTE: Synthetic minority over-sampling technique. Journal of Artificial Intelligence Research, 16, 321–357. doi: 10.1613/jair.953
- Geladi, P. and Kowalski, B. R. (1986) Partial least-squares regression: A tutorial. Analytica Chimica Acta, 185, 1–17. doi: 10.1016/0003-2670(86)80028-9
- Lycken, A. and Oja, J. (2006) A multivariate approach to automatic grading of pinus sylvestirs sawn timber. Scandinavian Journal of Forest Research, 21(2), 167–174. doi: 10.1080/02827580600642050
- Olofsson, L., Broman, O., Fredriksson, M., Skog, J. and Sandberg, D. (2017) Customer adapted grading of scots pine sawn timber – a multivariate method approach. Proceedings of International Wood Machining Seminar, 23(1), 360–371.
- Olofsson, L., Broman, O. and Sandberg, D. (2019a) Holistic-subjective automatic grading of sawn timber: Sensitivity to systematic changes. In IWMS 24. August 25–30, 2019, Corvallis, Oregon, USA, pp. 154–167. Oregon State University (OSU).
- Olofsson, L., Broman, O., Skog, J., Fredriksson, M. and Sandberg, D. (2019b) Multivariate product adapted grading of scots pine sawn timber for an industrial customer, part 1: Method development. Wood Material Science & Engineering, 14(6), 428–436.
- Olofsson, L., Broman, O., Skog, J., Fredriksson, M. and Sandberg, D. (2019c) Multivariate product adapted grading of scots pine sawn timber for an industrial customer, part 2: Robustness to disturbances. Wood Material Science & Engineering, 14(6), 420–427.
- Prati, R. C., Batista, G. E. and Monard, M. C. (2004) Class imbalances versus class overlapping: An analysis of a learning system behavior. In Mexican International Conference on Artificial Intelligence, pp. 312–321. Springer.
- Swedish Sawmill Managers Association (1994) Nordic Timber: Grading Rules for Pine (Pinus Sylvestris) and Spruce (Picea Abies) Sawn Timber: Comercial Grading Based on Evaluation of the Four Sides of Sawn Timber (Markaryd: Föreningen Svenska Sågverksmän).
- Wold, S., Sjöström, M. and Eriksson, L. (2001) PLS-regression: A basic tool of chemometrics. Chemometrics and Intelligent Laboratory Systems, 58, 109–130. doi: 10.1016/S0169-7439(01)00155-1