
ABSTRACT
The scope of this article is a longitudinal strategic group study with a special focus on the strategic group-performance relationship. The empirical context is the Swedish Furniture Industry, a very heterogeneous industry well suited for this type of “middle-ground study” between industry and firm levels. The research questions are finding suitable strategic dimensions to use when in a next step splitting up into different strategic groups followed by an analysis of the strategic group-performance relationship. Finally, an explanatory approach is taken with the purpose of increasing our understanding of performance differences between strategic groups. The empirical investigation is a total population study of 143 companies (micro companies excluded) and the period of analysis is 2004 up to 2017. Empirical data consist of yearly income statements, public statistics, results from two questionnaires and multiple (firm) case descriptions. The explanatory part is of a qualitative nature and points out the major differences between the strategic groups regarding environmental forces and competitive advantage. Nine strategic groups are identified and stable performance differences between groups are noted which are mainly related to different demand conditions between three customer sectors – household, institutional and B2B – but also to the mix of micro product/customer segments within these sectors.
Introduction
Studies of the strategy-performance relationship (Cool and Schendel Citation1987, Leask and Parker Citation2006) have for decades been at the forefront of several theoretical perspectives, not least within the schools of Industrial Organization and Strategic Management. Industrial Organization (IO) with its Structure-Conduct-Performance-paradigm takes an industry perspective (Bain Citation1959, Scherer Citation1970) while Strategic Management (SM) with its focus upon strategic planning and strategic behavior (resource deployment) of individual firms primarily takes a firm-level perspective (Hatten Citation1974, Cool Citation1985). The IO perspective has as a potential shortcoming to overlook the heterogeneity between firms and, along the same logic, the SM perspective risks overlooking homogeneity and collective actions of individual firms. To analytically overcome this problem, the two theoretical streams meet at the so-called strategic group-level (SG-level; Hunt Citation1972), with the difference that they reach there coming from “opposite” positions – IO through a break-down from the industry level and SM through an aggregation from the firm-level (Leask and Parker Citation2006).
Despite choice of theoretical perspective, the existence of a significant and stable strategy performance-relationship at the SG-level is not so easily scientifically proven. The results aggregated from large amounts of studies are inconclusive – some point out that significant and over time stable differences in performance exist between different SGs and some draw the conclusion that there are no such differences (for overviews see McGee Citation2003, Leask and Parker Citation2006). Regardless of the inconclusiveness in that respect, the SG- approach has other advantages which among others lie in the analytical strength of the group perspective, where SGs are identified from either quantitative or qualitative clustering processes along important strategic dimensions. Also, the notion of “cognitive strategic groups”, where management from firms within the same SG share similar mental maps, is important for increased understanding of strategic behavior within and between industries (Reger and Huff Citation1992, Peteraf and Shanley Citation1997).
Aim of the article
The overall aim of this article is to conduct an SG-analysis of the Swedish Furniture Industry (SFI), basically through a SM-inspired bottom-up approach. Choosing the SFI as an empirical context has at least three motivations. The first motivation is of general character, Desarbo et al. (Citation2009) state that there is a lack of longitudinal SG-studies covering longer time-periods. Second, there are very few broad studies of the furniture industry, which explicitly use an SG-approach. So far, we have only been able to identify two studies. This study stands out compared to these other two with a broader definition of scope of furniture industry and, also different strategic dimensions demarcating the strategic groups. Third, from an empirical/practical perspective, the SFI could be looked upon as a “traditional exporting SME-based industry”, which is an important target group for government policy interventions and, increasingly, for risk capitalists and institutional capital looking for opportunities for international growth and consolidation (Brege et al. Citation2004, Nord and Brege Citation2014). Both for policy and investment reasons there is need for more detailed studies below the industry-level, especially since the SFI is a very heterogeneous industry.
The overall aim of the study can be broken down into four research questions:
What strategic dimensions are most analytically appropriate to use when forming SGs in the SFI context?
What SGs are formed as a result of (a qualitative) clustering along the strategic dimensions?
Are there any performance-differences between the SGs?
What major environmental driving forces combined with the strengths of SG-specific competitive advantages are (tentatively) explaining performance differences between groups?
Strategic groups – a theoretical framing
The concept of SGs was introduced within the IO Structure-Conduct-Performance paradigm to mirror a more complex picture of an industry (Hunt Citation1972). The SCP-paradigm, with its roots in anti-trust legislation, expresses a deterministic view that market conduct (e.g. pricing behavior, product strategy and advertising, research and innovation, plant investments and legal tactics) and in the end performance (e.g. production and allocation efficiency, progress, full employment and equity) are driven by market structure, which in turn is driven by so called basic conditions connected to industry specific characteristics of supply and demand (such as demand growth, price elasticity and technology level). Major dimensions of market structure are number of sellers and buyers, product differentiation, barriers to entry, cost structures, degree of vertical integration and diversification. Scherer and Ross (Citation1990) present an extended SCP-model were public policy (e.g. taxes and subsidies, international trade rules, regulation, price controls, antitrust and information provision) is included, and directly affects both market structure and market conduct and more indirectly market performance.
As commented upon in the introduction of this article, the SG-level represents a “middle-ground” (Porter Citation1980) between industry and firm levels, and the membership of a specific SG determines the performance potential of an individual firm (predictive power). This deterministic view is, hereby, transferred from industry to SG-level. In terms of Porter’s five forces model, depending on where within an industry a SG is positioned, the competitive forces (Porter Citation1980) have different influences and there are mobility barriers to moving from one SG to another, for instance due to different kinds of specialization and economies of scale, which create mobility barriers when changing strategy. Cool and Schendel (Citation1987) see mobility barriers as “structural forces impeding firms from freely changing their competitive positions”.
According to Hunt (Citation1972) and later Porter (Citation1980), members of a SG implement strategies that are similar along specific strategic dimensions – in the case of Hunt these dimensions are cost structures, degree of vertical integration, degree of product differentiation, formal organizations and control and reward systems. Porter (Citation1980) mentions an even broader spectrum of strategic dimensions framing a competitive strategy, for example specialization, brand identification, push versus pull (in demand) and channel selection. Strategic dimensions chosen among researchers with an IO-perspective are most often retrieved among the major dimensions of market structure and market conduct (e.g. Porter Citation1979, Oster Citation1982). Other researchers use Porter’s generic strategies – different subdimensions of cost leadership, differentiation and focus strategies – as one overall strategic dimension (e.g. Dess and Davies Citation1984, Shah Citation2007, Wan and Bullard Citation2008). Over time a criticism was spread among IO-researchers that a overly simplified break-down of an industry into SGs along one or two strategic dimensions was too superficial and was underestimating the need to reach a deeper understanding of industry-specific circumstances (McGee Citation2003).
Within strategic management (SM), in comparison with the IO-paradigm, there is a somewhat different interpretation of the SG concept. Leask and Parker (Citation2006) refer to what they call the Purdue School of strategic management, represented by e.g. Hatten (Citation1974) and Cool (Citation1985). The process of forming a strategic group is “the opposite”; instead of breaking down an industry into SGs as in the case of IO, the formation process aggregates individual firms with similar strategies into groups. This approach demands more detailed information at the firm-level, to strive for a more holistic knowledge of the strategies of individual firms (or at least analytically broken down into a larger number of sub-dimensions), instead of choosing a few strategic dimensions and using them to split the total population into groups. However, the choice of strategic dimensions leading the aggregation into strategic groups is mostly the same as the IO-inspired breakdown from the industry level (and it could sometimes be hard to classify for instance a Porter-inspired analysis as either IO- or SM- centered).
There is one important exception from this statement, and that is, when forming so called “cognitive strategic groups” (Reger and Huff Citation1992, McNamara et al. Citation2003) researchers are using somewhat different concepts such as “strategic group identity” (Peteraf and Shanley Citation1997), “strategic recipes” (Desarbo and Grewal Citation2008) or “strategic group configurations”, picturing how mangers “mentally attach” to different SGs (identification, disidentification or ambivalent identification; Anand et al. Citation2013). Further, depending on different theoretical framings, SM- and IO -perspectives could come up with different arguments regarding the existence of performance differences between SGs and the existence of mobility barriers. Another difference is that (early) IO-inspired studies often were inter-industry studies, using only one or a few strategic dimensions when clustering into SGs, whereas the SM approach almost always have resulted in intra-industry studies (Leask and Parker Citation2006).
Further research also shows that SGs can overlap, with a kind of hybrid SGs being formed at the intersections (Desarbo and Grewal Citation2008) as a mix between two strategies. Within a SG, core firms may stick determinedly to a specific strategy while secondary firms might be less strategically focused. There are also transient firms, which switch between strategic groups (McNamara et al. Citation2003). Also, the dynamics of SGs have been in focus ever since the 80ies, looking at different time-periods of stability (when significant differences between strategic groups are expected; cf. Fiegenbaum et al. Citation1987) and when different SGs develop in dynamic processes (Desarbo et al. Citation2009).
SG-research experienced an early peak during the 70s and the 80s (McGee Citation2003, Leask and Parker Citation2006, Leask Citation2007). The obstacle in the following downturn, was the growing dominance of the Resource Based View (RBV) as the leading view concerning what factors build a competitive advantage (Wernerfelt Citation1984, Barney Citation1991, Teece et al. Citation1997). This movement dates from the early 90ies and its dominance was reached primarily at the expense of the traditional IO- and Porter-inspired competitive advantage perspectives (competitive advantage from an outside-in perspective) And this has also caused the SG-perspective to lose influence (cf. Thomas and Pollock Citation1999, McGee Citation2003). For instance, Barney and Hoskinson (Citation1990) argue that SGs don’t exist “in reality” but rather are “artefacts of method” (when using cluster analyses you always come up with a split into different groups). However, Leask (Citation2007) and others argue that there is still “theoretical relevance” in the SG-approach and when looking at research during the last decade the cognitive SG-perspective still seems prevalent (e.g. Anand et al. Citation2013, Sonenshein et al. Citation2017, Cabral et al. Citation2020b), there are additional SG-studies of specific industry contexts (e.g. Periera-Moliner et al. Citation2001, ZIaie et al. Citation2011, Bonetti and Schiavone Citation2015) and also there seems to be an increasing interest in the SG approach related to SME internationalization (e.g. Mas-Ruiz et al. Citation2018, Cabral et al. Citation2020a, Citation2020b).
Strategic group research with the furniture industry as empirical context
Strategic group research with a focus on specific industries have been numerous over time, including home-appliances (Hunt Citation1972), pharmaceuticals (Cool and Schendel Citation1987, Leask and Parker Citation2006), banking (Reger and Huff Citation1992, McNamara et al. Citation2003), telecom (Chen and Chang Citation2009, Chen and Su Citation2014), and tourism/hotels (Claver-Cortiz et al. Citation2009).
When looking at the furniture industry, two studies stand out, those of Wan and Bullard (Citation2008, Citation2009) and Ziaie et al. (Citation2011). Both studies have very similar theoretical and methodological framings, building upon Porter’s generic strategies when identifying strategic dimensions (orientations) and Porter’s five-forces model relating business environment to SG-competitive strategy as well as using a similar sequence of multivariate analysis methods and questionnaires through the process of identifying strategic dimension, forming SGs and finding explanations to performance differences among SGs. Their results are both similar and different. What is similar is that, when forming SGs both studies come up with a majority of SGs implementing mixed generic strategies (all groups in Wan and Bullard Citation2008, Citation2009) and in the next step pinpointing internal rivalry as the most important competitive force driving performance. Differences appear when relating different SGs to performance – Wan and Bullard are unable to show any significant differences, while Ziaie et al. (Citation2011) show that differentiation strategies perform better than cost-efficiency strategies and in addition they point out that firms within the Malaysian furniture industry that lack definite strategic orientation (mixed strategies) really risk “getting stuck in the middle” and showing very weak performance figures.
A number of studies with their empirical contextual basis in different national and international furniture industry contexts point out specific strategies, in addition to competitive strategies as mentioned above, which could be suitable to use as strategic dimensions. Examples of such strategies are: Innovation (Bullard and West Citation2002, Cao and Hansen Citation2006, Wan and Bullard Citation2008, Boon-Kwee and Thiruchelvam Citation2011), outsourcing/ offshoring/internationalization (Drayse Citation2011, Buehlmann and Schuler Citation2013, Packasalo et al. Citation2013, Lin et al. Citation2019), mass-customization (Lihra et al. Citation2008, Citation2012, Buelman and Schuler Citation2009), design and brand name (Dell Era Citation2010, Lanbuschagne et al. Citation2012, Lindahl Citation2013, Lee Citation2014), network strategies, strategic alliances and industrial clusters (Kantonen Citation1998, Lojaconi and Lorenzen Citation1998, Bullard and West Citation2002, Elmhester and Brege Citation2011, Hongquang et al. Citation2012), distribution channel strategy (Lin et al. Citation2019, Kim Citation2018) and circular economy strategies (DeMarchi et al. Citation2013, Massote and Santi Citation2013, Branlio-Gonzalo and Boeva Citation2020, Susanti et al. Citation2020).
Materials and methods
Design of the study and data material
The design of the study is a mix of a quantitative longitudinal study of a database including all furniture firms in the SFI, two industry-wide surveys on product-market strategy and competitive advantage, and a qualitative multiple case-study of individual firms with focus upon strategic behavior and environmental changes (also with a longitudinal perspective).
The longitudinal database study represents a total population study of all firms within the SFI with ten or more employees (so-called micro firms are excluded). In all, the population has 143 firms. The empirical core of data collection consists of firm annual reports for the period 2004–2017. This comparatively long time-period was chosen to cover more than one cycle in the overall international business cycle, and during this specific time-period an initial upturn was broken by the financial crisis of 2008/09 and the drawn-out upturn thereafter continued until the end of the period. The time-period in focus covers a very dramatic period of macro-economic development.
Over the years, the database has been refined on several occasions. The starting point was the total number of firms that were classified as furniture firms in official statistics. In a next step this list of firms was compared with firms listed in the membership directories of the Swedish Federation of Wood and Furniture Industry and Swedish Wood. In addition, studies of annual reports and websites of individual firms (a few of them classified as not being furniture firms and not being a member of any of the two industry organizations) have in some cases been crucial for the decision to include a firm into the population or not. And also, there are some firms classified as furniture firms (mostly sub-suppliers), which have their main businesses within other industries. Therefore, a deep knowledge down to individual firm level is needed, in order to keep an accurate and updated database.
During this time-period (and actually starting a couple of years before), research within the SFI context was conducted and presented, both cross-sectional surveys (two studies in 2001 and 2014; Brege et al. Citation2001, Nord and Brege Citation2014) and case studies (a total of 14 company case studies published during 2001–2013; Brege et al. Citation2001, Andersson Citation2005, Elmhester (Citation2008), Brege (ed.) Citation2009, Lindahl Citation2013, Nord and Brege Citation2014). Especially, the first survey and the early case studies have brought the broader understanding that was needed for the qualitatively oriented analysis of the different SGs and especially their differences in terms of exposure to different environmental segments, strategic behavior, and performance. In addition, from time to time there have been contacts with management of leading “key companies” regarding important strategic issues.
Our study of SGs is, as mentioned above, a total population study. Therefore, when interpreting the results and especially the differences between the SGs in terms of performance, the question of significance does not need to be brought up (Aaker et al. Citation1995). In this kind of total population study, the differences are “significant”. When taking the analysis to an explanatory level – trying to, at least tentatively, explain performance differences between SGs – methodological triangulation has been used, combining quantitative and qualitative data and taking data from different sources – case studies, surveys, annual reports, public statistics and other secondary data covering different kinds of industry analyses (cf. Bryman and Bell Citation1995).
Selection of strategic dimensions and performance variables
When looking at literature, there are numerous SG-studies that have used different strategic dimensions and, also, different performance key figures. The differences can partly be explained by theoretical perspective but mostly it has been a question of what dimensions that are crucial for each specific industrial context. Therefore, the choice of dimensions demands deep knowledge of the specific industry (Flavian et al. Citation1999, Leask and Parker Citation2006) and the final choice among “theoretically suitable” dimensions should be driven by the empirical context (a normative recommendation in literature). One other conclusion regarding choice of performance-variables among these studies, which according to both IO and SM theory should be well-connected to profitability (primarily in terms of return on total capital, ROA) and (relative) market share, is that these choices also have been determined by what performance figures that are available within and among industries.
Choice of strategic dimensions, according to Cool and Schendel (Citation1987) should mirror strategic decision regarding scope and resource commitments and that different SGs show different combinations of these commitments. In this study, the scope-variable has been most prominent – both regarding customer categories, products/offerings and major aspects of competitive advantage and with different choices of scope commitment come somewhat different commitments within the resource base.
The formation of strategic groups
Going to literature, the methods of forming SGs, the quantitative approach using different kinds of multi-variate methods is strongly dominant. The quantitative approach starts with measuring several dimensions and sub-dimensions (such as sets of indicators of each one of Porter’s five competitive forces and three generic strategies). This procedure is often done via a questionnaire. In a second step a factor analysis is applied, selecting factors which can be interpreted as strategic dimensions. In a third step a cluster analysis is applied, forming clusters which are homogeneous within the group and heterogeneous towards other groups. However, the question remains of interpretation when theoretically transforming these clusters into SGs. The quantitative method is a statistically robust procedure, but with one weak spot and that is the interpretations of the factor and cluster analyses and if the factors really are realistic strategic dimension and the clusters are realistic SGs and “not solely an artifact of method” (Barney and Hoskinson Citation1990, Leask and Parker Citation2006). As a last step of analysis an exploratory approach is often found relating performance differences to environmental and in some cases also firm internal factors.
The qualitative approach is the “opposite”, starting with a more holistic approach instead of a rigorous break-down into dimensions and sub-dimensions, when deciding upon strategic dimensions and forming SGs. This process could either be sequential starting with dimension and then forming groups, but also in some cases intertwined in the sense that strategic dimension and SGs come out simultaneous from the same process. In this case different combinations of dimensions and groups are tested against each other.
The method used in this article is almost purely qualitative and too a large extent a simultaneous process when identifying strategic dimensions and forming SGs. However, it starts with quantitative data from the first survey, but the final choice of strategic dimensions is qualitatively based, as well as the formation of SGs. These choices of dimensions and groups have also been highly influenced by the mental maps and strategic thinking of managers. Priority has been given to striving for a high degree of congruence between the outcome of the qualitative method and the strategic thinking of managers. Also, the approach to (tentatively) explain performance differences between SGs is basically qualitative of nature (supported by some statistics).
Results and analysis
Research question 1: choice of strategic dimension and performance variables
The starting point for this SG-study came from the first survey (Brege et al. Citation2001) with its initial grouping of nine SGs based upon positioning along five dimensions: (1) Market (home furniture or institutional furniture; percentage of turnover), (2) Production technology (highly automated versus craftmanship, Likert-scale 1–5), (3) Position in the value chain (finished products vs components, percentage of turnover), (4) Competitive advantage, especially the importance of design (Likert-scale 1–5), and (5) Type of product. Based on these five strategic dimensions a formation of nine SGs took place.
When generalizing the results from the 2001 survey with a response rate of 47.9% to the entire population of firms (in our database) a few problems came up. The major problem was that of classification of those firms that had not been taking part in the survey. Without the “extra information” that could only be gathered through surveys or interviews they were difficult to position into the most appropriate SG. And a second problem was that a couple of SGs were too small and differed too little from the closest SGs in position. This resulted in a reduction of SGs from nine to seven and some rearrangements of firms between SGs within the institutional sector (identifying the three large office suppliers with very broad product lines as one specific SG). In addition, the demarcation lines round the SFI were broadened and two more SGs were introduced – the kitchen and bath interiors SG and the retail shops interiors SG.
The strategic dimensions were also modified and reduced to three major strategic dimensions:
Customer/End-user markets divided into three sectors - household, institutional and B2B (acting as sub-suppliers to other product- and interior-oriented furniture firms or furniture retail chains). These three customer sectors represent three different marketing models – B2C marketing through retail sales, B2B marketing of own products/interiors to professional actors as customers (and to a growing extent based upon tendering processes and moving more and more towards a dominance of project marketing) and B2B-sub-supplier marketing to (most of the time) more dominant customers.
Mix of products/interior offerings and (micro) customer segments (degree of specialization).
The major dimension forming competitive advantage – design, quality (and tradition) and cost-efficiency. When forming the SG of design firms, discussions with managers have been important, trying to look for consensus among peers of what firms that could be included in the group of “design firms”.
Research question 2: the formation of strategic groups
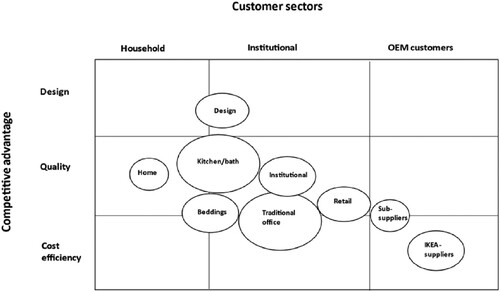
The outcome of the formation process along the three strategic dimension is nine SGs, which in are positioned along two dimensions – customer sectors and competitive advantage. The third dimension – type of product/interior offering towards specific customer segments is shown in the labeling of some of the SGs, but for other SGs there is a wide line of different products/interior offerings going to many different (micro) customer segments that are included.
Figure 1. Nine strategic groups with the SFI (the sizes of the bubbles represent total revenue in 2017 of the different SGs).
SG1: “traditional household furniture suppliers”
“Traditional household furniture suppliers”, where design furniture suppliers and bedding suppliers are excluded. This is the only SG that is (almost) entirely positioned within the household sector. The product line is mainly focused on furniture, and companies are product specialized – wooden tables and cabinets, upholstery furniture, wooden chairs, etc. (a sort of functional specialization). Strategic advantage and profiling mostly circle around quality, often in combination with tradition. Most furniture goes through retail chains, and the suppliers are struggling to make household furniture consumers aware of their brands (Brege et al. Citation2001, Brege (ed.) Citation2009). The strategic group is built up from smaller companies, with two exceptions (with turnover of more than SEK 100 million) (see and in Appendix 1).
Turnover in 2017 was SEK 1.2 billion, coming from 17 companies with a total of 490 employees. The average company turnover was SEK 67 million (median SEK 29 million) and the average number of employees was 29 (median 19 employees) (see and in Appendix 1).
SG2: “bedding suppliers”
“Bedding suppliers” are positioned in all three customer sectors - the household sector, institutional sector, and as sub-suppliers to OEM customers (in the latter case mostly mattresses, which largely go into retailer private brand offerings) (Brege et al. Citation2001, Brege (ed) Citation2009). This SG is built up of a handful of larger firms with international scope. In particular, one leading supplier has also been proactively leading the Swedish furniture producers and retailers to develop their brand recognition. Within the institutional sector, hotels form a large customer segment. In the Swedish market, the competition is characterized by a mix of premium brands promoting quality and low-to-mid-price brands.
Turnover in 2017 was SEK 2.5 billion, coming from seven companies with a total of 880 employees. The average company turnover was SEK 354 million (median SEK 241 million) and the average number of employees was 125 (median 122 employees) (see and in Appendix 1).
SG3: “design furniture suppliers”
“Design furniture suppliers”, with a major focus on the institutional sector customers and to, a minor degree, on the household sector. This SG is built up of smaller firms, except for a handful of larger firms. An estimate based upon information from firm websites and interviews is that around 80% of revenue comes from the institutional sector, and in particular the bigger design companies are increasingly focusing entirely on the institutional sector (Brege et al. Citation2001, Brege (ed) Citation2009, Lammhults Design Group Citation2017). The mobility barrier to other groups is design, which is expressed in both higher brand equity and brand recognition, which in turn is closely linked to the reputations of the designers represented in developing the product lines (Dell’Era et al. Citation2010, Lindahl Citation2013, Lammhults Design Group Citation2017).
Turnover in 2017 was SEK 1.6 billion, coming from 22 companies with a total of 760 employees. The average company turnover was SEK 72 million (median SEK 57 million) and the average number of employees was 33 (median 26 employees) (see and in Appendix 1).
SG4: “traditional large office interior suppliers”
“Traditional large office interior suppliers” is a group of three large suppliers which initially built their positions with broad product-lines within the (from the beginning highly expansive) office segment. They have now expanded their customer scope to include most of the institutional sector (retailing and kitchen/bathroom segments are among the exceptions). This SG has experienced serious structural problems (in the form of the paperless office and office landscapes that diminish demand potential and change the nature of demand in various ways) and has been forced into a strategic reorientation away from standardized, large-scale and cost-efficient production (Brege et al. Citation2001, Brege (ed) Citation2009, EFG Citation2017).
Turnover in 2017 was SEK 3.35 billion, coming from three companies with a total of 1800 employees. The average company turnover was SEK 1122 million (median SEK 713 million) and the average number of employees was 599 (median 251 employees) (see and in Appendix 1).
SG5: “institutional sector interior suppliers”
“Institutional sector interior suppliers” is the group with the broadest scope within the institutional sector. There is a further specialization among the firms focussing on narrower customer segments such as schools, libraries, laboratories etc. This SG is mainly challenging the three dominant office interior suppliers. Compared with the traditional large office interior suppliers, the firms within this SG are much smaller, more flexible and specialized toward niches (Brege et al. Citation2001, Brege (ed) Citation2009, Glimakra of Sweden Citation2017).
Turnover in 2017 was SEK 2.65 billion, coming from 29 companies with a total of 1290 employees. The average company turnover was SEK 89 million (median SEK 53 million) and the average number of employees was 44 (median 27 employees) (see and in Appendix 1).
SG6: “retail shop interior suppliers”
“Retail shop interior suppliers” are total interior solutions firms specializing in the retail sector. This SG is entirely positioned within the institutional sector. The SG is built up of comparatively large and specialized firms. The mobility barrier for institutional sector interior suppliers lies in the specialization towards this specific customer group, with specific customer demands (Nord and Brege Citation2014, ITAB Shop Concept Citation2017).
Turnover in 2017 was SEK 1.6 billion, coming from nine companies with a total of 640 employees. The average company turnover was SEK 179 million (median SEK 126 million) and the average number of employees was 71 (median 58 employees) (see and in Appendix 1).
SG7: “kitchen/bathroom interior suppliers”
“Kitchen/bathroom interior suppliers” are total interior solutions firms specializing in kitchen and bathroom interiors, within both the household and institutional sectors. Within the institutional sector, this is the only SG delivering to the construction industry (builders and building materials retailers). The mobility barrier to other SGs is specialization towards this specific product group. The suppliers have within the household sector integrated forward into retailing with their own stores or franchising (Nord and Brege Citation2014, Ballingslöv Citation2017).
Turnover in 2017 was SEK 5.55 billion, coming from 21 companies with a total of 2520 employees. The average company turnover was SEK 265 million (median SEK 75 million) and the average number of employees was 120 (median 36 employees) (see and in Appendix 1).
SG8: “IKEA suppliers”
“IKEA suppliers” have a strategic focus on large-scale and cost-efficient production for IKEA (“flat-pack” production) (Brege et al. Citation2001, Andersson Citation2005, Elmhester and Brege Citation2011). Within this SG, there is only one firm that is not almost entirely reliant on IKEA. The mobility barriers are cost efficiency and having a (more or less) trusting relationship with IKEA. Important factors behind cost efficiency when located in Sweden are a high degree of automation and a low proportion of labor costs in relation to total costs. Two of the firms (not owned by IKEA) have production in low-cost countries, delivering products worth almost SEK 1.5 billion to IKEA from these countries. Also, one of these firms is in the process of closing-down production in Sweden and transferring volumes to its factories abroad.
Turnover in 2017 was SEK 2.2 billion, coming from six companies with a total of 1390 employees. The average company turnover was SEK 368 million (median SEK 336 million) and the average number of employees was 128 (median 115 employees) (see and in Appendix 1).
SG9: “sub-suppliers”
“Sub-suppliers” deliver components (and to some extent private brand finished products) to the OEM furniture industry (including the furniture retail chains). Most of the firms work with wooden materials, but some firms also work with steel and polymers. Competitive advantage is often a combination of quality, cost efficiency and geographical proximity to the customer. The average size of sub-suppliers is comparatively small (Brege et al. Citation2001, Brege (ed) 2009, Nord and Brege Citation2014). There are additional sub-suppliers delivering to the furniture industry, but they have been excluded from this SG since their main customers are within other industries. For instance, there are two large sub-suppliers of polymers and one within steel springs that deliver mainly to the automotive industry, and our overall estimate is that there is an additional SEK 200–300 million of revenue within this SG if these firms are included.
Turnover in 2017 was SEK 0.85 billion, coming from 29 companies with a total of 640 employees. The average company turnover was SEK 33 million (median SEK 20 million) and the average number of employees was 25 (median 17 employees) (see and in Appendix 1).
Research question 3: strategic groups related to performance
Among performance variables profitability was chosen which is most often used in SG-studies and as a second variable (organic) growth was singled out. Growth has together with profitability the highest priority within entrepreneurship research.
Growth
Looking at growth at SG level, two SGs could be labeled as high growth, with yearly (almost entirely organic) growth of 7–8% which among business analysts is considered being rather high within mature business and especially in a low-inflation economy. These SGs are kitchen/bathroom interior suppliers and institutional interior suppliers. Another two SGs are in a mid-growth position (4–5%): design furniture suppliers and retail shop interior suppliers ().
Table 1. The Swedish furniture industry – growth and profitability.
Five out of nine SGs show low or negative growth. These are sub suppliers, traditional large office interior suppliers, bedding suppliers, IKEA suppliers and household furniture suppliers.
Looking at the growth figures before, during and after the financial crisis offers some further perspectives. The bedding suppliers had an early peak in revenue even before the financial crisis (as early as 2006, ending a very prosperous period since the mid-90ies). It was not until 2017 that the net revenue of the bedding group surpassed the figures of 2006. Also, the traditional large office interior suppliers experienced strong growth during the 90ies and to some extent during the years before the financial crisis (Brege et al. Citation2001, Nord and Brege Citation2014), but compared to the bedding group there was no recovery after the financial crisis. The household furniture suppliers also experienced a peak one year before the financial crisis, and the downturn continued after the financial crisis (but at a very good level of profitability, as we will see below). The groups, besides bedding suppliers, with good average growth rates after the financial crisis are design furniture suppliers, institutional interior suppliers and kitchen/bathroom interior suppliers (i.e. those groups that actually showed good yearly growth figures for the entire period).
Profitability (return on total assets, ROA)
Looking at profitability (in terms of return on total assets, ROA), we see a high degree of consistency between high profitability and high growth in two cases: kitchen/bathroom interior suppliers and institutional sector interior suppliers. A third high-profit group – household furniture suppliers – shows “the opposite consistency”, i.e. negative growth while maintaining profitability. Profitability in the region of 9–12% is among business analysts considered to be high profitability, especially in a low inflation/low interest rates economy.
The two medium-growth SGs – retail shop interior suppliers and design furniture suppliers – also show medium levels of performance in terms of profitability. The profitability figure for design furniture suppliers is reduced by comparatively poorly performing smaller firms within the SG. However, a revenue-weighted profitability measure shows design furniture suppliers to be the second most profitable group (see ), with only kitchen/bathroom interior suppliers being more profitable. Another two medium profitability groups are coming from a low-growth position. These are bedding suppliers and sub-suppliers. The SGs in the medium profitability interval report figures in the region of 5–9%.
The two low-profitability SGs are the IKEA suppliers and the traditional large office interior suppliers, which in both cases correlate with low growth figures. Looking at profitability split into periods before, during and after the financial crisis the most outstanding observation is the negative profit for the traditional large office interior suppliers, which point in the direction of severe structural problems.
Looking at the consistency between growth and profitability, seven out of nine groups have matching high-growth and high-profit figures, medium-growth and medium-profitability figures, and low-growth and low-profitability figures. The Pearson correlation between growth and ROA is 0.570 for unweighted ROA and 0.670 for revenue-weighted ROA, both correlations are significant at the 0.001 level.
When comparing average profitability figures that are revenue-weighted and unweighted, in seven out of nine SG cases the revenue-weighted figures are higher and in only one case the opposite is in place (). These differences indicate that within a majority of SGs the larger firms are more profitable than the smaller, the biggest difference found within the design furniture supplier group. Two other SGs with large differences are the kitchen/bathroom interior suppliers group and the IKEA supplier group.
Table 2. The Swedish furniture industry – comparison between revenue-weighted and unweighted ROA figures.
Research question 4: tentatively explaining performance differences between strategic groups
In a final step (research question 4), the analytical focus is put on the differences in performance between the nine SGs and pinpointing what crucial explanatory factors lie behind these differences. The analysis should be viewed as tentative, however they choice of explanatory variables find support from other strategic group studies (cf. Wan and Bullard Citation2008, Citation2009, Ziaie et al. Citation2011) and from more general frameworks for instance Porter’s five forces model. We will present three demand and competition related explanatory factors and as a fourth factor the strength of competitive advantage.
International competition and exposure to low-cost competition
Very high levels of exports and imports of furniture indicate that the SFI and the domestic furniture market are strongly exposed to international competition. During the time-period from 2004 to 2017, export figures have been in the region of 65–75% of domestic furniture production. Import figures have also been very high, in the region of 60–70% of apparent consumption (production – exports + imports). The most prominent indicator of exposure to tough price competition is a fall in consumer prices of 5.6% during this thirteen-year period. Prices at the production level show a small to moderate increase for the entire industry: 24% on average (a yearly increase of 1.9%). However, there is a spread among different product groups – the category of other furniture (which includes a lot of household furniture and components) shows the lowest increase, at 13.5%, with kitchen furniture and interiors at 26%, and office and retail shop interiors on top at 48% (Sources: Statistics Sweden, consumer and production price indexes database).
When combining a breakdown of export and import figures into different product categories with changes in consumer and production price indexes, the conclusion can be made that price pressure and exposure to low-cost competition are toughest within the household and OEM sectors, while the institutional sector seems to be more sheltered. This latter statement does not imply an absence of competition, but rather that competition is not so fierce and more “domesticated”. Those product categories with the highest imports are furniture components, other furniture and upholstery furniture. The biggest exporter categories are furniture components, other furniture and office interiors.
Structural changes in demand and competition
Demand fluctuations over time are often divided into cyclical and structural changes, where cyclical changes follow the overall business cycle at different levels of economic aggregation (international, national, industry) and where structural changes are of a more irreversible character. Demand within the customer sectors – households, institutional and OEM customers – and different micro product/market segments are exposed to different structural changes. Some of the most prominent changes in this study are highlighted below:
The structural change in increased international competition and exposure to low-cost competition has already been touched upon – a structural change (which has been prevalent for many decades) that mostly affects the household and OEM sectors.
The change in demand within the institutional sector from traditional offices to office landscapes which are adapted to new ways of working in teams and projects and to the new demands on office equipment dictated by the paperless office. This structural change has lowered the demand for furniture in general and especially standardized volumes of different kinds of table tops and cabinets (cf. Edsbyverken Citation2017, EFG Citation2017).
The trend towards project-based contractual purchasing is both an opportunity and a threat – promoting a focus on larger business deals and a trend towards total offerings, as well as more formalized tendering processes (cf. Lammhults Design Group Citation2017). In particular, the implementation of public purchasing tendering processes is reported to be followed more rigorously in these days (a fact often mentioned in discussions/interviews). This type of structural change affects the institutional sector the most.
The change towards e-commerce is a structural change that has only begun. In the Swedish furniture market, e-commerce has been growing rapidly in recent years, and at the time of writing its percentage share of total revenue is 6% (Svensk Handel Citation2019).
Power balance towards the customer level
A third important dimension to consider when analysing the performance of our nine SGs is the power balance between the furniture companies and their customers. The large furniture retail chains, not least IKEA, are very resourceful corporations and can be looked upon as the engine in the race for low-cost competition, more so than large manufacturing furniture OEMs. The problem with a powerful customer level is most pronounced within the household furniture sector and the OEM customer sector. In the household sector, some more resourceful or innovative suppliers within the bedding SG (Hästens Citation2017), the kitchen and bathroom interiors SG (Ballingslöv Citation2017) and in some cases also the design furniture SG (Norrgavel Citation2017) are setting up their own stores or are forming (franchising) partnerships with highly specialized stores. So instead of going into business with the large retail chains, some suppliers are trying to bypass them.
The power balance between IKEA and its suppliers is a special case. All suppliers except one almost entirely produce and deliver to IKEA, and at present two of them are also owned by IKEA.
Within the institutional sector there is a different picture – the power structure is more balanced. There is also a different kind of relationship – good or bad depending on perspective – between suppliers and their institutional customers. The growing rate of project-based purchasing gives a different competitive situation, compared to a situation when informal, long-term relationships were more of a standard solution.
Strength of competitive advantage
The fourth explanatory factor is the strength of (major) strategic competitive advantage within the different SGs when handling and interacting with major environmental changes. Structural change could have both positive and negative effects, and as we will see among the nine SGs a structural change could be positive for one SG and at the same time negative for another. This is most evident in the structural change embedded in the trend towards office landscapes and the paperless office. This trend is negative for the traditional large office interior suppliers with their volume-oriented competitive strategy based on standardization and large-scale efficiency, but the trend is positive for those firms within institutional sector interior suppliers, with their more small-scale, specialized, and flexible offerings.
Exposure to low-cost competition depends partly on how effectively the strategic competitive advantage can erect mobility barriers between premium segments and low-cost segments of the market. In some markets, premium and low-cost business models can coexist relatively peacefully, which we believe is the case within kitchen/bathroom interiors. However, in other markets they are more interrelated, as in the case of the bedding SG, where frequent price campaigns as part of normal business are reported (Hilding Anders Sweden Citation2017).
The power balance towards the customer level is, looking at the industry level, asymmetrical in favor of the customer. But for some SGs and for some specific furniture firms it could be more balanced depending on the matching of customer/distribution channel segments vis-à-vis the strengths and weaknesses of the firm. For instance, larger furniture firms could be in a better position compared to their smaller colleagues in relationships with powerful customer groups, or some furniture firms could entirely avoid the most powerful customer groups.
The most important mismatch between environmental changes and competitive advantage can be found within the traditional large office interiors SG. The misfit is in the combination of a growing demand focusing upon smaller batches, flexible and customer adapted offerings, and a competitive advantage relaying upon large-scale and standardized production facilities. There is also some misfit among smaller design furniture suppliers in balancing their design and business focuses. Too much emphasis on design in product development and product line strategy could create difficulties in business; for example, every firm needs some products that are sold in larger volumes.
Summing up per SG
Kitchen and bathroom interior suppliers
The exposure to international competition within the premium segment is low. The co-existence between the premium brands and low-cost primarily through IKEA from a retailing position seems to be functioning rather well (even though IKEA has a very high market share on the Swedish market). Demand is strengthened by tax reductions for jobs carried out within the rebuilding and repair sector. Control over specialized retail stores strengthens the position towards consumers within the household sector. Strong competitive strategies in the premium sector erect barriers to price competition and lay the foundations for the best performance within the SFI ().
Table 3. Estimates of explanatory and performance variables as a basis for qualitative analysis.
Institutional sector interior suppliers
Positive effects of structural changes in demand promoting low volumes, flexibility and customer adaptation. Specialization towards different customer niches increases product differentiation and lowers internal competition within the group. Relatively low exposure to low-cost competition and relatively balanced relationships with institutional customers. Competitive advantage that fits the new demand and competitive situation towards more project-based, contractual business deals.
Household furniture suppliers
Relatively stable demand conditions during the period. High exposure to low-cost competition orchestrated by large furniture retail chains. Split performance figures – growth is “worst in class” among the nine SGs while profitability is strong. The difference between growth and profitability indicates a so-called harvesting strategy and an ambition to avoid the largest and most powerful retail chains.
Design furniture suppliers
Structural change in demand within the institutional sector also works in favor of the design furniture suppliers. Design image and focus on the institutional sector help avoid (or erect barriers to) exposure to low-cost competition and balance the relationship towards the customer level. The large design furniture firms have managed to balance design focus with business focus, which seems to be much more difficult for smaller firms. The large design firms report very high levels of profitability.
Retail shop interior suppliers
Positive demand conditions due to growing investments within retailing which turned negative late in the period, mostly due to the (commercial uncertainty created by the) rise in e-commerce. Relatively low exposure to low-cost competition (low export and import figures) and balanced relationships with customers (except the largest retail chains with centralized purchasing). Competitive advantage has been strong but needs to be adapted to new challenges – more self-service and increased e-commerce.
Bedding suppliers
Demand conditions have changed during the period in terms of consumer attitudes towards the premium segment and increased focus on price as a competitive weapon. The premium sector faces more difficulties in erecting mobility barriers to low-cost competition. Competitive advantage doesn’t seem be entirely functioning, the profit margins seem too low and profitability is “saved” by relatively high capital turnover. Growth is very low, measured as revenue from domestic production and sales (including exports). The internationalization strategies of the two largest companies have also put strain on profitability.
Sub-suppliers
Imports and exports are high in the furniture components product category, but these figures also include IKEA and their suppliers. Therefore, it is hard to estimate the degree of exports from the sub-suppliers SG, which are probably at considerably lower levels compared to IKEA. Nevertheless, we estimate the exposure to low-cost competition to be relatively high, and a comparison between growth and profitability figures indicates that the sub-suppliers have given priority to profit over growth.
IKEA suppliers
IKEA suppliers seem to be the most exposed SG to low-cost competition. In combination with increased automation for larger production volumes, suppliers are trying to deal with the tough competitive situation by building up production capacity in low-cost countries (which in 2017 added another SEK 1.5 billion in turnover at corporate level from non-IKEA-owned companies). Profitability is probably a little lower than “normal” due to cost-based pricing from the IKEA-owned suppliers.
Traditional large office interior suppliers
This is the SG that has faced the most serious structural demand problems, causing a mismatch between demand characteristics and competitive advantage. The challenge is to go from large-scale, large-volume, standardized production and sales to low-volume, flexible and customer-adapted production and sales. One of the three firms has addressed this challenge by massively outsourcing production, and now has the profile of a project sales company with some assembly production. At corporate level, the largest firm has acquired a group of design-oriented companies and is working hard to build (in-house) efficient production and logistic systems adapted to lower volumes and flexibility. The third firm is making changes to its product line and is working more intensively together with external designers. In all three cases, design has become a more important competitive factor.
Conclusions
There are some conclusions when relating our results to SG-theory in general:
Members of the different SGs have stayed within their initial SGs during the entire period, which indicate a very low degree of transfers between different SGs. This result is in line with among others Oster (Citation1982) and Cool and Schendel (Citation1987). This finding can partly be a result of choice of strategic dimensions and the qualitative formation of SGs.
The strategic orientations within SGs have developed over time. One direction is going from products towards total offerings, which are broadening the product-lines. Another direction is the increased importance of design, even among those companies that are not labeled as design firms. This finding supports the view of dynamic SGs (cf. Desarbo and Grewall Citation2008).
Changes in customer demand together with strategic reorientations within specific SGs has, in our case, led up to increased competition between SGs who are fighting for the same customers (diminishing mobility barriers, cf. Desarbo and Grewall Citation2008, Desarbo et al. Citation2009). In our study the most prominent example is the increased competition between traditional large office interior suppliers and institutional sector interior suppliers and, also design furniture suppliers.
Differences in performance – growth and profitability – show a stable pattern during the period studied, especially between high performers (three top-SGs) and the low performers (the two bottom-SGs). But we know from earlier studies (Brege et al. Citation2001) that the two bottom-performers – traditional office interior suppliers and the IKEA suppliers – showed much better results during the period 1998–2000. We draw the conclusion that specific demand conditions in different micro-customer-segments are important determinants of performance and most disruptive are structural changes in demand, which could be both an opportunity and a threat. If the demand conditions change, it is to be expected that new performance differences among SG will appear. Fiegenbaum et al. (Citation1987) show that these changes can show up rather frequently, within a year or two, when mapping a technologically turbulent industry. In our study, the financial crisis was such a disruptive element, changing the prerequisites for performance, which especially affected some of the SGs (e.g. household furniture suppliers).
In summary, even though our study shows stable performance differences between SGs, the conclusion is to be very cautious when generalizing to other industries and time-periods. And furthermore, there is limited or no predictive power in the hypothesis that membership of a certain SG will “determine” the levels of performance (cf. Sjort et al. Citation2007 who show that the firm-level, before the SG and industry levels, is the most influential on performance).
Disclosure statement
No potential conflict of interest was reported by the author(s).
Additional information
Funding
References
- Aaker, D., Kumar, V. and Day, G. (1995). Marketing Research (4th ed.).
- Anand, V., Joshi, M. and O’Leary-Kelly, A. (2013) An organizational identity approach to strategic groups. Organization Science, 24(2), 571–590.
- Andersson, K. (2005) Suppliers in Collaboration – The Impact on the Strategies of the Individual Firm. Linköping Studies in Science and Technology, Thesis no. 1201.
- Bain, J. S. (1959) Industrial Organization (New York, NY: Wiley).
- Ballingslöv (2017) Annual report.
- Barney, J. (1991) Firm resources and sustainable competitive advantage. Journal of Management, 17(1), 99–120.
- Barney, J. and Hoskisson, R. (1990) Strategic groups: Untested assertions and research proposals. Managerial Decision Economics, 11, 187–198.
- Bonetti, E. and Schiavone, F. (2015) Identifying and mapping strategic groups in the fashion industry. International Studies of Management and Organization, 44(1), 55–69.
- Boon-Kwee, N. and Thiruchelvam, K. (2011) The dynamics of innovation in Malaysia’s wooden furniture industry: Innovation actors and linkages. Forest Policy and Economics, 14, 107–118.
- Branlio-Gonzalo, M. and Boeva, M. (2020) Criteria analysis of green procurement in the Spanish furniture sector. Journal of Cleaner Production, 258, 1–14.
- Brege, S. (ed.). (2009). Affärsutveckling inom trämanufaktur och möbler – hur skapas effektivare värdekedjor? (Business development within the wood manufacturing and furniture industries – designing more efficient value chains). VINNOVA report 2009:01.
- Brege, S., Johansson, H.-E. and Pihlqvist, B. (2004). Trämanufaktur – det systembrytande innovations-systemet (Wood Manufacturing – The System Breaking Innovation System). Vinnova analys, VA 2004:02, (in Swedish).
- Brege, S., Milewski, J. and Berglund, M. (2001). Storskalighet och småföretagande – en studie av strategiska grupper inom svensk möbelindustri (Economies of scale and small business – a study of strategic groups within the Swedish furniture industry), VINNOVA report VR 2001:41.
- Bryman, A. and Bell, E. (1995) Business Research Methods (5th ed.) (Oxford: Oxford University Press).
- Buehlmann, U. and Schuler, A. (2009) The U.S. household furniture industry: Status and opportunities. Forest Products Journal, 59(9), 20–28.
- Buehlmann, U. and Schuler, A. (2013) Chapter 4: Markets and market forces for secondary wood products. The Global Forest Sector, 4, 77–98.
- Bullard, S. and West, C. (2002) Furniture Manufacturing and Marketing: Eight Strategic Issues for the 21st Century. Faculty Publications, 43.
- Cabral, A. M., Carvallo, F. M. and Ferriera, J. A. (2020a) International performance of SME’s international strategic groups. Administrative Sciences, 10(65), 1–24.
- Cabral, A. M., Carvallo, F. M. and Ferriera, J. A. (2020b) SME’s international strategic groups and top managers’ psychological characteristics. Administrative Sciences, 10(92), 1–22.
- Cao, X. and Hansen, E. (2006) Innovation in China’s furniture industry. Forest Products Journal, 56(11/12), 33–42.
- Chen, Y.- M. and Su, C.-T. (2014) Brand equity heterogeneity among strategic groups in service franchising. The Service Industries Journal, 34(9–10), 867–884.
- Cheng, S.-L. and Hae-Ching Chang, H.-C. (2009) Performance implications of cognitive complexity: An empirical study of cognitive strategic groups in semiconductor industry. Journal of Business Research, 62, 1311–1320.
- Claver-Cortés, E., Pereira-Moliner, J. and Molina-Azorín, J. (2009) Strategic groups and performance in the Spanish hotel sector. The Service Industries Journal, 29(7), 943–961.
- Cool, K. (1985) Strategic Group Formation and Strategic Group Shifts: A Longitudinal Analysis of the US Pharmaceutical Industry (Lafayette, IN: Purdue University).
- Cool, K. and Schendel, D. (1987) Strategic group formation and performance: The case of the US pharmaceutical industry 1963–1982. Management Science, 33(9), 1102–1124.
- Dell’Era, C., Marchesi, A. and Verganti, R. (2010) Mastering technologies in design-driven innovation. Research-Technology Management, March–April, 12–23.
- DeMarchi, V., DiMaria, E. and Ponte, S. (2013) The greening of global value chains: Insights from the furniture industry. Competition and Change, 17(4), 299–318.
- Desarbo, W. and Grewall, R. (2008) Hybrid strategic groups. Strategic Management Journal, 29, 293–317.
- Desarbo, W., Grewall, R. and Wang, R. (2009) Strategic groups: Deriving spatial evolutionary paths. Strategic Management Journal, 30, 1420–1439.
- Dess, G. and Davies, P. (1984) Porter’s (1980) generic strategies as determinants of strategic group membership and organizational performance. Academy of Management Journal, 27(3), 467–488.
- Drayse, M. (2011) Globalization and Innovation in a mature industry: Furniture manufacturing in Canada. Regional Studies, 45(3), 299–318.
- Edsbyverken (2017) Annual report.
- EFG (European Furniture Group) (2017) Annual report.
- Elmhester, K. (2008) Små företag i strategiska nätverk: hur påverkas det enskilda företagets utveckling? (SMEs in Strategic Networks – Effects on their Development as Individual Companies). Linköping Studies in Science and Technology, dissertation no. 1217.
- Elmhester, K. and Brege, S. (2011) The Trä50 group: A supplier network of potential competitors having IKEA as their common customer. In Johansson and Lundberg (eds.), Network Strategies for Regional Growth (Hampshire: Palgrave Macmillan), pp. 151–162.
- Fiegenbaum, A., Sudharshan, D. and Thomas, H. (1987) The concept of stable time periods in strategic group research. Managerial and Decision Economics, 8, 139–148.
- Flavian, C., Haberberg, A. and Polo, Y. (1999) Subtle strategic insights from strategic group analysis. Journal of Strategic Marketing, 7, 89–106.
- Glimakra of Sweden (2017) Annual report.
- Hästens (2017) Annual report.
- Hatten, K. (1974) Strategic Models in the US Brewing Industry (Lafayette, IN: Purdue University).
- Hilding Anders Sweden (2017) Annual report.
- Hongqiang, Y., Chunyi, J., Ying, N. and Yinxing, H. (2012) China’s wood furniture manufacturing industry: Industrial cluster and export competitiveness. Forest Products Journal, 62(3), 214–221.
- Hunt, M. S. (1972) Competition in the Major Home Appliance Industry, 1960–1970 (Cambridge, MA: Harvard University).
- ITAB Shop Concept (2017) Annual report.
- Kantonen, M. (1998) The furniture industry of the lahti region, Finland at the turning point. In M. Lorenzen (ed.), Specialization and Localized Learning – Six Studies on the European Furniture Industry (Copenhagen Business School Press.
- Kim, B.-G. (2018) An exploratory analysis on strategic changes of furniture retailer: Focusing on IKEA and Hanssem in Korea. Journal of Distribution Science, 16–12, 33–45.
- Lammhults Design Group (2017) Annual report.
- Lanbuschagne, A., van Zyl, S., van der Merwe, D. and Kruger, A. (2012) Consumers’expectations of furniture labels during their pre-purchase information search: An explication of proposed furniture labelling specifications. International Journal of Consumer Studies, 36, 451–459.
- Leask, G. (2007) Making sense of industry dynamics: Is there still value in strategic group research? Journal of Medical Marketing, 7(3), 189–202.
- Leask, G. and Parker, D. (2006) Strategic group theory: Review, examination and application in the UK pharmaceutical industry. Journal of Management Development, 25, 386–408.
- Lee, A. S. (2014) The investigation into the influence of the features of furniture design on consumers’ perceived value by fuzzy semantics. South African Journal of Business Management, 45(1), 79–93.
- Lin, M., Zhang, Z. and Cao, Y. (2019) Forecasting supply and demand of the wooden furniture industry in China. Forest Products Journal, 69(3), 228–238.
- Lindahl, I. (2013) Visual aesthetics in product development – a balance between commercial and creative imperatives. Linköping Studies in Science and Technology, dissertation no. 1553.
- Lihra, T., Buehlmann, U. & Beauregard, R., 2008. Mass customisation of wood furniture as a competitive strategy. International Journal of Mass Customisation, 2(3/4), 200–215.
- Lihra, T., Buehlmann, U. and Graf, R. (2012) Customer preferences for customized household furniture. Journal of Forest Economics, 18, 94–112.
- Lojaconi, G. and Lorenzen, M. (1998) External economies and net value strategies in the Italian furniture districts. In M. Lorenzen (ed.), Specialization and Localized Learning – Six Studies on the European Furniture Industry (Copenhagen: Copenhagen Business School Press), pp. 71–94.
- Mas-Ruiz, F., Ruiz-Conde, E. and Calderón-Martínez, A. (2018) Strategic group influence on entry mode choices in foreign markets. International Business Review, 27, 1259–1269.
- Massote, C. and Santi, A. (2013) Implementation of a cleaner production program in a Brazilian wooden furniture factory. Journal of Cleaner Production, 46, 88–97.
- McGee, J. (2003) Strategic groups: Theory and practice. In D. O. Faulkner and A. Campbell (eds.), The Oxford Handbook of Strategy: A Strategic Overview and Competitive Strategy, 1 (Oxford: Oxford University Press), pp. 261–301.
- McNamara, G., Deephouse, D. and Luce, R. (2003) Competitive positioning within and across a strategic group structure: The performance of core, secondary and solitary firms. Strategic Management Journal, 24, 161–131.
- Nord, T. and Brege, S. (2014) En framtida hållbar trävärdekedja – struktur, utveckling och möjligheter (A Future Sustainable Wood Value Chain – Structure, Development and Opportunities). Swedish Wood.
- Norrgavel (2017) Annual report.
- Oster, S. (1982) Intraindustry structure and the ease of strategic change. Review of Economics and Statistics, August, 417–427.
- Pahkasalo, T., Aurenhammer, P. and Gaston, C. (2013) Value-added wood products markets. Forest Products Annual Market Review 2012–2013, 10, 95–104.
- Periera-Moliner, J., Claver-Cortéz, E. and Molina-Azorzín, J. (2001) Explaining the strategic groups-firm performance relationship: A multilevel approach applied to small and medium-sized hotel companies in Spain. Journal of Small Business Management, 49(3), 411–437.
- Peteraf, M. and Shanley, M. (1997) Getting to know you: A theory of strategic group identity. Strategic Management Journal, Summer Special, 18, 165–186.
- Porter, M. (1979) The structure within industries and companies’ performance. Review of Economics and Statistics, 61, 602–613.
- Porter, M. (1980) Competitive Strategy – Techniques for Analysing Industries and Competitors (New York: The Free Press).
- Reger, R. and Huff, A. S. (1992) Strategic groups: A cognitive perspective. Strategic Management Journal, 14(2), 103–124.
- Scherer, F. M. (1970) Industrial Market Structure and Economic Performance (Boston: Houghton-Mifflin Company).
- Scherer, F. M. and Ross, D. R. (1990) Industrial Market Structure and Economic Performance (Boston: Houghton-Mifflin Company).
- Shah, A. (2007) Strategic groups in retailing based on Porter’s generic market based strategies. The Marketing Management Journal, 1, 151–170.
- Sjort, J., Ketchen Jr, D., Palmer, T. and Hult, T. (2007) Firm, strategic group, and industry influences on performance. Strategic Management Journal, 28, 147–167.
- Sonenshein, S., Nault, K. and Obodaru, O. (2017) Competition of a different flavour: How a strategic group identity shapes competition and cooperation. Administrative Science Quarterly, 62(4), 626–656.
- Storey, D. and Greene, F. (2010) Small Business and Entrepreneurship (Essex: Person Education Limited).
- Susanti, A., Tjahjono, B. and Sulistyani, R (2020) An investigation into circular economy practices in the traditional wooden industry. Production Planning and Control, 31(16), 1336–1348.
- Svensk Handel (2019) Läget i handeln – 2019 års rapport om branschens ekonomiska utveckling. Svensk Handel.
- Teece, D., Pisano, G. and Shuen, A. (1997) Dynamic capabilities and strategic management. Strategic Management Journal, 18(7), 509–533.
- Thomas, H. and Pollock, T. (1999) From I–O economics’ S–C–P-paradigm through strategic groups to competence-based competition: Reflections on the puzzle of competitive strategy. British Journal of Management, 10, 127–140.
- Uddenberg, A. (2015) Growth in established SMEs – exploring the innovative and ambitious firm. Linköping Studies in Science and Technology, Licentiate Thesis No 1704, Linköping University.
- Wan, Z. and Bullard, S. (2008) Firm size and competitive advantage in the U.S. upholstered, wood household furniture industry. Forest Products Journal, 58(1/1), 91–96.
- Wan, Z. and Bullard, S. (2009) Competitive strategy and business performance in the U.S. upholstered wood household furniture industry. Forest Products Journal, 59(9), 15–19.
- Wernerfelt, B. (1984) A resource-based view of the firm. Strategic Management Journal, 5, 171–180.
- Ziaie, M., Mohamed, S., Ratnasigam, J., Noor, A. and Saleh R. (2011) Competitive strategic trends among the Malaysian wooden furniture industry: A strategic group analysis. Journal of Applied Sciences, 11(14), 2487–2499.
Appendix 1
Table A1. The Swedish furniture industry – comparison of revenue and number of employees in 2004 and 2017.
Table A2. The Swedish furniture industry – firm sizes among SGs.