
 ?Mathematical formulae have been encoded as MathML and are displayed in this HTML version using MathJax in order to improve their display. Uncheck the box to turn MathJax off. This feature requires Javascript. Click on a formula to zoom.
ABSTRACT
Computed tomography (CT) scanning of logs makes appearance-grading virtual sawn timber possible before the log is sawn. A CT-scanner can measure the knot structure inside a scanned log, inferring how to saw the log. The knot structure of virtual sawn timber was graded as being suitable or not for a specific product by the existing rule-based approach and used to create a set of descriptive statistical variables used by two machine learning models. The PLS models were trained on two quality references; the quality grade of the finished product or the image-grade based on images of the sawn timber, extracted from the dry-sorting station's automatic grading system and graded by two experienced researchers. The results show that the two PLS models perform equally well when sorting sawn timber to the customer, indicating that the quality references are equally useful for training a PLS model. The PLS models both delivered 93% of the dried sawn timber to the customer, leaving very little sawn timber with customer-specific properties at the sawmill, of which 89% and 90% of the delivered sawn timber passed the intended product's quality demands. The rule-based approach delivered 85% dried sawn timber with a 73% pass rate.
KEYWORDS:
1. Introduction
The earliest possible decision making in the sawmill process is achieved with X-ray computed tomography (CT) scanning of logs before sawing. CT-scanning a log gives information of the log's internal knot structure, which is the main feature to consider when grading sawn timber. Virtual sawn timber is fitted inside the CT scanned virtual representation of the log so that the knot structure on the surfaces and within the virtual sawn timber can be measured. The virtual sawn timber can then be graded according to some grading criteria. Once graded, each virtual piece of sawn timber can be dedicated to a specific customer and to the intended main product (Sandberg and Teischinger Citation2021), and the log can then be sawn. Based on the grading, the sawmill can also plan the drying of the sawn timber to fulfil customer demands. One advantage of such planning is that sawn timber of the same dimensions, but with different drying requirements, can be separated before drying and the traditional dry-sorting grading procedure. By performing the quality grading early in the production process, any subsequent grading can be used as a complementary grading process, if at all necessary. Depending on the intended customer, such subsequent grading may be necessary to detect rotten or dead knots. Such knots can be filled with resin, and then the CT scanning can not always detect the small density variations to distinguish between sound, dead, or rotten knots.
Appearance grading of sawn timber is usually performed using a rule-based approach. Rules (limits) are enforced such that, e.g. the knot structure of the sawn timber abide by standardised quality grades, such as the Nordic Timber Grading Rules (NTGR – Swedish Sawmill Managers Association Citation1994). The sawmill participating in this study has two rule-based sawn timber grading systems; a CT-based system that optimises the log's positioning before sawing and a camera-based system that performs the final grading at the dry-sorting station. Both systems implement either the NTGR or special customer-adapted grading rules. Lycken and Oja (Citation2006) argued that the NTGR rules are troublesome to customise for individual customers. In particular, it is difficult for the customer to describe their subjective quality criteria of the entire face of the sawn timber in a way that can be described by a set of rules governing individual features. Lycken and Oja (Citation2006), Berglund et al. (Citation2015), and Olofsson et al. (Citation2019a) showed that a partial least squares regression model [or projection to latent structures, PLS (Geladi and Kowalski Citation1986; Wold et al. Citation2001)] could beneficially replace the rule-based grading for a product-specific grading, requiring only the final product-grade as input from the customer. The benefits of PLS-based grading over rule-based grading suggested by Lycken and Oja (Citation2006) and Olofsson et al. (Citation2019a) can be summarised by saying that the PLS grading model captures the customer's subjective and holistic grading criteria, which are difficult to describe using a rule-based approach.
Relatable to the studies Lycken and Oja (Citation2006), Berglund et al. (Citation2015), Olofsson et al. (Citation2019a), and Breinig et al. (Citation2015b) performed cluster analysis and classification of floor boards according to their subjective visual characteristics, showing the possibility to use a set of knot descriptive variables to group floor boards into homogeneous clusters with significant differences. Furthermore, in a continuation study, Breinig et al. (Citation2015a) used simulated sawing of CT-scanned logs to optimise the rotational angle of the logs to yield the most number of floor boards of cluster-grades defined as in the previous study. Both studies showed the potential to use machine learning methods, in particular PLS, to appearance grade sawn timber by their holistic-subjective appearance.
When developing a machine learning approach for product-adapted or customer-adapted grading, one problem is acquiring data to train and test the grading model. The data require measured features, , and a reference-grade,
, of the sawn timber which the machine learning method can model. The data must represent all possible incoming data to achieve a robust grading model, i.e. including sawn timber providing both a good and a poor quality reference. In this study, acquiring such data requires tracking of each piece of sawn timber through the entire refinement process; from the point of being a virtual piece of sawn timber scanned by the CT scanner before sawing to the point of being a finished wall panel in the customer's final quality control. Such data collection is usually a troublesome and costly logistical process. Olofsson et al. (Citation2021) showed that it is possible to acquire equally useful data for product-adapted dry-sorting in an easier way by asking the customer to grade images of sawn timber as the basis for the quality grade reference. By studying images of sawn timber, the customer can assign the product-grade resulting from each piece of sawn timber with high certainty. The benefits of using images of sawn timber as the basis for the quality grade reference are that the images are easily acquired at the sawmill by a camera-based automatic grading system at the dry-sorting station. The images are then easily delivered to the customer and graded subjectively and holistically. The images are not customer-specific, and they can therefore be reused for different customers requiring the same specie and dimensions. Using such images as the basis for the quality reference greatly simplifies the data collection process, as no material needs to be delivered and processed by the customer. Olofsson et al. (Citation2019b) showed that it is possible to perform this data collection in future studies using a traceability algorithm to match sawn timber scanned by the CT scanner with the same sawn timber scanned by the camera-based system at the dry-sorting station.
The purpose of this study was to investigate whether it is possible to use a machine-learning PLS model to appearance grade virtual sawn timber as suitable for a specific customer's product before the log is sawn. A goal was to use images of sawn timber to create a reference grade for the machine-learning system.
2. Material and methods
2.1. The material
The material investigated consists of 303 centre yield pieces of sawn timber, with a cross-section of mm, taken from 156 Scots pine logs (Pinus sylvestris L.), between 3.6 and 5.4 m in length, and dried to 14% moisture content. Two pieces of centre yield were sawn from each log, but 9 pieces were lost or destroyed. The logs selected for this study came from the log sorting yard and were pre-sorted top logs, with some small log sorting error.
2.2. The method
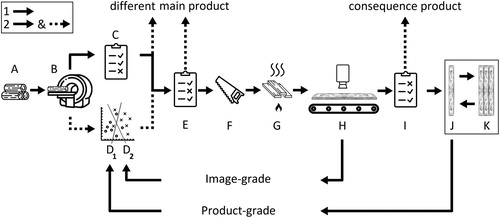
An overview of the study is presented in this subsection and in – the letters A-J in this paper refer to this figure. More details will follow in the upcoming subsections. This study was performed at Sävar Sawmill (Sävar såg, “the sawmill”), where log data from the on-site CT scanner (B) and sawn-timber data from the camera-based dry-sorting system (H) were collected. The sawn timber was then processed into wall panels at Lundgren's Planing Mill (Lundgrens Hyvleri, “the customer”), where the quality grade of each piece of sawn timber (J) was determined based on the quality grade of the wall panels produced.
Figure 1. Material flow chart. The procedure was as follows, following the nomenclature in the flow-chart above 1, data collection of the entire dataset through the entire process. 2, simulated sorting comparing the sorting outcome of the rule-based approach with the PLS-based approaches. A, the 156 logs selected for the study. B, CT-scanning of all the logs by the CT Log. C, the rule-based approach optimising and deciding on the sawing. and
, two PLS models correlating variables
from the CT-scanning and the product-grade
, or image-grade
, quality references. C and D can classify the virtual sawn timber as the main product intended for the customer or, if not suitable for this customer, as a main product for a different customer. E, additional rules applied to C and D to remove outliers only during the simulated sorting. F, sawing the log. G, kiln drying the sawn timber. H, the Boardmaster at the dry-sorting station capturing images of the sawn material whose image-grade is used as a quality reference for
. I, additional rules applied to remove outliers. J, a piece of sawn timber delivered to the customer receiving a quality product-grade
based on K. K, split, milled, and quality graded wall panels by the customer.
Each of the 303 pieces of sawn timber was tracked from the CT-scanning of the log, through the sawing and drying, the optical scanning in the dry-sorting station, the refinement process at the customer, and to the final quality-grading station at the customer. The data collected throughout this process used two different reference grades to train two PLS grading models. The 303 pieces of sawn timber were then simulated to pass through the refinement process a second time as an independent test set using 5-fold cross validation. The sorting performance of a rule-based approach was compared with each of the two PLS-based models.
During the simulated sorting, the grading steps could each classify the sawn timber either as the main product or as a consequence product (Sandberg and Teischinger Citation2021). The main product was dedicated to the customer and continued to the next step of the refinement process according to the customer's requirements, e.g. drying requirements, and eventually sold to that customer. A consequence product is sawn timber deemed unsuitable for the initially intended customer and should be refined and sold to a different customer according to their requirements.
The CT-scanning system can grade the virtual sawn timber before the log is sawn as the main product or as a consequence product. This grade can then be used to decide how to saw the log such that the logs are always sawn with a specific customer or product in mind, i.e. a log should always be sawn into a main product of sawn timber. Similarly, the optical scanner in the dry-sorting station could grade the dried sawn timber as the main product or as a consequence product as the final grading step before delivery.
Using either rule-based grading or PLS-based grading, the CT-scanning system was the main grading step in this study. The grading performed by the CT system was complemented by two grading steps, one before sawing (E) and one after drying (I), to remove outliers, see Section 2.4.1. The complementary steps were the same for both the rule-based approach and the PLS models.
2.3. Data collection
The industrial customer Lundgren's Planing Mill aims to produce a specific wall panel product. The sawn timber delivered to Lundgren's Planing Mill for this product was from Sävar Sawmill, and three wall panels were made from each piece of sawn timber by splitting and milling (K). The wall panels were manually graded as either the desirable grade A or the undesirable grade B, each piece of sawn timber being graded as either A or B in the product-grade (J) as the majority wall panel grade produced from that piece of sawn timber. Both the wall panels and the sawn timber shared the A or B quality grade label but, as this study dealt only with the grading of sawn timber, only the A or B grade of the sawn timber was used. This wall panelling product was sensitive to dead knots as they tend to crack or fall out, and sound knots can crack during splitting and milling. A consequence of this is that the main product described in Section 2.2 is not guaranteed to result in grade A sawn timber at the customer, and an incorrectly delivered consequence product is not guaranteed to result in grade B sawn timber at the customer.
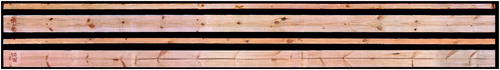
The sawn timber delivered from the sawmill was scanned using a Boardmaster dry-sorting system (Anon. Citation2018) that uses cameras to measure externally visible features to describe the sawn timber in a way that a computer can automatically grade and was the final grading step before delivery. Images of the sawn timber () from the Boardmaster were graded by two experienced researchers as being suitable for the customer or not. This image-grade (H) classified the dried sawn timber as the main product (suitable for Lundgren's Planing Mill) or as a consequence product (not suitable for Lundgren's Planing Mill) which were also labelled A or B, respectively.
Figure 2. Example of images used for image-based grading. All four faces of the sawn timber are shown.
The logs selected for this study (A) was scanned by the on-site CT-scanning system (B) called CT Log (Ursella et al. Citation2018), by Microtec. CT scanning of the logs before sawing makes it possible to 3D measure internal features such as knots. The CT Log transformed the 3D knot data into a 2D knot structure on the surfaces of the virtual sawn timber, and a large set of variables could be calculated based on the 2D knot structure. Some log characteristics were also included in the set of variables, e.g. pith deviation from a centre line. Based on the measured 2D knot structure of the virtual sawn timber, a set of customer-adapted rules (C), similar in scope to the NTGR, was used to determine the grade of the virtual sawn timber. Based on this rule-based grade, the CT Log optimised and decided the log's positioning during sawing to maximise the yield of sawn timber suitable for the customer – the main product. If the CT Log could not find a way to saw the log to yield sawn timber suitable for the customer, the log was sawn into the main product for a different customer, i.e. the sawn timber was graded as a consequence product. All sawn timber was still included in the study regardless of how the log was sawn to increase the dataset size and introduce more diversity in the dataset. (C) was the only grading process used to optimise the log's positioning during sawing, the complementary rules (E) were only involved later in the simulated sorting and sawing. Once the sawing of the log was decided, the variables
of the virtual sawn timber and the log characteristics were calculated and stored.
2.3.1. Variable set created using the CT Log
A large set of variables were calculated based on the CT data, and a few specific measurements were used from the camera-based measurements by the Boardmaster. The CT-based variables
were used for PLS modelling (D), and the measurements made by the Boardmaster were used to create a few rules to remove outliers (I). The full
variable set, consisting of approximately 1800 variables, is similar in structure and scope to the set detailed in Olofsson et al. (Citation2019a) but was based on the CT Log measurements described below. The variables are similar enough that they do not require a re-definition here. The variables in this study are fewer in number in part because the CT scanner did not provide as granular information about the status of the knots, e.g. bark-ringed knots.
The CT Log measured the scanned log's geometry, knots, heartwood content, heartwood density, sapwood density, spiral grain, and pith deviation from a centre line for each log. The CT Log describes each knot with a few different measurements and classes regarding shape, size, and sound or dead status. The measured knots were projected onto the surface of the virtual pieces of sawn timber as the CT Log had intended the sawing. The 2D knot structure was described by a large set of statistical measurements repeated in several sections of the sawn timber on all the sawn timber faces. The log-specific features, together with the variables calculated from the 2D knot measurements, were used to calculate the variables for each piece of virtual sawn timber.
Once the data was stored and the variables were calculated, the log was sawn into sawn timber based on the instructions of the CT Log. Due to a shortcoming of the data collection, the data did not capture any inaccuracies, such as positioning or rotational errors, of the sawing process. Due to these errors, the variables based on the CT Log's knot description occasionally does not fully correlate with the material and, by extension, the grades associated with that piece. As such sawing errors are typically quite small, the effect of these errors is estimated to be small but does introduce more unnecessary noise in the data. Occasionally, a large rotational error would result in a piece of sawn timber that is not represented well in the CT Log data.
2.4. The machine learning method – PLS
PLS is a simple but powerful machine learning method, which uses multivariate linear regression to correlate measured variables of a training dataset with the grade of the same dataset
. The training of the PLS model consists in finding the best weights
and biases
for maximum prediction accuracy on the training dataset of the true grade y by the model
. For this study, the SIMCA 15 (Anon. Citation2019) software was used to train two grading models using the X-ray CT variables
and either the product-grade
or the image-grade
quality references. Both models were then used to predict the product-grade
of an independent test set. For a detailed description of a similar implementation of PLS for product-specific grading in the dry-sorting station, see Olofsson et al. (Citation2019a).
The PLS model outputs an estimated probability that a piece of sawn timber is of the higher grade A relative to the training data. The actual classification is then a check on whether this probability passes a certain threshold (called PLS-DA, PLS regression implemented for discriminant analysis), by default 50%. If the probability passes the threshold, the sawn timber is assumed to be grade A and is graded as the main product. To minimise the volume of grade B sawn timber dried to 14% moisture content, the classification threshold was raised above 50%. This way, only highly probable grade A pieces of sawn timber were dried to 14% moisture content and dedicated to the wall panel customer as the main product.
2.4.1. Complementary rules
One of the drawbacks of the multivariate method used in this study is that some important measurements can become too vague in the PLS model. This is not a problem with the number of variables, as the PLS model is optimised for predictive power and not optimised for the best regression fit of the variables to the grade
. The model is optimised for predictive power based on a training dataset that is separate from the testing dataset and is therefore not biased. An example of a vague variable is the deviation of the log-pith from a centre line measured by the CT Log. This measurement is related to the sawn-timber grade because a large deviation in the pith could indicate bark-inclusion, which often results in wall panels of grade B. However, since a large pith deviation does not guarantee bark inclusion, the model can still classify the sawn timber as grade A even with a large log pith deviation measurement. The weight
associated with log pith deviation is not infinitely large and can therefore be outweighed by other variables. A large pith deviation is nevertheless considered to be a high risk, and a rule (limit) for this variable, and similarly for a few others, was therefore included for all tests in both the CT Log and the Boardmaster (E, I). These measurements are holistic in that they measure, for example, the summed dead-knot area of the entire face of the sawn timber.
In the CT Log, six rules were enforced in all tests as an upper limit:
one measurement of the pith deviation,
three measurements of the dead-knot area on the sapwood face of the sawn timber, and
two measurements of the dead-knot area on the edge faces of the sawn timber.
Usually, the Boardmaster in the dry-sorting station performs the main and final grading of the sawn timber. For this customer, this would have been done with rule-based grading using very similar rules to those used in the CT Log (C). In this study, these rules were not active, as the CT Log has already performed the appearance grading of the sawn timber.
The Boardmaster was set up to enforce seven rules in all tests with upper limits for:
the dead-knot area on the edges and sapwood face,
the bark-knot size on the pith face and sapwood face,
the size of the bark-inclusion on pith face and sapwood face, and
no rotten knots.
These rules were the same throughout the study for both systems in all tests. The limits were determined based on the entire dataset as a limit that would discard obviously poor-quality sawn timber or high-risk pieces. The rule-based grading and the PLS models also failed most of the sawn timber pieces that any of these rules would have failed.
2.5. Simulated sorting procedure
After the data collection and training of the two PLS models and
, three simulated sortings of the entire dataset were carried out. One for the rule-based grading (C) and one for each of the
and
PLS models. For the simulated rule-based sorting, the entire dataset was passed through the material flow chart (), and the sorting outcome was calculated. For each of the PLS-based simulated sorting, the simulated sorting was performed using 5-fold cross-validation where the dataset was split into 5 parts, and each of the parts was used as the test set while the remaining four parts were the training set. The results are the summed results of these five tests and are referred to as the results of the entire dataset in the context of the PLS-based sortings. The product-grade was always considered the true grade even if one of the PLS-based models was trained on an image-based reference grade.
If the virtual sawn timber grade before sawing was determined to be B, i.e. a consequence product, by the grading method (C) or (D), or by the 6 complementary rules in the CT Log (E), that piece of sawn timber was dedicated to a different customer as a different main product of the same dimensions. It was possible, if necessary, to dedicate one of the two centre yield pieces of sawn timber to Lundgren's Planing Mill and one piece to another customer.
Using the camera-based Boardmaster dry-sorting system, another set of 7 complementary rules was applied at the dry sorting station (I). These rules graded the dried sawn timber as the main product or as a consequence product and would overrule the previous grade and were the final grading step before delivery to the customer.
3. Results
To investigate the possibility of dedicating virtual sawn timber to a specific product before the log was actually sawn, using X-ray CT-scanning and machine-learning models, a simulated sawmill refinement process and the sorting of 156 logs were investigated. A rule-based approach was compared with two PLS-based machine-learning models using the product-grade or the image-grade as quality reference for training when the virtual sawn timber was graded based on the CT-scanning data.
The quality distribution of the 303 pieces of sawn timber in this study is shown in and is repeated in for easy reference. The image-grade and the product-grade show a very different proportion of grade A sawn timber of the entire dataset.
Table 1. Material quality grade distribution.
Table 2. Sorting outcome using the customer-adapted rule-based grading in the CT Log and using the complementary rules in the CT Log and the Boardmaster.
Table 3. Sorting outcome using the product-trained PLS model in the CT Log and using the complementary rules in the CT Log and the Boardmaster.
Table 4. Sorting outcome using the image-trained PLS model in the CT Log and using the complementary rules in the CT Log and the Boardmaster.
show how the material was sorted in the sawmill, where each column shows the quality distribution of the main product dedicated to the customer after that step. Graded by the CT Log refers to (C+E) in , and graded by the Boardmaster refers to (I). The product-grade rows A and B show the product-grade quality distribution of the main product. The total count shows the number of pieces delivered from the current step to the next step. The ratio of delivered sawn timber shows the ratio of the incoming sawn timber from the previous step that is graded as the main product and is delivered to the next step. The all-sawn-timber column always shows 100%, as the entire dataset is delivered to the CT Log. The proportion of sawn timber of grade A delivered shows the proportion of the main product delivered to the next step that is of grade A, which for the log intake was always 62% as that was the proportion of product-grade A sawn timber in the entire material () delivered to the CT Log.
The results using the product-trained () and image-trained () PLS-based CT Log sortings are very similar, 41% of the scanned material being delivered from the CT Log to the Boardmaster and both showing 93% delivered from the Boardmaster to the customer. The proportion of grade A sawn timber by the image-trained PLS model managed 2%-points higher by the CT Log and 1%-point higher by the Boardmaster than the product-trained PLS model.
The rule-based sorting () by the CT Log and by the Boardmaster delivered 200 pieces of sawn timber to the customer, while the PLS-based CT Log approaches delivered 114 and 115 pieces of sawn timber, respectively. The higher amount of sawn timber delivered from the Boardmaster by the rule-based approach comes with a lower proportion of delivered sawn timber of grade A at 77% compared to 89% and 90% with the PLS-based methods. The rule-based sorting rejected a higher proportion of sawn timber at the Boardmaster, with 88% of the sawn timber delivered to the customer compared to 93% and 93% by the PLS-based sortings.
All the pieces rejected by the complementary rules shown in were obviously poor quality sawn timber or high-risk pieces based on visual inspection. The product-trained PLS model required less correction by the complementary rules (E) than the other methods, with only 10 pieces of grade B being removed.
Table 5. Sorting outcome specific to the complementary rules (E) in the CT Log for the rule-based grading method and the two PLS-based methods.
4. Discussion
When the overall sorting performance of the current rule-based approach () is compared with the PLS-based sorting results ( and ), it is clear that the PLS-based methods deliver sawn timber more in agreement with the requirements of the customer. The proportion of grade A sawn timber in the batch delivered from the Boardmaster and the dry-sorting station is about 90% for the PLS-based methods compared to 77% using the rule-based approach. A high proportion of grade A sawn timber is very important for the customer as this means that the production process yields a higher proportion of grade A wall panels. Both the PLS-based methods also managed to deliver a higher proportion of the material through the complementary rules in the Boardmaster than the rule-based approach, 93% vs 88%, respectively. Using either of the PLS-based methods would result in a lower proportion of consequence products for the sawmill. The PLS-based methods could be improved by allowing a PLS model to control the sawing optimisation instead of sorting the sawn timber produced by the rule-based approach. The results could also be improved by taking into account the log positioning errors mentioned in Section 2.3.1.
The higher proportion of grade A sawn timber achieved by the PLS-based methods comes with the consequence that a smaller volume of sawn timber is dedicated to the customer. The rule-based sorting in the CT Log dedicated 228 pieces of sawn timber to the customer compared to 123 and 124 pieces of sawn timber dedicated by the PLS-based approaches. This means that a larger quantity of logs must be sawn using the PLS-based methods to reach the same delivery quota as the rule-based method. During discussions with the sawmill, it was established that a minimum of about one-third of the material scanned by the CT Log needs to be dedicated to the customer; otherwise, the drying kilns will not be filled during one working shift. As long as this requirement is met, the smaller number of pieces of sawn timber delivered by a strict PLS-based approach in the CT Log is not a problem. Since the PLS models use a classification threshold, the balance of strict sorting vs high volume deliveries is a simple balancing problem controlled by a single parameter (see Olofsson et al. Citation2019a for a more detailed discussion on this balancing act).
The use of complementary rules (both in the CT Log (E) () and in the Boardmaster at the dry-sorting (I) ()) was deemed to be necessary. Without these rules, some obviously poor quality or high-risk sawn timber would have been graded as the main product and delivered to the customer. For the rule-based case, the need for complementary rules indicates how difficult the appearance grading of sawn timber for this customer is. The difficulty comes from the fact that according to the rules used in (C), each knot is evaluated separately, which is one of the problems of customising rules for an individual customer according to Lycken and Oja (Citation2006) and Olofsson et al. (Citation2019a). The complementary rules in (E) use holistic variables which are more suitable for this customer. These rules are also necessary for the PLS-based methods. Due to the limited size of the dataset used in this study, some important variables were difficult to model by linear regression. For example, the most important feature apart from knots was the pith deviation, a high value of which can indicate top breakage and, therefore, a high risk of bark inclusion which is almost guaranteed to result in grade B sawn timber. Since a high pith deviation does not guarantee bark inclusion, the variable is difficult to model by PLS.
One problem in using both the CT Log and the Boardmaster to grade the sawn timber is the two systems may disagree, as discussed in more detail by Olofsson et al. (Citation2019b). A disagreement could result in sawn timber being dried to 14% and not being delivered to the customer, resulting in consequence products for the sawmill. At the same time, an agreement between the CT Log and the Boardmaster would mean that only sawn timber suitable for the customer would be dried to 14% and delivered to the customer.
The similarity in sorting performance by the model trained using the product-grade (), and the model trained using the image-grade () shows that an image-based reference is at least as good as using a product-grade reference for the PLS model training. This equivalence of reference grades was previously found for product-adapted dry-sorting by Olofsson et al. (Citation2021). The process of using images of sawn timber to perform the appearance grading has been used earlier, e.g. by Broman (Citation2000), and with the present study and Olofsson et al. (Citation2021) now show the use of images for product-adapted appearance grading. As the image-grade reference is much easier to acquire than the product-grade reference, the difficulty in gathering data for similar machine learning studies could be much less. The product-grade and image-grade were quite different (). The image-grade determined by the two experts was much stricter than the actual product-grade. However, using a classification threshold as described in detail by Olofsson et al. (Citation2019a) allows for simple control over this bias with a single parameter. During discussions with the customer, the customer has stated that there are various subjective appearances within the grade A wall panel class, i.e. acceptable and desirable are not always the same thing. This could explain the difference of opinion between the experts and the product-grade – the experts may have classified the images based on desirability, whereas the product-grade indicates acceptability. Another difficulty when using sawn timber images as a reference is splitting the sawn timber into three panels, effectively leaving one wall panel hidden inside the timber. It is difficult to estimate how surface defects affect this hidden wall panel. The experts were possibly overly cautious regarding such surface defects. The high proportion of grade A sawn timber delivered from the CT Log using the image-trained PLS model shows that even if the subjective grading of the material is ambiguous and due to the splitting incomplete, calibrating the classification threshold results in a sorting outcome on a par with that given by the product-trained PLS model.
An important implication of the usefulness of images of sawn timber as a quality reference is their reusability. A database of sawn timber images could be used to create an appearance quality reference for many customers regardless of their drying requirements. The quality reference could be used to train individual machine learning models per customer, similar to the image-trained PLS model used in this study. This could result in several models giving suggestions as to how to saw a log after CT scanning. The sawmill could then select the sawing pattern to be used based on material availability (supply), delivery requirements (demand), and price. Based on the 93% material delivered from the Boardmaster for the PLS-based methods, it seems plausible to perform only one appearance grading in the CT Log. Removing the dry-sorting entirely for the image-trained PLS model would mean that the sawn timber shown in the CT Log column in would be delivered directly to the customer after drying. The customer would then receive 83% grade A sawn timber, which is still higher than that given by the rule-based approach, including the dry-sorting at 77% ().
Future studies should investigate a better way of handling rare but obviously poor quality or high-risk sawn timber. The rarity of such sawn timber makes it difficult to model by a machine learning method. The use of complementary rules, as in this study, is a product-specific solution which is in part what a machine learning approach hopes to eliminate. Removing such high-risk pieces using CT-scanning before sawing could make it possible to eliminate the dry-sorting entirely.
Future studies should also investigate the possibility of simulating the splitting process by splitting the virtual sawn timber pieces into approximate wall panels to see whether this would improve the grading results, thereby further utilising the 3D data available from the CT Log.
5. Conclusions
This study shows that a machine learning method (PLS) can be used to appearance grade sawn timber for a specific product before it is sawn using X-ray CT scanning and thereby plan the entire refinement process from the CT scanning of the log to the finished product. Furthermore, the product-adapted aspect of this machine learning approach can be implemented to create a training dataset without meticulous logistics and material processing. The results show that a PLS model trained using images as the quality reference of the sawn timber acquired from the sawmill's dry-sorting station is as good as, or even slightly better than, an otherwise identical implementation using the finished product-grade as training reference. The benefit of using a machine learning method trained using images as a reference is the simplicity of capturing the subjective and holistic quality requirements of the customer. This study indicates the future possibility of using an image data bank of sawn timber by several customers to make product-specific quality references for the training of machine learning models. Such models could make product-specific sawing and drying possible and possibly eliminate the need for dry-sorting for some customers.
Acknowledgments
The authors also gratefully acknowledge the support of CT-Wood – a centre of excellence at Luleå University of Technology for the development of X-ray computed tomography applications for use in the forest products industry.
Disclosure statement
No potential conflict of interest was reported by the author(s).
Additional information
Funding
References
- Anon.. (2018). Boardmaster. Accessed 12 June 2018, available at https://finscan.fi/products/boardmaster/?lang=en. Note: older predecessor to BoardmasterNOVA.
- Anon. (2019). Simca. Accessed 3 January 2019, available at https://umetrics.com/products/simca.
- Berglund, A., Broman, O., Oja, J. and Grönlund, A. (2015) Customer adapted grading of Scots pine sawn timber using a multivariate method. Scandinavian Journal of Forest Research, 30(1), 87–97.
- Breinig, L., Broman, O., Brüchert, F. and Becker, G. (2015a) Optimization potential for perception-oriented appearance classification by simulated sawing of computed tomography-scanned logs of norway spruce. Wood Material Science & Engineering, 10(4), 319–334.
- Breinig, L., Leonhart, R., Broman, O., Manuel, A., Brüchert, F. and Becker, G. (2015b) Classification of wood surfaces according to visual appearance by multivariate analysis of wood feature data. Journal of Wood Science, 61(2), 89–112.
- Broman, O. (2000) Means to measure the aesthetic properties of wood. Thesis (PhD), Luleå University of Technology.
- Geladi, P. and Kowalski, B. R. (1986) Partial least-squares regression: A tutorial. Analytica Chimica Acta, 185, 1–17.
- Lycken, A. and Oja, J. (2006) A multivariate approach to automatic grading of Pinus sylvestirs sawn timber. Scandinavian Journal of Forest Research, 21(2), 167–174.
- Olofsson, L., Broman, O., Oja, J. and Sandberg, D. (2021) The effect of class-balance and class-overlap in the training set for multivariate and product-adapted grading of Scots pine sawn timber. Wood Material Science & Engineering, 16(1), 58–63.
- Olofsson, L., Broman, O., Skog, J., Fredriksson, M. and Sandberg, D. (2019a) Multivariate product adapted grading of Scots pine sawn timber for an industrial customer, part 1: Method development. Wood Material Science & Engineering, 14(6), 428–436.
- Olofsson, L., Möller, C.-J., Wendel, C., Oja, J. and Broman, O. (2019b) New possibilities with CT scanning in the forest value chain. International Nondestructive Testing and Evaluation of Wood Symposium, 569–576. https://www.fs.usda.gov/treesearch/pubs/58690.
- Sandberg, D. and Teischinger, A. (2021) Chap. 22 Sawmilling. In: Springer Handbook in Wood Science and Technology (Heidelberg: Springer Verlag). In print.
- Swedish Sawmill Managers Association. (1994). Nordic Timber: Grading Rules for Pine (Pinus sylvestris) and Spruce (Picea abies) Sawn Timber: Commercial Grading Based on Evaluation of the Four Sides of Sawn Timber (Markaryd: Föreningen Svenska Sågverksmän).
- Ursella, E., Giudiceandrea, F. and Boschetti, M. (2018) A fast and continuous ct scanner for the optimization of logs in a sawmill. In 8th Conference on Industrial Computed Tomography (ICT 2018) at Wels, Austria, Volume 2.
- Wold, S., Sjöström, M. and Eriksson, L. (2001) PLS-regression: A basic tool of chemometrics. Chemometrics and Intelligent Laboratory Systems, 58(2), 109–130.