
 ?Mathematical formulae have been encoded as MathML and are displayed in this HTML version using MathJax in order to improve their display. Uncheck the box to turn MathJax off. This feature requires Javascript. Click on a formula to zoom.
ABSTRACT
Laboratory studies have shown that wood has hygroscopic properties. When used as a construction material in buildings, it can thus influence indoor relative humidity and temperature. Ventilation can affect indoor climate if the temperature differ between indoor and outdoor air. The coating of indoor wood may also affect its hygroscopic properties. Few studies of wood in real buildings have been conducted. The main aim of this experimental study was to explore the association between moisture content in indoor air and wood in two classrooms. The floor plan of the two classrooms was identical. In one classroom, all wood surfaces were untreated, whereas, in the other, they were treated with a transparent varnish. Sensors measured indoor air relative humidity, moisture content in the wood, and temperature in the air and wood in both classrooms. Linear regression analysis was performed to explore possible associations. Strong positive associations between indoor air relative humidity and the moisture content in wood in the untreated classroom were found. Weak positive associations were evident in the classroom with treated wood. Ventilation reduced these associations.
Introduction
Engineered wood products are increasingly used as structural elements in timber structures. Modern timber construction technologies utilizing gluelam and cross-laminated timber (CLT) are making it possible to create larger and taller buildings with timber. There has been an increase in the use of wood in large buildings, such as mid- and high-rise residential buildings, as well as public buildings, such as schools, care homes, student dormitories and commercial buildings. In Norway, the number of large structures in glulam and CLT has increased substantially in the last decade. The increase in timber construction is frequently motivated by favorable mechanical properties (high strength-to-weight ratio, machinability and dimensional stability), low climate gas emissions and versatile design options. Claims that the use of wood can have a positive impact on the indoor environment are also contributing to the rise in timber construction.
There is growing interest in how construction materials from wood influence the indoor environment. Our understanding of how exposed surfaces of hygroscopic materials, such as wood, impact indoor climate is incomplete, but there is a growing body of research focusing on the moisture buffering effect of hygroscopic materials and how such materials can affect indoor climate parameters, such as relative humidity and temperature (Nore et al. Citation2017; Cascione et al. Citation2019). It has been proposed that optimal utilization of moisture buffering materials combined with a relative humidity sensitive (RHS) ventilation system can reduce the ventilation rate by 30–40% and generate 12–17% energy savings during the heating period (Simonsen et al., Citation2001). Moisture buffering in an indoor environment can have a positive effect on indoor climate and hence on residents’ well-being and health. Hygroscopic materials can contribute to balancing the moisture level in the indoor air and thus inhibit both excessive moisture loads and dry indoor air.
Relative humidity indoors may also influence infectious diseases in different ways. Relative humidity of between 40% and 60% is recommended to reduce the survival time of viruses and thus the risk of disease (Koep et al. Citation2013). To avoid damage to the mucous membranes of the nose and dehydration of the outer eye, relative humidity of more than 30% is recommended, and to avoid nasal dryness, more than 10% is recommended (Spena et al. Citation2020). Several cross-sectional studies that have studied the relationship between indoor climate and symptoms in humans (Skyberg et al. Citation2003; Turunen et al. Citation2014; Savelieva et al. Citation2019) report common symptoms such as feelings of fatigue, heavy-headedness, eye irritation and dry facial skin. The most prevalent physical environmental factors reported were dry air, stuffy and dusty air and high temperature. In experimental studies, Wolkoff and coauthors described the mechanism related to the indoor environment and dry eyes (Wolkoff Citation2017, Citation2018). In general, symptoms are reported more frequently during winter and low relative humidity indoors during winter may be closely linked to symptoms (Koep et al. Citation2013). Excessive moisture levels have been proven to aggravate asthmatic symptoms among pupils in schools (Meklin et al. Citation2002; Kim et al. Citation2007; Finell et al. Citation2021).
The hygroscopic effect from exposed wood surfaces in the indoor environment is an inherent property of untreated wood that occurs under the fiber saturation point. At moisture levels below the fiber saturation point there are no capillary forces of free water in the cell cavities. The hygroscopic effect from wood is therefore governed by water transport in the wood material as a diffusion mechanism. The diffusion mechanism can be separated in three different processes: water vapor diffusion in the lumen, diffusion through the pit chamber and bound water diffusion within the cell wall of the wood material. The hygroscopic property of wood can be influenced by a range of factors related to material properties (e.g. moisture buffering capacity of the material, surface treatments) (Hameury Citation2007), indoor climate (e.g. ventilation rate, solar radiation, seasonal changes in exterior climate) and usage of indoor environment (e.g. the number of persons being in a room at the same time). There is a need to gain a better understanding of the interaction between hygroscopic materials, the factors influencing moisture buffering and the moisture level in indoor air in the built environment. One factor which connects the indoor air, the buffer capacity of wood and the energy savings potential is hygrothermal mass. Equivalent to hygrothermal mass is the recognized thermal mass. Hygrothermal mass needs an exchange of moisture and heat in order to provide energy storage in materials with moisture capacity, whereas thermal mass solely needs temperature to store heat in materials with heat storage. The range of storage is estimated to be in-between 4% and 30% depending on the material and boundary conditions (Kraniotis and Nore Citation2017).
Modern sensor technology allows for efficient and reliable monitoring of factors influencing the indoor environment. To understand and be able to utilize moisture buffering in building design, studies carried out in real-life settings are necessary (Cascione et al. Citation2019). Using modern sensor technology, it is possible to conduct in situ measurements of indoor climate factors in real-life settings. Such in situ measurements are currently adding to a growing body of data that can be used for research, and some studies of timber structures have been carried out using sensory data (Riggio and Dilmaghani Citation2020).
The present study is a case study carried out in a school building made from CLT, Hanstad Primary School, in the municipality of Elverum in Norway. The building was completed in 2017, and the classrooms were fitted with sensors to monitor the indoor environment. Since the school came into use in 2017, the indoor environment has been continuously monitored. The study period occurs in the cold season. For most of the study period, the temperature was lower outside than inside the classrooms. The low outside temperature implies that the water content in the outside air was low. When cold outside air is ventilated into a heated building, the water content in the inside air decreases and results in a dry indoor climate.
The study aims to utilize the in situ sensory data to improve our knowledge of how the use of hygroscopic construction materials impacts the indoor climate. The study explores the longitudinal relationship between indoor relative humidity (RF) and weather as well as the number of persons using the classrooms. Furthermore, in an intervention, the study sought to explore whether different coatings were associated with relative humidity.
Methods
The case study is conducted in a school building constructed solely with gluelam CLT. The building is an annex to an existing primary school owned by the municipality of Elverum in Norway. The outer walls are made from 320 mm thick CLT from Norway Spruce (Picea Abies L. Karst), with exposed wood surfaces on the inside. The exterior cladding is made from heartwood from Scots Pine (Pinus Silvestris). The ground and roof are insulated according to building regulations. In the façade of the school building is shown. The building has two floors with two classrooms of 70 m2 on each floor and three or four smaller rooms adjacent to the classrooms (cf. and ). All four classrooms have five windows and one door facing outside. The ceiling and walls in the classrooms are exposed wood from the CLT panels used in the walls. Two of the classrooms are facing the south and the other two are facing the north. The classrooms facing the north were chosen for the present study because these rooms are less exposed to direct sunlight. The classroom on the ground floor was used by 22 pupils in the sixth grade; the classroom on the first floor was used by 27 pupils in the seventh grade.
Figure 1. Hanstad Primary School, Elverum, Norway. Façade facing south (top left), west (top right), east (bottom left) and north (bottom right).
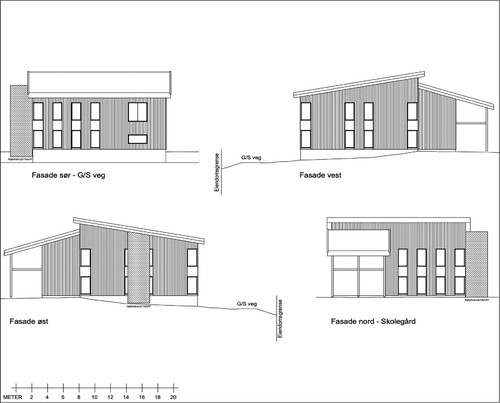
Figure 2. View of north façade January 2020. Classrooms 107 and 207 are located on the right-hand side of the building.
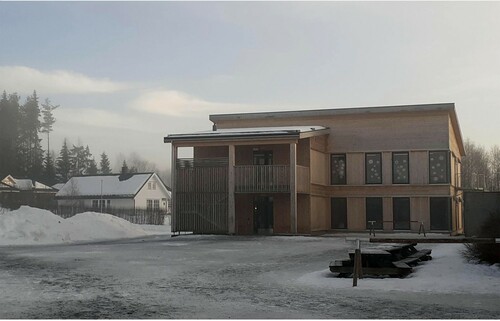
Table 1. Description of classrooms 107 and 207.
This study period runs from 28 September 2020 to 4 October 2020 – five weeks (weeks 1, 2, 3, 4 and 5, cf. ). During the first week (28 September to 4 October) both classrooms were used for teaching. In the second week (5 October to 11 October) both rooms were empty because of a school break. During the last three weeks (12 October to 1 November) both rooms were in use for teaching activities ( and ).
Figure 3. Layout of classrooms on the ground floor (left) and first floor (right). Classrooms 107 and 207 are the subject of this study.
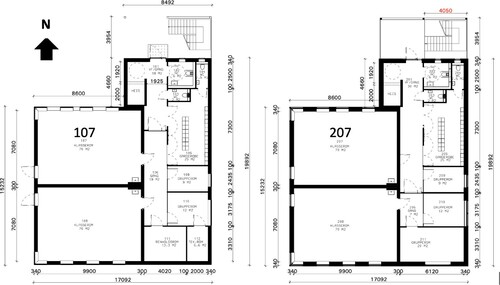
Figure 4. Interior of classroom 107.
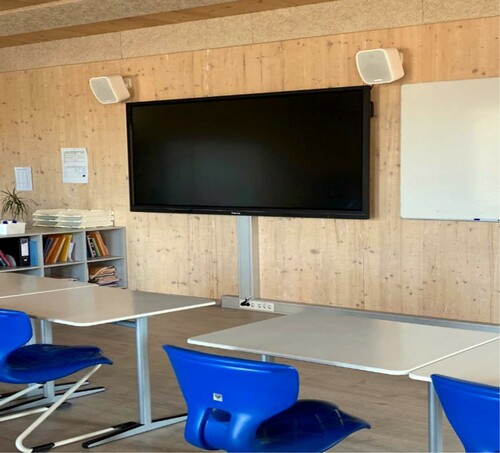
Table 2. Description of rooms during the study period (28 September to 1 November 2020).
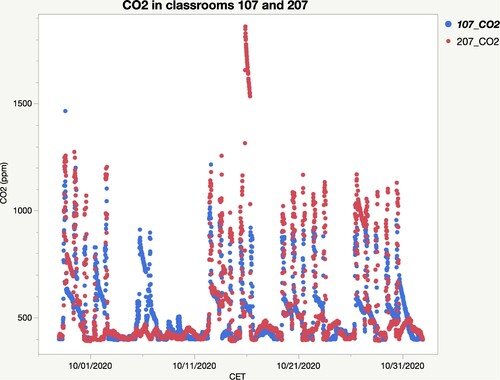
During the study period, the classrooms were in use in the daytime, from Monday through Friday. The classrooms were not in use during the weekends. Each classroom had a separate ventilation system, the systems were set to a constant air flow from 7 a.m. to 3 p.m. Monday through Friday. The air volume into the classrooms was 550 m3 per hour. The levels of CO2 in the room can be used as an indicator of the activity going on in the classrooms. In this case, CO2 levels of less than 500 ppm indicate that there are no persons inside the classroom. CO2 levels equal to or higher than 500 ppm indicate that there is an activity in the classroom ().
Figure 5. CO2 levels in classrooms 107 and 207 over 28 September 2020 to 1 November 2020.
The ceiling and walls were untreated in both classrooms in the first week (28 September to 4 October). During the second week, the ceiling and all the walls in the classroom on the ground floor (107) were treated with a transparent varnish. The classroom on the first floor (207) was left untreated. The treatment was intended to seal the hygroscopic surfaces and thus was introduced as an intervention in the study design. During the remaining three weeks of the study period, all hygroscopic surfaces in the classroom on the ground floor (107) were sealed by varnish treatment, and all hygroscopic surfaces in the classroom on the first floor (207) were untreated and thus open.
Eleven sensors were installed in each of the two classrooms and used to monitor parameters of relevance to the indoor climate in the classrooms. In the present study, sensors were used to measure the relative humidity in air, air temperature, wood temperature, electric resistance in wood and CO2-content in indoor air (cf. and ). Relative humidity in the air was measured close to the ceiling. Wood moisture content inside the classroom was calculated from data (temperature and electric resistance) that were captured by sensors that were mounted on the CLT wall inside the room, approximately two meters above floor level. Wood moisture content outside the classroom was calculated from data (temperature and electric resistance) that were captured by sensors mounted on the outside of the CLT wall, between the CLT wall and the exterior cladding.
Figure 6. Sensors mounted in the two classrooms: ground floor (107) and first floor (207). Red x indicates approximate measurement point (ceiling, wall inside, wall outside). Text in frames lists parameters measured.
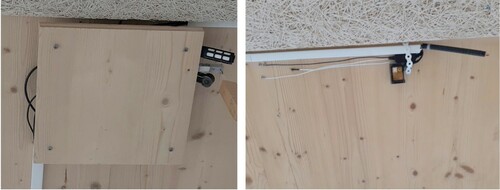
Table 3. Sensors used to measure indoor parameters in each room.
Descriptive data for each week are provided in . Relative humidity and temperature in the classrooms and on the outside are plotted in and .
Figure 7. Relative humidity outside (left) and inside (right) during 28 September to 1 November.
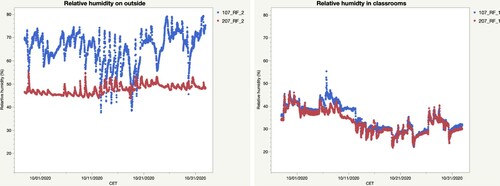
Figure 8. Air temperature outside (left) and inside (right) during 28 September to 1 November.
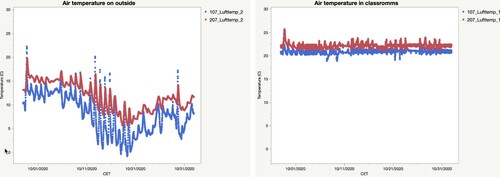
Table 4. Descriptive data, air temperature and relative humidity (RH) during the study period (28 September 2020 to 1 November 2020).
For most of the study period, the outside temperature was lower than inside the classrooms (cf. ). Air temperature in the two classrooms differed slightly (); in general, the temperature was higher in the classroom on the first floor than in the classroom on the ground floor. The uptake of water in air is affected by air temperature. In order to compare the amount of water in the indoor air in the two classrooms, the relative humidity must be corrected to account for this temperature difference. A corrected relative humidity () was estimated as proposed by Lawrence (Citation2005). Dewpoint temperature for each room was calculated as proposed by Sargent (Citation1980):
(1)
(1)
where represents the dewpoint temperature, t represents inside temperature in °C and
represents relative humidity of inside air in percentage.
Corrected relative humidity () was calculated as proposed by Lawrence using air temperature and dewpoint temperature:
(2)
(2)
The wood moisture content was normalized dividing wood moisture inside the classroom, , by wood moisture outside,
:
(3)
(3)
Results
The raw data for the calculations of Equations (1–3) are reported in .
Table 5. Relative humidity and temperature in indoor air and relative humidity in wood at different periods.
The wood moisture content was higher in room 107 (ground floor) compared with room 207 (first floor).
On weekdays in October and November, relative humidity in the indoor air varied during the day, RH in the indoor air was lower when the ventilation was switched on compared to periods without ventilation.
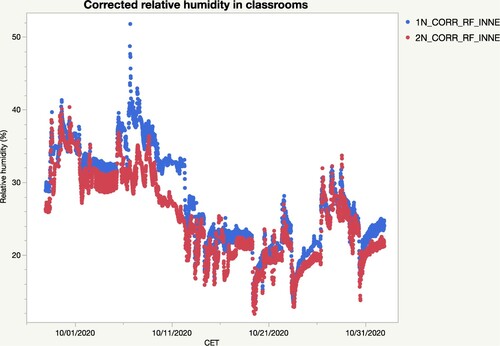
Corrected relative humidity in the classrooms calculated by Equations (1) and (2) are plotted in .
Figure 9. Corrected relative humidity in classrooms during 28 September to 1 November.
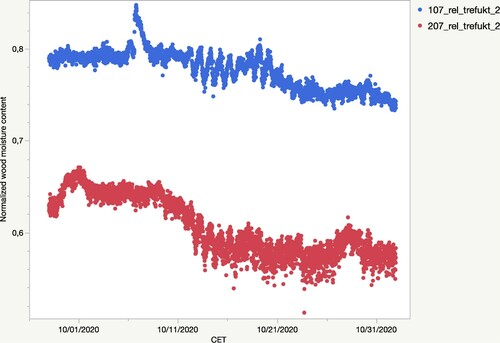
Normalized wood moisture content, calculated by Equation (3), is plotted in .
Figure 10. Normalized wood moisture content in classrooms during 28 September to 1 November.
The descriptive data indicates a shift in relative humidity after the intervention took place. Indoor relative humidity varied throughout the study period but decreased from the beginning to the end of the study. Relative wood moisture content decreased throughout the study period. and show the results of linear regression analysis on the relative humidity in untreated and treated classroom. For each classroom there are two regression models: one for levels of CO2 below 500 ppm and one for levels of CO2 above 500 ppm. CO2 levels vary according to the number of pupils in the classroom. CO2 levels are also a proxy for ventilation, and low CO2 levels indicate that ventilation is turned off.
Table 6. Associations between indoor relative humidity and relative wood humidity without and with ventilation in the untreated room. Analysed with a multiple linear regression model, study weeks No 1 and 4.
Table 7. Associations between indoor relative humidity and wood humidity without and with ventilation in the room with treated walls and roof. Analysed with a multiple linear regression model, study weeks No. 1 and 4.
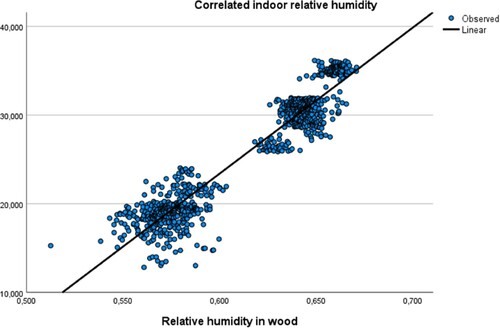
Two models were estimated for classroom 207 on the first floor. In this classroom, all wood surfaces were left untreated throughout the study period. The models had a high adjusted R-square. In the regression, when the room is empty (CO2 level < 500 ppm), the relative wood moisture content was the independent variable, which explains most of the variance. In the analysis when the room was in use (CO2 level > 500 ppm), the time proxy was the most important variable, indicating that changing outdoor climate influenced the relative humidity. The relative wood moisture content was statistically significant in both analyses. The regression line is plotted in the data for the untreated room in .
Figure 11. Regression line on the relative humidity in wood and relative humidity in indoor air, untreated room and no ventilation, study weeks No. 1 and 4.
Two models were estimated for classroom 107 on the ground floor. In this classroom, all wood surfaces were untreated throughout the first week of the study period and the wood surfaces were treated with varnish in the last four weeks of the study period. The varnish is expected to seal the hygroscopic surfaces, thus creating an intervention in the study design. In the regression analysis on classroom 107, both models had a high adjusted R-square. The time proxy explained most of the variance in both models. This indicates that the effect of the treatment of the wood surfaces influenced the relative humidity in the indoor air. Descriptive statistics show that the indoor RH in room 107 decreased after the intervention treatment. The impact of the relative wood moisture content when the classroom was empty was much lower compared with the corresponding value in the analysis of the untreated classroom.
Discussion
The relationship between indoor relative humidity and wood moisture content and treatments and changes in outdoor climate were analysed. The main purpose of this experimental study was to explore the effect of surface treatment of indoor wood in a classroom. The relative wood moisture content was statistically significant and had a positive association with indoor relative humidity.
The amount of CO2 in the indoor air will depend on human activity in the classrooms. CO2 is exhaled from the respiratory system and the total amount of CO2 increases with the number of persons. In addition to exhaling CO2, humans also exhale H2O, and the indoor relative humidity may increase in the classroom when there are many people in the room. When there are many people in the room, the ventilation system will be turned on. In the cold period of fall and winter, the ventilation system will add cold air with low absolute humidity and extract hot air with a relatively high amount of water (Cascione et al. Citation2019). It is difficult to predict the individual effect of the two variables that might influence indoor relative humidity.
Indoor relative humidity can impact human health. Very high relative humidity is associated with biological risks (e.g. indoors mold problems) and asthma or other respiratory symptoms (Kim et al. Citation2007; Mendell et al. Citation2011). Low relative humidity is associated with related symptoms, such as dry, irritated eyes (Wolkoff Citation2017) and increased risk of viral infections (Koep et al. Citation2013; Ahlawat et al. Citation2020).
The present study indicates that the exposed wood surfaces in the two classrooms affect relative humidity in the air, and wood absorbs and desorbs moisture over time. The moisture buffering effect appears to be higher for the classroom with untreated surfaces than for those with treated surfaces, thus have a higher potential hygrothermal mass. The moisture buffering effects are most predominant when the rooms are not ventilated. The buffering effect is influenced by the relative humidity and temperature in the outdoor air that is supplied through the ventilation system, and high ventilation rates will most likely weaken or cancel it out. The regression model for the treated room with much human activity exhibits a negative parameter estimate for the variable wood moisture content. In this case, the ventilation system apparently removes humidity from the indoor air, and the buffering effect is apparently reversed.
It should be kept in mind that the study does not study the effects from indoor climate on humans. How moisture buffering influences residents and users of indoor environments with respect to comfort criteria should be investigated. Conducting experiments in real-life settings can also include measurements of people’s perceived comfort and well-being using indoor rooms to evaluate whether hygroscopic wood surfaces have a beneficial effect on people.
Acknowledgements
The authors wish to thank Hanstad Primary School and Elverum municipality for their involvement in the study.
Disclosure statement
No potential conflict of interest was reported by the author(s).
Additional information
Funding
References
- Ahlawat, A., Wiedensohler, A. and Mishra, S. K. (2020) An overview on the role of relative humidity in airborne transmission of SARS-CoV-2 in indoor environments. Aerosol and Air Quality Research, 20(9), 1856–1861.
- Cascione, V., Maskell, D., Shea, A. and Walker, P. (2019). A review of moisture buffering capacity: from laboratory testing to full-scale measurement. Construction and Building Materials, 200, 333–343. https://doi.org/https://doi.org/10.1016/j.conbuildmat.2018.12.094
- Finell, E., Tolvanen, A., Ikonen, R., Pekkanen, J. and Ståhl, T. (2021) Students’ school-level symptoms mediate the relationship between a school’s observed moisture problems and students’ subjective perceptions of indoor air quality. Indoor Air, 31(1), 40–50.
- Hameury, S. (2007) Influence of coating system on the moisture buffering capacity of panels of Pinus sylvestris L. Wood Material Science and Engineering, 2(3–4), 97–105.
- Kim, J. L., Elfman, L., Mi, Y., Wieslander, G., Smedje, G. and Norbäck, D. (2007) Indoor molds, bacteria, microbial volatile organic compounds and plasticizers in schools? Associations with asthma and respiratory symptoms in pupils. Indoor Air, 17(2), 153–163.
- Koep, T. H., Enders, F. T., Pierret, C., Ekker, S. C., Krageschmidt, D., Neff, K. L., Lipsitch, M., Shaman, J. and Huskins, W. C. (2013) Predictors of indoor absolute humidity and estimated effects on influenza virus survival in grade schools. BMC Infectious Diseases, 13(1), 71.
- Kraniotis, D. and Nore, K. (2017) Latent heat phenomena in buildings and potential integration into energy balance. Procedia Environmental Sciences, 38, 364–371.
- Lawrence, M. G. (2005) The relationship between relative humidity and the dewpoint temperature in moist Air: A simple conversion and applications. Bulletin of the American Meteorological Society, 86(2), 225–234.
- Meklin, T., Husman, T., Vepsäläinen, A., Vahteristo, M., Koivisto, J., Halla-Aho, J., Hyvärinen, A., Moschandreas, D. and Nevalainen, A. (2002) Indoor air microbes and respiratory symptoms of children in moisture damaged and reference schools: microbial indoor air quality and respiratory symptoms of children. Indoor Air, 12(3), 175–183.
- Mendell, M. J., Mirer, A. G., Cheung, K., Tong, M. and Douwes, J. (2011) Respiratory and allergic health effects of dampness, mold, and dampness-related agents: a review of the epidemiologic evidence. Environmental Health Perspectives, 119(6), 748–756.
- Nore, K., Nyrud, A. Q., Kraniotis, D., Skulberg, K. R., Englund, F. and Aurlien, T. (2017) Moisture buffering, energy potential, and volatile organic compound emissions of wood exposed to indoor environments. Science and Technology for the Built Environment, 23(3), 512–521.
- Riggio, M. and Dilmaghani, M. (2020) Structural health monitoring of timber buildings: A literature survey. Building Research & Information, 48(8), 817–837.
- Sargent, G. P. (1980) Computation of vapour pressure, dew-point and relative humidity from dry- and wetbulb temperatures. Meterologic Magasin, 109, 238–246.
- Savelieva, K., Marttila, T., Lampi, J., Ung-Lanki, S., Elovainio, M. and Pekkanen, J. (2019) Associations between indoor environmental quality in schools and symptom reporting in pupil-administered questionnaires. Environmental Health, 18(1), 115.
- Simonson, C. J., Salonvaara, M. and Ojanen, T. (2001). Improving Indoor Climate and Comfort with Wooden Structures (Espoo: VTT Publications 431 Technical Research Centre of Finland).
- Skyberg, K., Skulberg, K. R., Eduard, W., Skåret, E., Levy, F. and Kjuus, H. (2003) Symptoms prevalence among office employees and associations to building characteristics. Indoor Air, 13(3), 246–252.
- Spena, A., Palombi, L., Corcione, M., Carestia, M. and Spena, V. A. (2020) On the optimal indoor Air conditions for SARS-CoV-2 inactivation. An enthalpy-based approach. International Journal of Environmental Research and Public Health, 17(17), 6083.
- Turunen, M., Toyinbo, O., Putus, T., Nevalainen, A., Shaughnessy, R. and Haverinen-Shaughnessy, U. (2014) Indoor environmental quality in school buildings, and the health and wellbeing of students. International Journal of Hygiene and Environmental Health, 217(7), 733–739.
- Wolkoff, P. (2017) External eye symptoms in indoor environments. Indoor Air, 27(2), 246–260.
- Wolkoff, P. (2018) Indoor air humidity, air quality, and health – An overview. International Journal of Hygiene and Environmental Health, 221(3), 376–390.