
 ?Mathematical formulae have been encoded as MathML and are displayed in this HTML version using MathJax in order to improve their display. Uncheck the box to turn MathJax off. This feature requires Javascript. Click on a formula to zoom.
ABSTRACT
Stricter energy efficiency requirements of buildings have raised concerns about their effects on indoor air quality (IAQ). We studied measured and perceived IAQ in three low-energy wooden test buildings using three ventilation levels (0.5, 1.0, and 2.0 (dm3/s)/m2). IAQ measurements included VOC (volatile organic compounds) air sampling and continuous measurements of several IAQ indicators. Perceived air quality (PAQ) was investigated with a sensory panel of untrained volunteers. The results show that the TVOC (Total VOC) concentrations were relatively low in two of the buildings already at the beginning of the study (100–141 µg/m3), and the concentrations decreased in all test buildings when ventilation was increased from the lowest level. The third building made of pinewood timber showed higher VOC concentrations (340–857 µg/m3), especially for terpene compounds that are generally present in pinewood emissions. In the PAQ assessment, the percentage of people dissatisfied (PD) with the air quality decreased with increased ventilation in all studied buildings. However, at the lowest and highest ventilation, the pinewood building had the second-lowest PD despite higher VOC levels. The findings of this study can be utilized in interpreting the effects of ventilation design and material selection on IAQ in low-energy buildings.
1. Introduction
It has been estimated that the building sector contributes about 36% of greenhouse gas emissions and approximately 40% of final energy consumption in Europe, and heating and cooling accounts for about 50% of annual energy consumption (The European Parliament and the Council of the European Union Citation2018, European Commission Citation2019). Therefore, improving the energy efficiency of buildings provides significant potential for climate change mitigation. In European Union, the objective is to reduce greenhouse gas emissions by 40% by 2030, compared to the 1990 level (The European Parliament and the Council of the European Union Citation2018), which means that profound changes are necessary for power generation and energy use in various sectors. A crucial factor to reach this target is the European parliament’s Directive 2010/31/EU, where it is stated that all new buildings starting from the end of the year 2020 must be “nearly-zero-energy buildings (NZEB)” (The European Parliament and the Council of the European Union Citation2010).
NZEB is a building with very high energy performance, and there exists a wide variety of design strategies and concepts to fulfil the requirements of NZEB standards (Moran et al. Citation2017). One commonly used and clearly defined concept is the Passive House Standard (Colclough et al. Citation2018) which is based on a highly insulated and airtight envelope equipped with mechanical ventilation with heat recovery (MVHR) (Moreno-Rangel et al. Citation2020). These principles result in improved energy performance because of the reduced space heating demand and heating energy consumption (Colclough et al. Citation2018).
European Union’s directives of building energy performance mostly focus on the energy sources and consumption in operation, while less attention is given to energy used during the construction phase and the embodied energy in buildings. As environmental design strategies and building life cycle assessments have become more common, the emphasis on sustainable materials has increased in the construction sector. In this context, wood is the obvious choice because it is natural low-carbon material that is renewable, reusable, and recyclable. Wooden building products typically require less energy to manufacture compared to traditional building materials, and wood waste serves several purposes after the building’s life cycle (Salazar and Meil Citation2009). Additionally, wood is already widely used in the construction industry and a variety of different products are available in the markets. Moreover, the demand for wood has further increased with the emergence of engineered wood products (Hildebrandt et al. Citation2017).
In addition to the energy efficiency and sustainability point of view, it is also necessary to consider how these factors interact with the indoor air quality (IAQ) of the buildings, and the comfort and health of occupants. Low-energy requirements have raised some concerns about IAQ because of the increased airtightness of building envelopes and the possibility of decreasing air exchange rates due to energy savings (Ortiz et al. Citation2020). It is known that indoor concentrations of volatile organic compounds (VOCs) and other pollutants can be frequently higher compared to corresponding outdoor concentrations (Campagnolo et al. Citation2017). Therefore, this ratio may be further increased with energy efficiency standards, and highly elevated concentrations have been measured in several low-energy buildings with low air exchange rates (Kaunelienė et al. Citation2016). Additionally, it has been noticed that energy renovations of older buildings have caused adverse effects on IAQ (Földváry et al. Citation2017, Du et al. Citation2019). In contrast, recent studies have reported better IAQ in newly built low-energy or passive house buildings compared to conventional houses (Holopainen et al. Citation2015, Langer et al. Citation2015, Wallner et al. Citation2015).
Fresh air is required to maintain the health of the occupants and the building itself. As improved airtightness eliminates air infiltration through structures, well-functioning ventilation is a vital factor for good IAQ in low-energy buildings. To avoid exposure to high concentrations of pollutants and to improve IAQ in general, several studies have highlighted the importance of adequate ventilation rates in low-energy buildings (Derbez et al. Citation2014a, Citation2014b, Langer et al. Citation2015, Kaunelienė et al. Citation2016, Földváry et al. Citation2017, Moreno-Rangel et al. Citation2020, Yang et al. Citation2020). Ventilation strategies and requirements for air exchange rates may vary significantly between different countries, but 0.5 air changes per hour (h−1) is frequently used as a minimum value in European countries (Dimitroulopoulou Citation2012). Deficiencies of ventilation systems are not exceptional, and the problems could be commonly avoided with proper instruction and guidance to prevent problems in installation and commissioning, which would further inhibit issues with operation and performance (Moreno-Rangel et al. Citation2020). In addition, frequent inspection and maintenance of ventilation systems by qualified professionals would be helpful to achieve designed airflows and proper ventilation during occupancy (Derbez et al. Citation2014b).
As a building material, wood interacts with IAQ and adds another factor to the discussion. Wood is a hygroscopic material, so it can store and release moisture when the relative humidity (RH) of indoor air changes. Therefore, large surfaces of wood can be used to even out diurnal and longer time span variations of indoor RH (Alapieti et al. Citation2020). In addition, different wood species emit a wide variety of VOCs, and the emissions of freshly dried timber made from softwood, such as pine and spruce, can be considerable (Steckel et al. Citation2011). Main VOCs emitted from softwoods are aldehydes, such as hexanal, and terpenes, such as α-pinene and D-limonene (Pohleven et al. Citation2019). In high concentrations, the aforementioned chemicals are considered eye, respiratory system and skin irritants (Adamova et al. Citation2020). While these compounds are frequently measured from the indoor air of different buildings, their concentrations, especially those of terpene compounds, very rarely exceed corresponding short-term critical exposure limits (CELs) (Schlink et al. Citation2004, Geiss et al. Citation2011, Krol et al. Citation2014, Cometto-Muniz and Abraham Citation2015, Trantallidi et al. Citation2015, Mandin et al. Citation2017, Wang et al. Citation2017). Additionally, exposure to some VOCs emitted from wood has been associated with health benefits, such as physiological and psychological relaxation (Joung et al. Citation2014, Ikei et al. Citation2016).
The scope of our study was to: (1) examine material emissions and VOC concentration profiles in low-energy wooden buildings five years after construction; (2) determine differences in IAQ between different structural and material selections of similar buildings; (3) investigate how ventilation rates affect measured and perceived IAQ of the test buildings.
2. Materials and methods
2.1. Test buildings
The study was carried out during the winter and spring 2016 (between February and May) in three low-energy wooden test buildings () located at the Aalto University campus (Espoo, Finland). The buildings were built in 2011 for moisture and temperature behaviour experiments of common types of highly insulated wooden structures, and they had been unused without heating and ventilation for two years prior to our experiments. The three one-room test buildings (10.2 m2×2.8 m) were located next to each other in the same direction with a distance of five meters ().
Figure 1. The test buildings.
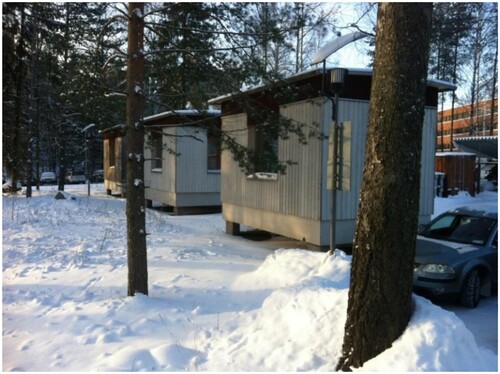
Figure 2. Sketch of the test buildings.
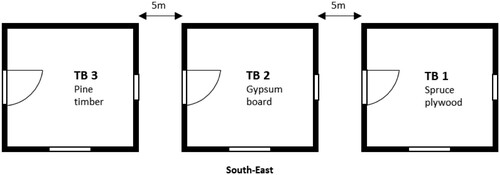
The main difference between the test buildings was their wall and roof structures, and interior cladding materials. Two of the buildings had “lightweight” timber structures with wooden posts and girders (TB 1 and TB 2). One of these buildings used 15-mm-thick gypsum boards (TB 2) as a cladding material for interior walls and ceiling, and the other had 15-mm-thick spruce plywood (TB 1). The third test building (TB 3) was constructed with an inside massive timber layer of 128-mm-cross-laminated pine logs, which worked as the load-bearing structure and interior material of walls and ceiling. The outer side of the timber frame was covered with an additional insulation layer, outer cladding of the walls, façade, and roof. All test buildings had identical floor elements where the inside cladding consisted of laminated veneer lumber (LVL) board covered with spruce boards. The interior walls and ceiling were uncoated, but the spruce floors were partly coated with wood oil and wood lye identically in the three test buildings. Each building had a similarly placed wooden table but otherwise, the buildings were unfurnished.
U-values (0.1 W/m2K for wall and floor elements, 0.09 W/m2K for roof elements) and structures’ airtightness (n50 = 0.6 h−1) were designed to be identical in each building and to fulfil the regulations of the Passive House Standard (Passive House Institute 2016). All test buildings had mechanical supply and extract ventilation units (Plaza eco EDE, Enervent, Porvoo, Finland) equipped with rotary heat recovery. During the study, the buildings were unoccupied except for a few short visits for air sampling and assessment of perceived air quality. A detailed description of the test buildings’ structures and features is available in a study by Winter et al. (Citation2012).
2.2. Ventilation experiments and experimental design
Three ventilation levels (VL 0.5, VL 1.0, and VL 2.0) were set up in the test buildings for the ventilation experiments. Design values for supply air were 0.5, 1.0, and 2.0 (dm3/s)/m2, which would result in air change rates of 0.64, 1.29, and 2.57 h−1, respectively. The lowest supply air rate was selected to cope with the minimum requirements for living areas of the National building code of Finland, Indoor climate and ventilation D2 (0.5 (dm3/s)/m2, 0.5 h−1) (Ministry of the Environment Citation2011). The exhaust air flows were 10% higher to maintain a slightly negative pressure compared to outdoors, as instructed in the building code in 2016 (Ministry of the Environment Citation2011). The ventilation levels were adjusted and set up before the experiments using an anemometer (LCA 6000 VA, Airflow Developments Ltd, Buckinghamshire, UK).
The air flows were rechecked later because the airflow adjustment using an anemometer was estimated to be uncertain. This time the air flows were measured from the HVAC system’s airflow measurement units (PRA-100, Halton, Helsinki, Finland) with Swema 3000 instrument (Farsta, Sweden). The actual air flows turned out to be smaller than the target values. However, the supply air flows approximately doubled between the ventilation levels in all test buildings, and the exhaust air flows were higher as planned to achieve negative pressure inside the buildings. Therefore, the experiments were continued using these airflows. The ventilation levels, including target air flows and actual airflows are presented in .
Table 1. Designed and actual air flows and air change rates on different ventilation levels.
The effect of the ventilation levels on IAQ was studied using three methods:
Impact of ventilation intensity on the perceived air quality (PAQ) was assessed with a sensory panel. The PAQ assessments were divided into three sessions. Each session included one ventilation level, and the panellists assessed the air acceptability separately in all test buildings during one session. The order of the test building visits varied between the panellists, and they were not aware of the changes made in ventilation. The evaluations were done within 90 s after entering the test building to avoid getting accustomed to the indoor air. Between the assessments in different test buildings, the panellists spent a few minutes in outdoor air to recover their olfaction. The ventilation levels for every session were adjusted to the ventilation units of the buildings 24 h before starting a session. The PAQ assessments were completed before starting the IAQ measurements to avoid disturbances. To minimize the differences between the results of measured IAQ and assessed PAQ, the same ventilation levels were used simultaneously in all test buildings throughout the study.
After the PAQ evaluations were completed, the measurements started with continuous monitoring of IAQ parameters (TVOC, temperature, relative humidity, carbon dioxide, and formaldehyde). Monitoring was performed in one test building at a time (starting from TB 1) through all ventilation levels before the equipment was relocated to the next test building. During the monitoring, ventilation was kept at the same level in each test building to maintain similar conditions. Therefore, each test building went through the ventilation cycles three times during the measurements. The test buildings were monitored until four days of data were collected at each ventilation level. In some cases, collecting the data took more than four days because of complications with the devices.
VOC air samples were taken simultaneously in all test buildings during the last day of continuous measurements at the three ventilation levels when the studied ventilation level had been on for at least four days. Two measurement methods (air samples and continuous monitoring) for VOCs were used to achieve more precise data, although the methods are not completely comparable. While the air samples are a standardized method and provide information about individual compounds, the result only describes the average situation during the sampling. With continuous measurements using a TVOC sensor, it was possible to observe temporal variations over a longer time period.
The PAQ evaluations were carried out between 9 February and 10 March, and the IAQ measurement took place between 10 March and 2 May.
2.3. Continuous indoor air quality monitoring
Chemical and physical indoor air parameters (TVOC, temperature (T), relative humidity (RH), carbon dioxide (CO2), and formaldehyde) were continuously monitored using devices presented in . Indoor air TVOC concentration, T, RH, and CO2 were measured with IQ 610 probe using an Advanced Sense meter (GrayWolf Sensing Solution, Sheldon, LA, USA). Formaldehyde was measured with an FM-801 formaldehyde meter (GrayWolf Sensing Solution). The monitored results were saved using a logging interval of one minute.
Table 2. Used devices and their specifications.
The photoionization detector (PID) sensor used to measure TVOC concentrations was calibrated with isobutylene, and therefore, it measured concentrations in isobutylene equivalents. As the TVOC concentrations are commonly expressed in toluene equivalents, the results were converted using a correction factor provided by the sensor manufacturer and molar masses of toluene and isobutylene. Toluene equivalent concentrations were calculated using the following equation:
where Ctoluene is toluene equivalent concentration [µg/m3], Cisobutylene is isobutylene equivalent concentration [µg/m3], CFtoluene is the correction factor for toluene ( = 0.53), Mtoluene is the molar mass of toluene, and Misobutylene is the molar mass of isobutylene.
2.4. Air sampling of volatile organic compounds
VOCs were actively sampled at a flow rate of 200 mL/min on Tenax TA sorbent tubes using pumps (GilAir Plus, Sensidyne, St. Petersburg, FL, USA/ Acti-voc, Markes, Llantrisant, UK). The sampling time was 40 min, which resulted in a sample volume of 8 L. Air samples were taken from the central area of the test buildings at a height of approximately one meter. VOC sampling was done in all test buildings on all ventilation levels, which resulted in nine samples altogether.
The Tenax TA sorbents were analysed according to ISO 16000-6:2011 standard using thermal desorption – gas chromatography – mass spectrometry (TD-GC-MS) and DB-VRX column (60 m × 0.25 mm × 1.40 µm, Agilent technologies). The compounds were identified using reference compounds (Indoor Air Standard, 50 components, 49148_U, Sigma-Aldrich, St. Louis, MO, USA) and NIST 2011– Mass Spectral Library Automated Mass Spectral Deconvolution and Identification System (AMDIS). The concentrations of individual compounds were reported as toluene equivalents. The TVOC values were the sum of the concentrations of the individual compounds eluting between n-hexane and n-hexadecane. The limit of detection for toluene was 0.23 µg/m3.
2.5. Perceived air quality and statistical analysis
Perceived air quality was studied with an untrained sensory panel of 13 adult volunteers (9 males and 4 females). The age range of the volunteers was between 21 and 32 years (mean 25.9, median 26). Twelve out of the 13 subjects were non-smokers. All volunteers were not able to participate in the study on all ventilation levels, so an actual number of participants varied between 10 and 13 (13 participants with VL 0.5, 11 participants with VL 1.0, and 10 participants with VL 2.0). The procedure for sensory testing was based on ISO 16000-30:2014. The panellists evaluated air acceptability on a continuous scale divided into two parts: from clearly unacceptable (−1) to just unacceptable (0) and from just acceptable (0) to clearly acceptable (+1). The PAQ scores were collected with the precision of one decimal. The mean values of PAQ scores were further used to calculate the percentage of dissatisfied (PD) with the air quality.
Collected data were analysed using Origin 2020b software (OriginLab Corporation, Northampton, MA, USA). To determine significant differences in the perceived air quality between the test buildings and/or ventilation levels, PAQ scores were tested with a non-parametric Kruskal–Wallis one-way analysis of variance (ANOVA) as the scores were not normally distributed. Dunn’s test was used as a post-hoc means comparison to pinpoint significant differences between specific groups. The significance level was set to be 0.05 (p < 0.05).
3. Results
3.1. Continuously measured indoor air quality
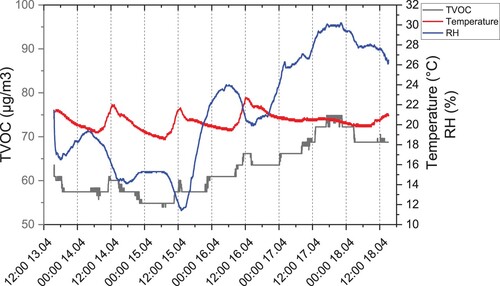
The results of continuous measurements for TVOC, T, and RH in the test buildings are presented in . Measured formaldehyde levels remained under the detection limit (12 µg/m3) throughout the study. CO2 concentrations were low and close to general outside concentrations as the test buildings were unoccupied.
Table 3. Result of continuous IAQ measurements.
In general, the mean TVOC concentrations were relatively low in TB 1 and TB 2, while concentrations in TB 3 were approximately two times higher. In TB 3, TVOC values systematically decreased with increased ventilation. TB 1 showed slightly lower concentrations with increased ventilation, and mean concentrations in TB 2 showed less variation from changes in ventilation.
Test Building 1
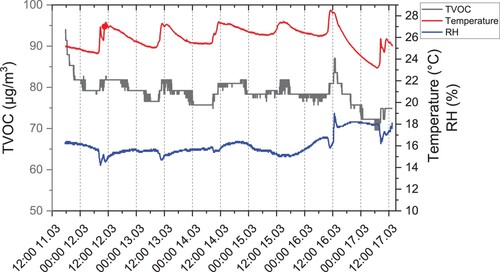
The effect of ventilation on the TVOC concentrations of TB 1 was small, but some differences were visible in the results. The mean concentration was higher at VL 0.5, while VL 1.0 and VL 2.0 had similar TVOC levels. When the measurements started at the beginning of the research period at VL 0.5, TVOC concentration dropped from 94 µg/m3 to around 80 µg/m3 in a few hours and remained relatively stable for the rest of the phase (). Small temporal variations in the concentration seemed to follow diurnal temperature changes. It was noticed on several occasions during the study that especially smaller variations in TVOC concentration followed temperature and RH changes.
Figure 3. TVOC, temperature, and RH in Test Building 1 with VL 0.5.
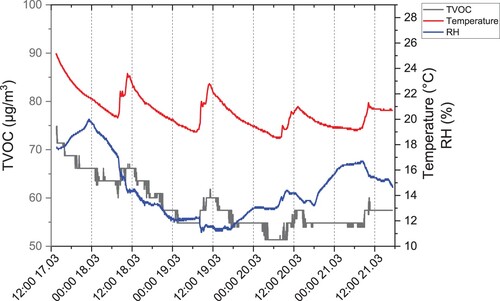
TVOC concentration decreased slowly after the ventilation was changed to VL 1.0 until concentrations between 50 and 60 µg/m3 were reached. However, this decrease probably is to some extent an outcome of decreasing temperature and RH than a change in ventilation (). Because of challenges with the heating system, the temperature was quite high during VL 0.5, and the mean temperature was 5.4°C lower during VL 1.0. No clear effect was detected after ventilation was increased to VL 2.0. The TVOC varied between 51 and 65 µg/m3 but also in this case the variations seemed to correlate more with temperature and humidity data than with ventilation.
Figure 4. TVOC, temperature, and RH in Test Building 1 with VL 1.0.
Test Building 2
TVOC concentration remained at a low level in TB 2 (54–75 µg/m3) throughout the ventilation experiments, and ventilation’s airflow did not have a significant effect on it. At VL 0.5 and VL 1.0, TVOC concentration changed marginally back and forth. During VL 2.0, the TVOC level increased slightly toward the end of the research phase simultaneously with increasing RH ().
Figure 5. TVOC, temperature, and RH in Test Building 2 with VL 2.0.
Test Building 3
TVOC concentrations were higher in TB 3, and the effect of ventilation rate was more visible than in the other test buildings. Before starting the continuous measurements at VL 0.5, ventilation had been on VL 2.0 as the measurements were previously going on in TB 2. After reducing the ventilation to VL 0.5, TVOC concentration increased from 100 to 165 µg/m3 in about 30 h (). From there, the TVOC level increased slowly to around 170–180 µg/m3.
Figure 6. TVOC, temperature, and RH in Test Building 3 with VL 0.5.
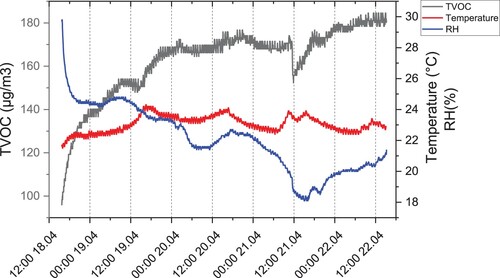
When ventilation was changed from VL 0.5 to VL 1.0, TVOC concentration started to decrease quickly from 181 µg/m3 and remained between 120 and 160 µg/m3 for the rest of the research phase ().
Figure 7. TVOC, temperature, and RH in Test Building 3 with VL 1.0.
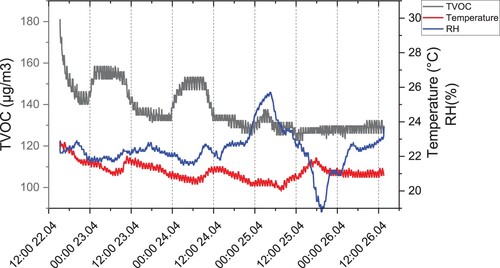
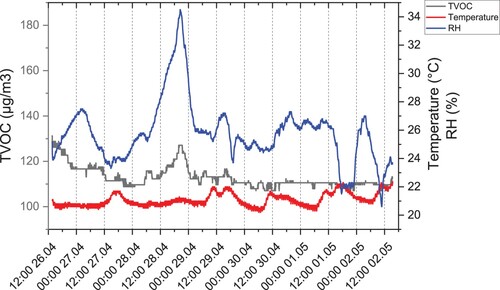
TVOC concentration continued to decrease from about 130 to 110 µg/m3 when ventilation was increased from VL 1.0 to VL 2.0. Some variation occurred after that, and the TVOC level seemed to correlate with the changes in the RH ().
Figure 8. TVOC, temperature, and RH in Test Building 3 with VL 2.0.
3.2. Volatile organic compounds from air samples
VOC concentrations from the test buildings with different ventilation levels are presented in . The highest TVOC values were measured with the lowest ventilation in all test buildings. The TVOC levels were significantly higher in the TB 3 compared to other test buildings, and the concentrations decreased with increased ventilation. In TB 3, TVOC levels nearly halved between VL 0.5 and VL 1.0, whereas the reduction between VL 1.0 and VL 2.0 was more moderate but remarkable. In TB 1 and TB 2, the TVOC levels were relatively low and closer to each other. In TB 1, the TVOC concentration decreased with increased ventilation. In TB 2, TVOC levels decreased when the ventilation level was increased from VL 0.5 to VL 1.0, but the TVOC slightly increased when ventilation was set to the highest level.
Table 4. Concentrations of identified compounds.
In general, the same compounds were identified from the air samples in all test buildings with varying concentrations. Concentrations in TB 1 were low through all ventilation levels. With VL 0.5, the highest emitting compounds were acetic acid, α-pinene, pentadecane, hexadecane, and hexanal. Concentrations of all identified compounds decreased or remained at the same level with increased ventilation.
Concentration levels and identified compounds in TB 2 were similar to TB 1. Measured concentrations of all compounds decreased when ventilation was changed from VL 0.5 to VL 1.0, but most of the identified compounds and the TVOC concentration increased on the highest ventilation. α-pinene and pentadecane had the highest concentrations with VL 0.5 and VL 1.0, and pentadecane continued to be the most dominant compound with VL 2.0.
Identified compounds in the emissions of TB 3 were mostly the same as in the other test buildings, but the concentration levels of overall emissions and most abundant compounds were significantly higher. The emissions were dominated by terpene compounds α-pinene and 3-carene followed by D-limonene and β-pinene. Additionally, the concentrations of hexanal and tetradecane were higher compared to the other test buildings. The concentrations of all compounds decreased drastically between VL 0.5 and VL 1.0, and terpene levels continued to decrease at the highest ventilation level. On VL 2.0, the concentrations of other terpene compounds were approximately the same as with VL 1.0.
3.3. Perceived air quality assessment
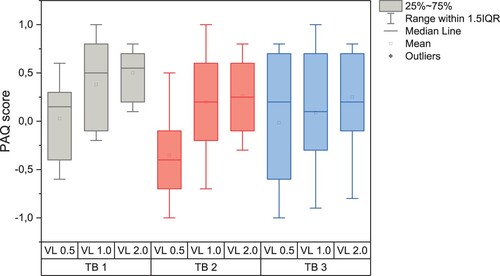
shows the PAQ score distribution under different ventilation conditions in the test buildings. The lowest PAQ scores in all test buildings resulted in the lowest ventilation VL 0.5. In TB 1 and TB 2, considerable increases in PAQ scores were observed when ventilation was changed to VL 1.0, and the scores continued to slightly increase on VL 2.0. In TB 3, mean values of PAQ scores also increased with increased ventilation, but the differences between the ventilation levels were smaller. The lowest PAQ score was observed in TB 2 with VL 0.5 (mean −0.4), and the highest PAQ score was observed in TB 1 with VL 2.0 (mean 0.5). The differences between the test buildings were not statistically significant but significant differences in average PAQ scores were found between the ventilation levels (p < 0.05). Dunn’spost hoc test revealed significant pairwise differences between VL 0.5 and VL 2.0.
Figure 9. PAQ score distribution in the test buildings on different ventilation levels.
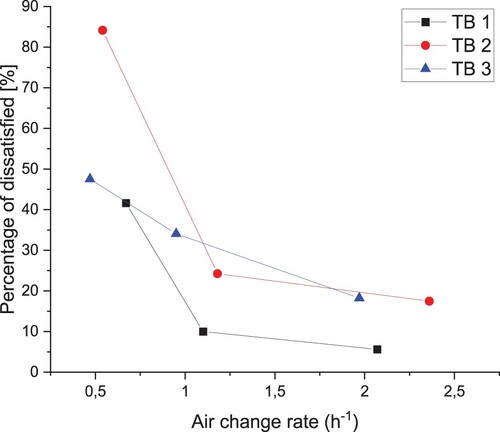
shows the percentages of dissatisfied air quality in the test buildings with different ventilation levels (presented as actual air change rates). The PAQ scores resulted in the highest percentages of dissatisfied with VL 0.5 and the lowest percentages on VL 2.0. On VL 0.5, TB 2 had the highest percentage of dissatisfied (84.1%), followed by TB 3 (47.5%) and TB 1 (41.6%). The percentage decreased substantially between VL 0.5 and VL 1.0 in TB 1 and TB 2, and the change was more moderate between VL 1.0 and VL 2.0. In TB 3, the decrease in the percentage of dissatisfied was more linear. On VL 1.0, the percentages of dissatisfied in the test buildings were between 10.0% and 34.1%, and between 5.6% and 18.2% on VL 2.0.
Figure 10. Percentages of dissatisfied with the air quality in the test buildings. The ventilation levels are presented as actual air change rates.
4. Discussion
Energy efficiency and energy savings of buildings is a highly relevant topic on European and international levels. Requirements for NZEB and other low-energy buildings have raised some concerns about their effect on IAQ. Therefore, we studied measured and perceived IAQ in three low-energy wooden test buildings that were built to fulfil the requirements of the Passive House Standard. Moreover, we observed how three air change rates affect the IAQ. The presented results show that VOC levels can be considerable/remarkable in a building made of pine logs even after several years, and increasing ventilation affects both measured and perceived IAQ to a certain extent. Differences were observed in all test buildings, especially when the ventilation was increased from the minimum level.
The results from the continuous TVOC measurements showed that concentrations in TB 1 and TB 2 were close to each other, while TB 3 showed higher levels that decreased with increased ventilation. The immediate effect of ventilation was observed in TB 3, and TVOC levels decreased when the ventilation level was increased. Additionally, TVOC levels increased at the beginning of the measurement at VL 0.5 as the ventilation had been at the highest level prior to the measurement, indicating that emission levels inside a building can recover quite rapidly after decreasing ventilation. TVOC levels in TB 1 and TB 2 appeared to be rather independent of the changes in ventilation, which was probably a consequence of a relatively low baseline level. With smaller concentrations, TVOC levels seemed to correlate positively with diurnal and longer timespan variations of temperature and RH. Similar correlations have been observed in a previous study, where VOCs were measured with PID sensors as they were in our study (Berry et al. Citation2017). It is known that surrounding temperature and RH affect VOC emissions, and the outcome varies between different materials and chemicals of interest (Van der Wal et al. Citation1997, Haghighat and De Bellis Citation1998, Wolkoff Citation1998, Fang et al. Citation1999, Suzuki et al. Citation2014, Markowicz and Larsson Citation2015, Huang et al. Citation2016). However, it has also been shown that the response of PID sensors is sensitive to operational parameters such as temperature and RH (Lewis et al. Citation2016). Therefore, it is difficult to determine whether these observed variations in TVOC levels originate from actual changes in VOC emissions or are they a result of the sensor performance. Additionally, TVOC levels of TB 1 and TB 2 were close to concentrations from the air samples, but the concentrations measured in TB 3 remained lower than the air samples. However, the results of these measuring methods are not completely comparable. PID sensors are not selective because they ionize everything with equal or less ionization energy than the lamp’s output (Spinelle et al. Citation2017), and therefore, it is hard to define what compounds are they exactly responding to.
TVOC concentrations of the air samples mostly decreased with increased ventilation in all test buildings. The concentrations almost halved in TB 2 and TB 3 when ventilation was increased from the lowest level, while the effect was smaller in TB 1. The concentrations continued to decrease at the highest ventilation level in TB 1 and TB 3, but an increase was observed in TB 2. This resulted from slight increases in concentrations of the majority of the identified and unidentified compounds, but the cause for this was unclear. It is possible that higher ventilation caused stronger negative pressure that affected the emissions. However, a similar effect was not detected in other buildings. In TB 1 and TB 2, TVOC concentrations remained well below the Finnish guideline value of 400 µg/m3 at all ventilation levels (Ministry of Social Affairs and Health Citation2015). In TB 3, the TVOC concentrations exceeded the guideline value with the two lower ventilation levels, but the concentration decreased below the guideline value with the highest setting.
A decreasing trend was also observed within the identified compounds, as the majority of VOCs in all test buildings decreased when ventilation was increased from the lowest level. However, concentrations of some compounds showed slight increases between VL 1.0 and VL 2.0. Engelmann et al. (Citation2013) had somewhat similar findings when they studied the effect of three ventilation levels on indoor VOCs in two low-energy wooden frame homes. They noticed that increasing ventilation rates appeared to reduce concentrations of the most VOCs, but variation occurred between the studied chemicals. The air change rates were lower than in our study (0.25–0.69 h−1). In general, the same compounds were identified in all test buildings. The VOC patterns in TB 1 and TB 2 were quite similar for both identified compounds and TVOC concentrations at different ventilation levels, indicating that the interior materials (plywood or gypsum board) were not the main emission source as otherwise, the buildings had mainly the same materials. Identified VOCs in TB 3 were mostly the same as in the other test buildings, but the concentrations of certain compounds and TVOC differed drastically. Concentrations of hexanal and terpene compounds (α-pinene, β-pinene, D-limonene, and 3-carene) were significantly higher than in the other test buildings, and their concentrations decreased steadily with increased ventilation. These compounds are known to be emitted from softwoods, and the emissions from pinewood are remarkably higher than from spruce (Alapieti et al. Citation2020). Although all test buildings had wood materials, large wall and ceiling surfaces made from pinewood in TB 3 probably explain the concentration differences between the test buildings. The amount of wood surfaces in TB 1 was equal to TB 3 because of the spruce plywood used as interior wall and ceiling material. However, emissions from raw wood materials used in wood-based panels before manufacturing are higher than from the final products, which is probably a consequence of drying and hot-pressing processes used during the manufacturing of the panels (He et al. Citation2012).
It is known that the terpene emissions from recently dried pinewood can be notable and relatively high concentrations have been measured in new low-energy buildings (Patkó et al. Citation2013), but the emissions are generally believed to decrease rapidly (Pohleven et al. Citation2019). Therefore, it was interesting to notice that their concentrations can remain remarkable in the five-year-old building. Prior to our study, the test buildings had been unused for two years without ventilation, so it is possible that the indoor concentrations accumulated during that time. However, our study used relatively high air change rates, and the indoor air of the test buildings changed several times during the study, indicating that terpene emissions from pinewood can remain substantial at least for some years. Park and Ikeda (Citation2006) had similar findings in their study where it was suggested that α-pinene related to wooden materials needs a longer flushing period in new buildings than other compounds. Additionally, Kačík et al. (Citation2012) concluded in their study that terpene emissions from the wood used as a building material can continue up to 150 years. Some terpene compounds, such as α-pinene and D-limonene, are used in several consumer products, such as cleaning products, and thus, occupant activities occasionally explain their elevated concentrations (Wang et al. Citation2017). However, such products were not used in our study, so it can be assumed that these compounds originate completely from material emissions.
Concentrations of TVOC and identified compounds in TB 1 and TB 2 were in the lower end of measured concentrations in low-energy wooden frame buildings in other studies (Engelmann et al. Citation2013, Fischer et al. Citation2013, Patkó et al. Citation2013, Derbez et al. Citation2014a, Derbez et al. Citation2014b), and the TVOC concentrations were close to the median TVOC level of the Finnish residential buildings (110 µg/m3) (Juntunen et al. Citation2022). TVOC and terpene levels of TB 3 were relatively high, but similar or higher concentrations have been reported from a low-energy building with extensive wooden surfaces (Patkó et al. Citation2013). The highest concentrations in TB 3 were measured for α-pinene (336 µg/m3) and 3-carene (190 µg/m3). The European Union’s Lowest Concentration of Interest (EU-LCI) values for these compounds are 2500 and 1500 µg/m3, respectively (European Commission Citation2020). Therefore, the measured concentrations are unlikely to cause detrimental health effects. However, terpene compounds are known for gas-phase and surface reactions with ozone and other oxidants present in indoor air (Weschler and Shields Citation1999, Wolkoff et al. Citation2000). These reactions cause the formation of a complex mixture of VOCs (e.g. main identified reaction products in α-pinene/ozone systems include formaldehyde, acetaldehyde, and pinonaldehyde) and secondary organic aerosols (SOA) (Rohr Citation2013), and the reaction products may be of health concern (Wolkoff Citation2020). Terpene oxidation reactions take place when the reaction time is faster or equal to the air change rate, and an increased air change rate limits the reactions (Weschler and Shields Citation2000). Fischer et al. (Citation2013) studied ozone-initiated indoor chemistry in a low-energy wooden apartment building, and they concluded that buildings with mechanical ventilation and similar pollutant concentrations presumably fulfil IAQ requirements if the air change rate is kept close to 0.5 h−1. The average terpene concentration in the study was 54 µg/m3, which is significantly lower than the concentrations in TB 3. However, it has been proposed that induction of sensory irritation would need high concentrations of ozone and terpenes, and typical real-life concentrations are not high enough to cause sensory irritation (Wolkoff and Nielsen Citation2017).
The results of the PAQ assessment were somewhat consistent with the IAQ measurements, and the air quality was perceived to be more acceptable with higher ventilation. Statistical analyses revealed significant differences in the PAQ scores between VL 0.5 and VL 2.0. In TB 1 and TB 2, the PD decreased approximately 70% between VL 0.5 and VL 1.0, and after that, decreasing continued but the differences were smaller. The highest PD was measured in TB 2 at VL 0.5. A strong pungent odour was present in the test building during the PAQ assessment, and it probably explains the high percentage. Although there was a difference in the TVOC values in TB 2 between VL 0.5 and VL 1.0, clear differences within the identified compounds were not observed. Therefore, it was not possible to detect the source of this odour. In Tb 3, larger reduction was observed between VL 1.0 and VL 2.0, although reduction in TVOC levels was higher between lower ventilation levels. TB 3 had characteristic wood odour, which was quite strong at VL 0.5, and diluted remarkably with increased ventilation. The characteristic wood odour from pine is mainly caused by terpene compounds (Nore et al. Citation2017), and their concentrations were clearly lower at VL 2.0 compared to VL 1.0. Therefore, it is presumable that the improved PAQ resulted from lower terpene concentrations, although wood odour is typically perceived as pleasant (Adamova et al. Citation2020). Thus, it is possible that the intensity of the wood odour reduces its pleasantness. Additionally, TB 3 showed remarkably higher TVOC concentrations at the lowest ventilation level than TB 2, but the percentage of dissatisfied was nearly two times higher in TB 2. Individual VOCs have different characteristics, and for instance, odour thresholds fluctuate between compounds (Wolkoff Citation2013). However, mainly the same compounds were identified in both buildings and with higher concentrations in TB 3. This indicates that PAQ between different buildings should not be compared solely based on VOC concentrations and ventilation airflows.
According to previous studies, it is possible to achieve adequate IAQ in low-energy wooden buildings (Fischer et al. Citation2013, Derbez et al. Citation2014a), and some studies have reported IAQ to be comparable to or better in low-energy buildings than in conventional buildings (Holopainen et al. Citation2015, Langer et al. Citation2015, Wallner et al. Citation2015). However, shortcomings regarding some of the observed IAQ parameters were also reported (Derbez et al. Citation2014b, Kaunelienė et al. Citation2016). Functioning mechanical ventilation system with sufficient air change rates was highlighted as a crucial factor to achieve acceptable IAQ (Fischer et al. Citation2013, Derbez et al. Citation2014a, Derbez et al. Citation2014b, Langer et al. Citation2015, Kaunelienė et al. Citation2016, Moreno-Rangel et al. Citation2020). Our results support these findings. In our study, the effect of ventilation stood out, especially in TB 3, where VOC concentrations were higher. With lower indoor pollution levels in TB 1 and TB 2, the effect of increasing ventilation from VL 1.0 to VL 2.0 was less clear, but increasing ventilation from the lowest level improved both measured and perceived IAQ. Therefore, our result suggests that increasing the ventilation rate does not necessarily result in improved IAQ when considering VOC emissions, but it may be considered to improve PAQ and in indoor settings with high levels of pollutants from materials or occupant activity-based sources. However, increasing the ventilation rate also increases buildings’ energy consumption, and may not result in better indoor pollutant removal efficiency (Cao et al. Citation2016). Further, increased ventilation may cause deteriorated IAQ because of pollution from external sources (Taylor et al. Citation2015). Thus, several factors must be considered when selecting adequate ventilation levels, and the possibility to enhance ventilation on demand could improve occupant satisfaction.
The use of low-emitting building and furnishing materials to achieve good IAQ in low-energy buildings was also emphasized (Derbez et al. Citation2014a, Kaunelienė et al. Citation2016), and in some cases, elevated pollution levels were connected with the recent construction of the studied buildings (Engelmann et al. Citation2013, Derbez et al. Citation2014b, Kaunelienė et al. Citation2016). Our results are not completely comparable with the other studies, as the test buildings were unfurnished and unoccupied, and the interior materials were mostly uncoated, and these factors affect substantially total emissions in real-life situations. However, we were able to observe emissions solely from building materials in actual buildings five years after the construction. Our results suggest that the emissions’ levels from low-energy structures and interior surfaces made of commonly used building materials (e.g. gypsum board, wood, plywood, LVL board, and cellulose, mineral, and rock wool as insulation) are sufficiently low to maintain a good IAQ in low-energy buildings. Low-energy building concepts mostly concentrate on energy sources and consumption during operation, but the focus should also be on sustainable and environmentally friendly materials. In this context, wood has several favourable parameters. However, according to the results from TB3, VOC concentrations, particularly those of terpene compounds, can remain on a relatively high level in a low-energy building with extensive surfaces of solid wood at least up to five years. Although the measured concentrations are not high enough to cause detrimental health effects, the possibility of terpene oxidation reactions should be noticed, especially in indoor environments with low ventilation rates and ozone sources.
5. Limitations and future work
There exist some limitations that should be considered when interpreting the results of the study. First of all, the test buildings used in the study were unoccupied and unfurnished, and the interior materials were mostly uncoated. Therefore, the results cannot be generalized to concern all low-energy buildings. However, with the study design, we were able to concentrate on the emissions emerging purely from materials and on the effect of ventilation on them. Second, the amount of VOC air samples was quite low. Higher number of samples taken during the study would have increased the reliability of the results. However, the identified compounds and their concentrations in the buildings with different ventilations seemed consistent. Third, the study would have benefitted from a higher number of participants in the PAQ assessment. The possibility of individual preferences affecting the results could be reduced with more participants.
In future work, it would be of great interest to examine the development of material emissions on a longer time span in buildings with high surface areas of uncoated wood. As the results of our study indicate, especially terpene emissions can remain at relatively high levels for several years. Additionally, further information about the health effects of these compounds could be used to estimate their effects on the occupants.
6. Conclusions
We studied IAQ in three low-energy wooden test buildings and the effects of ventilation levels measured and perceived IAQ. VOC levels in a test building made of pine logs (TB 3) were remarkably higher compared to the other buildings. The identified VOCs included mainly the same compounds in all buildings, but higher concentrations in TB 3 were presumably caused by higher emissions of terpene compounds from pinewood used in the walls and ceiling. The results suggest that increasing airflow rates reduces the concentration of indoor VOCs, but the effect weakened after certain levels had been reached in TB 1 and TB 2. However, the VOC levels continued to decrease in TB 3 after all ventilation increases. The results of the PAQ assessment showed continuous decreases in percentages of dissatisfied with the air quality with increased ventilation, and statistically significant differences were found between the lowest (VL 0.5) and the highest (VL 2.0) ventilation in all buildings. However, a remarkably higher percentage of dissatisfied at the lowest ventilation level was observed in TB 2 compared to TB 3, although TB 3 showed significantly higher VOC levels. Therefore, the results indicate VOC levels are not determining factors in perceived air quality. The findings of this study provide valuable information about the effect of ventilation and material selection on IAQ in low-energy buildings, which has the potential to be used to improve occupant satisfaction under the increasing demand to minimize the energy consumption of buildings.
Acknowledgement
The authors would also like to thank Professor Jarek Kurnitski for his valuable advice on ventilation.
Disclosure statement
No potential conflict of interest was reported by the author(s).
Data availability statement
The data that supports the findings of this study is available from the corresponding author upon reasonable request.
Additional information
Funding
References
- Adamova, T., Hradecky, J. and Panek, M. (2020) Volatile organic compounds (VOCs) from wood and wood-based panels: methods for evaluation, potential health risks, and mitigation. Polymers, 12(10), 2289.
- Alapieti, T., Mikkola, R., Pasanen, P. and Salonen, H. (2020) The influence of wooden interior materials on indoor environment: a review. European Journal of Wood and Wood Products, 78(4), 617–634. doi:10.1007/s00107-020-01532-x
- Berry, T.-A., Chiswell, J. H. D., Wallis, S. L. and Birchmore, R. (2017) The Effect of Airtightness on Indoor Air Quality in Timber Houses in New Zealand. Unitec ePress Occasional and Discussion Paper Series, 9.
- Campagnolo, D., Saraga, D. E., Cattaneo, A., Spinazzè, A., Mandin, C., Mabilia, R., Perreca, E., Sakellaris, I., Canha, N., Mihucz, V. G., Szigeti, T., Ventura, G., Madureira, J., de Oliveira Fernandes, E., de Kluizenaar, Y., Cornelissen, E., Hänninen, O., Carrer, P., Wolkoff, P., … Bartzis, J. G. (2017) VOCs and aldehydes source identification in European office buildings – The OFFICAIR study. Building and Environment, 115, 18–24. doi:10.1016/j.buildenv.2017.01.009
- Cao, S.-J., Zhu, D.-H. and Yang, Y.-B. (2016) Associated relationship between ventilation rates and indoor air quality. RSC Advances, 6(112), 111427–111435. doi:10.1039/C6RA22902F
- Colclough, S., Kinnane, O., Hewitt, N. and Griffiths, P. (2018) Investigation of nZEB social housing built to the Passive House standard. Energy and Buildings, 179, 344–359. doi:10.1016/j.enbuild.2018.06.069
- Cometto-Muniz, J. and Abraham, M. (2015) Compilation and analysis of types and concentrations of airborne chemicals measured in various indoor and outdoor human environments. Chemosphere, 127, 70–86.
- Derbez, M., Berthineau, B., Cochet, V., Lethrosne, M., Pignon, C., Riberon, J. and Kirchner, S. (2014a) Indoor air quality and comfort in seven newly built, energy-efficient houses in France. Building and Environment, 72, 173–187. doi:10.1016/j.buildenv.2013.10.017
- Derbez, M., Berthineau, B., Cochet, V., Pignon, C., Ribéron, J., Wyart, G., Mandin, C. and Kirchner, S. (2014b) A 3-year follow-up of indoor air quality and comfort in two energy-efficient houses. Building and Environment, 82, 288–299. doi:10.1016/j.buildenv.2014.08.028
- Dimitroulopoulou, C. (2012) Ventilation in European dwellings: A review. Building and Environment, 47, 109–125. doi:10.1016/j.buildenv.2011.07.016
- Du, L., Leivo, V., Prasauskas, T. T., Täubel, M., Martuzevicius, D. and Haverinen-shaughnessy, U. (2019) Effects of energy retrofits on indoor Air quality in multifamily buildings. Indoor air, 29, 686–697. doi:10.1111/ina.12555
- Engelmann, P., Roth, K. and Tiefenbeck, V. (2013) Comfort, Indoor Air Quality, and Energy Consumption in Low Energy Homes. https://digital.library.unt.edu/ark:/67531/metadc834983/.
- European Commission. (2019) COM(2019) 285 - Communication from the Commission to the European Parliament, the Council, the European Economic and Social Committee and the Committee of Region: United in delivering the Energy Union and Climate Action - Setting the foundations for successful clean energy transition In. Brussels, Belgium: European Commission.
- European Commission. (2020) Agreed EU-LCI values – substances with their established EU-LCI values and summary fact sheets. In. Brussels, Belgium: European Commission.
- The European Parliament and the Council of the European Union. (2010) DIRECTIVE 2010/31/EU OF THE EUROPEAN PARLIAMENT AND OF THE COUNCIL of 19 May 2010 on the energy performance of buildings. Official Journal of the European Union, 153(13), 1–23.
- The European Parliament and the Council of the European Union. (2018) DIRECTIVE (EU) 2018/844 OF THE EUROPEAN PARLIAMENT AND OF THE COUNCIL of 30 May 2018 amending directive 2010/31/EU on the energy performance of buildings and directive 2012/27/EU on energy efficiency. Official Journal of the European Union, 156(75), 1–17.
- Fang, L., Clausen, G. and Fanger, P. O. (1999) Impact of temperature and humidity on chemical and sensory emissions from building materials. Indoor Air, 9(3), 193–201. doi:10.1111/j.1600-0668.1999.t01-1-00006.x
- Fischer, A., Langer, S. and Ljungström, E. (2013) Chemistry and indoor air quality in a multi-storey wooden passive (low energy) building: formation of peroxyacetyl nitrate. Indoor and Built Environment, 23(3), 485–496. doi:10.1177/1420326X13487917
- Földváry, V., Bekö, G., Langer, S., Arrhenius, K. and Petráš, D. (2017) Effect of energy renovation on indoor air quality in multifamily residential buildings in Slovakia. Building and Environment, 122, 363–372. doi:10.1016/j.buildenv.2017.06.009
- Geiss, O., Giannopoulos, G., Tirendi, S., Barrero-Moreno, J., Larsen, B. R. and Kotzias, D. (2011) The AIRMEX study - VOC measurements in public buildings and schools/kindergartens in eleven European cities: statistical analysis of the data. Atmospheric Environment, 45(22), 3676–3684. doi:10.1016/j.atmosenv.2011.04.037
- Haghighat, F. and De Bellis, L. (1998) Material emission rates: Literature review, and the impact of indoor air temperature and relative humidity. Building and Environment, 33(5), 261–277. doi:10.1016/S0360-1323(97)00060-7
- He, Z., Zhang, Y. and Wei, W. (2012) Formaldehyde and VOC emissions at different manufacturing stages of wood-based panels. Building and Environment, 47, 197–204. doi:10.1016/j.buildenv.2011.07.023
- Hildebrandt, J., Hagemann, N. and Thrän, D. (2017) The contribution of wood-based construction materials for leveraging a low carbon building sector in Europe. Sustainable Cities and Society, 34, 405–418. doi:10.1016/j.scs.2017.06.013
- Holopainen, R., Salmi, K., Kähkönen, E., Pasanen, P. and Reijula, K. (2015) Primary energy performance and perceived indoor environment quality in Finnish low-energy and conventional houses. Building and Environment, 87, 92–101. doi:10.1016/j.buildenv.2015.01.024
- Huang, S., Xiong, J., Cai, C., Xu, W. and Zhang, Y. (2016) Influence of humidity on the initial emittable concentration of formaldehyde and hexaldehyde in building materials: experimental observation and correlation. Scientific Reports, 6(1), 23388. doi:10.1038/srep23388
- Ikei, H., Song, C. and Miyazaki, Y. (2016) Effects of olfactory stimulation by α-pinene on autonomic nervous activity. Journal of Wood Science, 62(6), 568–572. doi:10.1007/s10086-016-1576-1
- Joung, D., Song, C., Ikei, H., Okuda, T., Igarashi, M., Koizumi, H., Park, B. J., Yamaguchi, T., Takagaki, M. and Miyazaki, Y. (2014) Physiological and psychological effects of olfactory stimulation with D-limonene. Advances in Horticultural Science, 28(2), 2094. doi:10.13128/ahs-22808
- Juntunen, M., Salmela, A., Jalkanen, K., Hovi, H., Wallenius, K. and Hyvärinen, A. (2022) Haihtuvat orgaaniset yhdisteet asunnoissa - Pitoisuustasot, yleisimmät yhdisteet ja terveysvaikutukset [In Finnish] (Helsinki, Finland: Finnish Institute for Health and Welfare).
- Kačík, F., Veľková, V., Šmíra, P., Nasswettrová, A., Kačíková, D. and Reinprecht, L. (2012) Release of terpenes from fir wood during Its long-term Use and in thermal treatment. Molecules, 17(8), 9990–9999. doi:10.3390/molecules17089990
- Kaunelienė, V., Prasauskas, T., Krugly, E., Stasiulaitienė, I., Čiužas, D., Šeduikytė, L. and Martuzevičius, D. (2016) Indoor air quality in low energy residential buildings in Lithuania. Building and Environment, 108, 63–72. doi:10.1016/j.buildenv.2016.08.018
- Krol, S., Namiesnik, J. and Zabiegala, B. (2014) a-Pinene, 3-carene and d-limonene in indoor air of Polish apartments: The impact of air quality and human exposure. Science of the Total Environment, 468-469, 985–995.
- Langer, S., Bekö, G., Bloom, E., Widheden, A. and Ekberg, L. (2015) Indoor air quality in passive and conventional new houses in Sweden. Building and Environment, 93(P1), 92–100. doi:10.1016/j.buildenv.2015.02.004
- Lewis, A. C., Lee, J. D., Edwards, P. M., Shaw, M. D., Evans, M. J., Moller, S. J., Smith, K. R., Buckley, J. W., Ellis, M., Gillot, S. R. and White, A. (2016) Evaluating the performance of low cost chemical sensors for air pollution research. Faraday Discussions, 189, 85–103. doi:10.1039/C5FD00201J
- Mandin, C., Trantallidi, M., Cattaneo, A., Canha, N., Mihucz, V., Szigeti, T., Mabilia, R., Perreca, E., Spinazze, A., Fossati, S., Kluizenaar, Y., Cornelissen, E., Sakellaris, I., Saraga, D., Hänninne, O., Fernandes, E., Ventura, G., Wolkoff, P., Carrer, P. and Bartzis, J. (2017) Assessment of indoor air quality in office buildings across Europe - The OFFICAIR study. Science of the Total Environment, 579, 169–178.
- Markowicz, P. and Larsson, L. (2015) Influence of relative humidity on VOC concentrations in indoor air. Environmental Science and Pollution Research International, 22(8), 5772–5779. doi:10.1007/s11356-014-3678-x
- Ministry of Social Affairs and Health (2015) Decree of the Ministry of Social Affairs and Health on Health-related Conditions of Housing and Other Residential Buildings and Qualification Requirements for Third-party Experts (545/2015). In. Helsinki, Finland: Ministry of Social Affairs and Health.
- Ministry of the Environment (2011) D2 National building code of Finland: Indoor climate and ventilation of buildings - Regulations and guidelines 2012. In. Helsinki, Finland: Ministry of the Environment - Department of Built Environment.
- Moran, P., Goggins, J. and Hajdukiewicz, M. (2017) Super-insulate or use renewable technology? Life cycle cost, energy and global warming potential analysis of nearly zero energy buildings (NZEB) in a temperate oceanic climate. Energy and Buildings, 139, 590–607. doi:10.1016/j.enbuild.2017.01.029
- Moreno-Rangel, A., Sharpe, T., McGill, G. and Musau, F. (2020) Indoor Air quality in passivhaus dwellings: A literature review. International Journal of Environmental Research and Public Health, 17, 13. doi:10.3390/ijerph17134749
- Nore, K., Nyrud, A. Q., Kraniotis, D., Skulberg, K. R., Englund, F. and Aurlien, T. (2017) Moisture buffering, energy potential, and volatile organic compound emissions of wood exposed to indoor environments. Science & Technology for the Built Environment, 23(3), 512–521. doi:10.1080/23744731.2017.1288503
- Ortiz, M., Itard, L. and Bluyssen, P. M. (2020) Indoor environmental quality related risk factors with energy-efficient retrofitting of housing: A literature review. Energy and Buildings, 221, 110102. doi:10.1016/j.enbuild.2020.110102
- Park, J. S. and Ikeda, K. (2006) Variations of formaldehyde and VOC levels during 3 years in new and older homes. Indoor air, 16(2), 129–135. doi:10.1111/j.1600-0668.2005.00408.x
- Patkó, C., Patkó, I. and Pásztory, Z. (2013) Indoor air quality testing in Low-energy wooden houses: measurement of formaldehyde and VOC-s. Acta Polytechnica Hungarica, 10(8), 106–116. doi:10.12700/APH.10.08.2013.8.6
- Pohleven, J., Burnard, M. and Kutnar, A. (2019) Volatile organic compounds emitted from untreated and thermally modified wood- A review. Wood and Fiber Science, 51(3), 231–254. doi:10.22382/wfs-2019-023
- Rohr, A. (2013) The health significance of gas- and particle-phase terpene oxidation products: A review. Environment International, 60, 145–162.
- Salazar, J. and Meil, J. (2009) Prospects for carbon-neutral housing: the influence of greater wood use on the carbon footprint of a single-family residence. Journal of Cleaner Production, 17, 1563–1571.
- Schlink, U., Rehwagen, M., Damm, M., Richter, M., Borte, M. and Herbarth, O. (2004) Seasonal cycle of indoor-VOCs: comparison of apartments and cities. Atmospheric Environment, 38(8), 1181–1190. doi:10.1016/j.atmosenv.2003.11.003
- Spinelle, L., Gerboles, M., Kok, G., Persijn, S. and Sauerwald, T. (2017) Review of portable and Low-cost sensors for the ambient Air monitoring of benzene and other volatile organic compounds. Sensors, 17, 1520. doi:10.3390/s17071520
- Steckel, V., Welling, J. and Ohlmeyer, M. (2011) Product emissions of volatile organic compounds from convection dried Norway spruce (Picea abies (L. H. Karst.) timber. International Wood Products Journal, 2(2), 75–80. doi:10.1179/2042645311Y.0000000007
- Suzuki, M., Akitsu, H., Miyamoto, K., Tohmura, S.-I. and Inoue, A. (2014) Effects of time, temperature, and humidity on acetaldehyde emission from wood-based materials. Journal of Wood Science, 60(3), 207–214. doi:10.1007/s10086-014-1397-z
- Taylor, J., Mavrogianni, A., Davies, M., Das, P., Shrubsole, C., Biddulph, P. and Oikonomou, E. (2015) Understanding and mitigating overheating and indoor PM2.5 risks using coupled temperature and indoor air quality models. Journal of Building Services Engineering Research & Technology, 36(2), 275–289. doi:10.1177/0143624414566474
- Trantallidi, M., Dimitroulopoulou, W. P., Kephalopoulos, S. and Carrer, P. (2015) EPHECT III: Health risk assessment of exposure to household consumer products. Science of the Total Environment, 536, 903–913.
- Van der Wal, J. F., Hoogeveen, A. W. and Wouda, P. (1997) The influence of temperature on the emission of volatile organic compounds from PVC flooring, carpet, and paint. Indoor air, 7(3), 215–221. doi:10.1111/j.1600-0668.1997.t01-1-00007.x
- Wallner, P., Munoz, U., Tappler, P., Wanka, A., Kundi, M., Shelton, J. F. and Hutter, H.-P. (2015) Indoor environmental quality in mechanically ventilated, energy-efficient buildings vs. conventional buildings. International Journal of Environmental Research and Public Health, 12(11), 14132–14147. doi:10.3390/ijerph121114132
- Wang, C., Barratt, B., Carslaw, N., Doutsi, A., Dunmore, R., Ward, M. and Lewis, A. (2017) Unexpectedly high concentrations of monoterpenes in a study of UK homes. Environmental Science: Processes & Impacts, 19, 528–537.
- Weschler, C. and Shields, H. (1999) Indoor ozone/terpene reactions as a source of indoor particles. Atmospheric Environment, 33, 2301–2312.
- Weschler, C. and Shields, H. (2000) The influence of ventilation on reactions among indoor pollutants: modeling and experimental observations. Indoor air, 10, 92–100.
- Winter, S., Schulte-Wrede, M., & Jebens, K. (2012). Highly insulated wooden structures in Nordic climate. World conference on timber Engineering 2012: Architecture and Engineering case studies, WCTE 2012, Auckland, New Zealand.
- Wolkoff, P. (1998) Impact of air velocity, temperature, humidity, and air on long-term voc emissions from building products. Atmospheric Environment, 32(14), 2659–2668. doi:10.1016/S1352-2310(97)00402-0
- Wolkoff, P. (2013) Indoor air pollutants in office environments: assessment of comfort, health, and performance. International Journal of Hygiene and Environmental Health, 216, 371–394.
- Wolkoff, P. (2020) Indoor air chemistry: Terpene reaction products and airway effects. International Journal of Hygiene and Environmental Health, 225, 113439. doi:10.1016/j.ijheh.2019.113439
- Wolkoff, P., Clausen, P., Wilkings, C. and Nielsen, G. (2000) Formation of strong airway irritants in terpene/ozone mixtures. Indoor air, 10, 82–91.
- Wolkoff, P. and Nielsen, G. D. (2017) Effects by inhalation of abundant fragrances in indoor air – An overview. Environment International, 101, 96–107.
- Yang, S., Pernot, J. G., Jörin, C. H., Niculita-Hirzel, H., Perret, V. and Licina, D. (2020) Energy, indoor air quality, occupant behavior, self-reported symptoms and satisfaction in energy-efficient dwellings in Switzerland. Building and Environment, 171, 106618. doi:10.1016/j.buildenv.2019.106618