
 ?Mathematical formulae have been encoded as MathML and are displayed in this HTML version using MathJax in order to improve their display. Uncheck the box to turn MathJax off. This feature requires Javascript. Click on a formula to zoom.
ABSTRACT
In this study, 3D-printed connectors to replace the typical L-shaped joints in the construction of a chair were developed, tested and numerically analysed. Different connectors were designed and manufactured with a fused deposition modelling (FDM) 3D printer using acrylonitrile butadiene styrene (ABS) with the aim to find a simple shaped connector which could be used to build chairs and withstand standard chair loading requirements. The strength and stiffness of the joints were tested and compared with traditional beech mortise-and-tenon joints. Numerical stress and strain analyses were performed with the finite element method for an orthotropic linear-elastic model. The experimental results showed that joints with 3D-printed connectors achieved lower strength than the traditional wooden mortise-and-tenon joints with similar dimensions. The results indicate that the effect of reinforcement of the connector were not recognised due to the small thickness and inadequate geometric position and arrangement of the reinforcement ABS material. The chair assembled with 3D-printed connectors could withstand the loads for seating, but failed the backrest test according to standard EN 1728:2002. The connectors need to be optimised and reinforced to withstand standard loads.
1. Introduction
The design of furniture joints has evolved through the experience gained by trial and error (Eckelman and Suddarth Citation1969; Tankut and Tankut Citation2011), and has almost always been based on the traditions in handicraft manufacturing. The common mortise-and-tenon wooden joints have been in use for centuries to produce durable and structurally sound wooden furniture. Since the development of CAD and CAM software, joints are mainly produced by machinery in an automated fashion, and numerical simulations are also increasingly being used in the joint and construction design process. Over time these joints have developed considerably as a result of new production technologies (computer numerically controlled machines, CNC) and new materials.
There have been a number of studies on the numerous factors that affect the mechanical properties of mortise-and-tenon joints, which are one of the most common joints in items of furniture. The strength of the joint, i.e. the exact failure values, depend on the dimensions of the tested joints and the loading type. The dimensions and relations between the widths of the tenons also influence the strength of the joints (Wilson Citation2006). Wilson discovered that wider tenons mean stronger mortise-and-tenon joints, and with an increase in the dimensions there is an increase in the shear strength. Increasing tenon length increased the maximal moment and proportional moment of both standard and double joints (Hajdarevic et al. Citation2020). The right choice of adhesive can also increase the strength of the joints, and mortise-and-tenon joints bonded with PU resin were 13% stronger than mortise-and-tenon joints bonded with other adhesives (Derikvand and Ebramimi Citation2014).
Further, one of the most significant developments in manufacturing over the past 10 years has been the advent of additive manufacturing (Gress and Kalafsky Citation2015). Additive manufacturing (AM), also referred to as 3D printing, involves manufacturing a part from 3D model data, by depositing/joining the material in a layer-by-layer process (ASTM F2792-12 Citation2012).
This differs from conventional approaches, such as subtractive processes (milling or drilling), formative processes (casting or forging), and joining processes (welding or fastening) (Conner et al. Citation2014). 3D printing enables the fabrication of complex geometrical shapes, leads to rapid design and results in the minimum waste material. AM is competitive with conventional production when there are prototypes or pieces with high complexity that need to be produced in small batches or when individual pieces are required (Henke and Treml Citation2013). In addition, 3D printing is an industrial manufacturing process with the potential to significantly reduce resource and energy demands, and has attracted a lot of attention as the process has proven to be compatible with industrial manufacturing beyond the prototyping phase (Gebler et al. Citation2014). The large variety of materials that can be employed (plastic, metal and composites) means that a wide range of products can be produced.
The first machine for additive manufacturing, using the stereolithography technique, was developed in 1987, and this was followed by the rapid development of other prototypes that employed different methods (Chua et al. Citation1998). Nowadays, a variety of techniques are available for different materials and to achieve different properties of the final product, which can be divided by the physical state of the printing material (liquid-, solid- and powder-based) and by the method applied to fuse the matter at the molecular level (thermal, ultra-violet light, laser or electron beam) (Hopkinson et al. Citation2006). Different materials are available for 3D printing, such as polymers (polyamide, acrylonitrile butadiene styrene (ABS), polylactic acid (PLA), polyvinyl alcohol (PVA)) ceramics, gypsum and metals (stainless steel, gold and silver, titanium).
Over the last few years, we have seen tremendous growth in the personal 3D printer market, especially with printers that use fused deposition modelling (FDM) to make plastic objects from ABS or PLA polymers. This rise in the number of personal 3D printers also offers new possibilities for design of new products, like home designed furniture. As such, people can now design their own plastic connectors and combine them with wooden pieces that are available from retailers to form new furniture. Due to limitations in printer volume, furniture is often printed in parts and assembled like a puzzle, or combined by adhesive bonding or screwing with other materials (Aydin Citation2015). Grujovic et al. (Citation2017) designed and 3D printed different wood panel connectors and used them with panels to make shelves. Such 3D-printed connectors provided the necessary strength and stability of the structure. Properly designed and optimised connectors that are 3D-printed from suitable materials can provide strong joints and cost-effective solutions in low volume production (Aiman et al. Citation2020). Even more, sustainable 3D printing with mycelium, which overgrows a 3D-printed structure, can be used to form new kind of furniture (Mycelium Chair by Eric Klarenbeek Is 3D-Printed with Living Fungus, Citation2013).
The appropriate strength and stiffness of joints are among the main requirements that need to be ensured during the construction of a wood structure. The analysis of the mechanical properties of a joint is more complex if a 3D-printed connector is used for connecting wooden parts of structure (Hajdarevic et al. Citation2019) and properties of wood, 3D-printed part and their connections need to be evaluated (Aiman et al. Citation2020). Aiman et al. (Citation2020) study investigated and compared the PETG and ABS material and Fused Deposition Modelling (FDM) fabrication method with regard to a modular furniture joint, and concluded that more studies should be conducted to evaluate the possibility of using 3D-printed materials in end-products. The results of experimental investigations and numerical calculations of the mechanical properties of furniture joints with 3D-printed fasteners showed that the stiffness and strength of joints depend on the type of materials used, especially the values of the linear elasticity modulus (Smardzewski et al. Citation2016; Krzyżaniak et al. Citation2021). Kasal et al. (Citation2020) conducted a study that aimed to design and produce different types of auxetic dowels using 3D printing, and experimentally and numerically analyse the withdrawal strength of these. The auxetic dowels did not show sufficient withdrawal strength values, and the authors suggested that they should be produced with stronger materials and/or alternative 3D printing technologies.
The aim of this study was thus to research the possibilities of using 3D-printed connectors for making furniture by analysing the mechanical properties of joints with printed connectors. The idea was to join simple wooden pieces with 3D-printed connectors of their own design to create functional mortise-and-tenon type joints (wooden pieces joined by their tenons through the mortises of the connector), from which anyone could make furniture of their own design. The joints from 3D-printed connectors and wooden parts were designed, tested and numerically analysed. The objective was to determine the strength and stiffness and, also, to analyse the stress and strain state of the joints with four different connector designs that were subjected to bending. The connectors were also used to make a model chair, and this was then tested according to the standards for domestic furniture.
2. Materials and methods
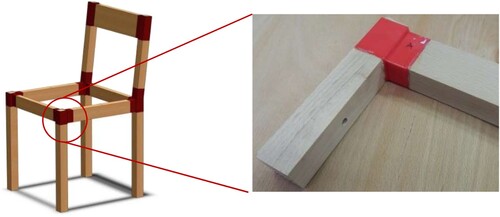
The idea for the study was to make a connector that could replace a traditional mortise-and-tenon joint in the construction of a chair, as shown in . Chairs would then be made by using 3D-printed connectors and simple wooden rails. This type of chair could be made by anyone who has access to 3D printer and 3D modelling software, and so opens up a new area of design where each individual could adapt and develop their own shape of connector and thus furniture.
Figure 1. Proposed chair construction and L-shaped mortise-and-tenon joint made with 3D-printed connectors. The dimensions of the chair were as follows: seat height 435 mm, seat width 420 mm, total height 762 mm, angle of backrest 97°. The cross section of the legs was 35 × 35 mm and that of the rails 30 × 50 mm.
2.1. Connectors
In this study, the basic orthogonal shape of connectors was used to better evaluate and analyse the effects of 3D printing on connector strength. 3D printing obviously offers more design freedom, and could be used to produce shapes that are very difficult to realise with conventional subtractive technologies. Thanks to the capabilities of 3D printing, it is even possible to optimise the topology of the structure (Ntintakis et al. Citation2019), or even use principle of biomimicry (Tavsan and Sonmez Citation2015), resulting in lower material consumption, faster manufacturing and lower price while maintaining the same strength properties. In this phase of the study, the focus was on the simple geometry of the joints, while the anisotropic material properties were neglected. Our subsequent research will address more complex designs and printing orientations of connector parts.
Four different connectors, , were designed using the SolidWorks 3D modelling software. Two basic types of connectors were prepared: type 1 (connectors A and B) had a thickness of 3 mm for all of the walls, and type 2 (connectors C, D) were reinforced (wall thickness 5 mm) in specific sections to increase its strength.
Figure 2. 3D-printed connectors A, B, C, D with dimensions.
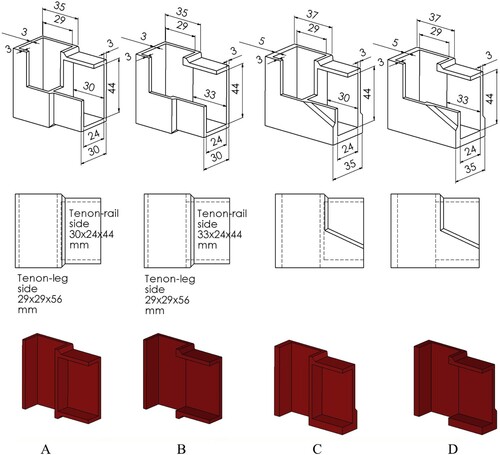
The wall thickness and position of the reinforcements (an additional 2-mm-thick wall) were set in accordance with the results of preliminary tests. The differences in the connectors of the same type were in the presence or absence of the inner wall in the connector: the A and C connectors did not have a wall between the post and the rail, so that the wooden post was directly bonded to the rail. The B and D connectors had the inner wall, so that the wooden post was bonded to this wall and not directly to the wooden rail. Ten samples were made and tested for each connector. The dimensions of the four different 3D-printed connectors are shown in :
A – connector without inner wall
B – connector with inner wall
C – reinforced connector without inner wall
D – reinforced connector with inner wall
The connectors were printed on a Zortrax M-200 FDM 3D printer with a 0.4 mm nozzle. A plastic ABS filament of 1.75 mm (Z-ABS) was used. The thickness of the printed layer was 0.29 mm, while the printer was set to high-speed printing and solid infill. The print cooling was set to auto (the slicing programme Z-Suite determines the intensity of the cooling with a fan). All parts were printed in same position, as shown in , with printing layers parallel to the bottom of the connectors. After printing all 3D-printed parts were exposed for 1 min to acetone vapours in a closed glass jar to smoothen the surfaces. This process melted and fused the outer layers. A glossier surface was thus achieved on the parts, and the performance of the connector was improved.
2.2. Mortise-and-tenon joints with connectors testing method
The wooden parts (rail and post) were made of beech wood (Fagus Sylvatica L.), which was conditioned in a standard climate (20°C and 65% RH) to achieve equilibrium moisture content of 12%. The parts were then bonded to the 3D-printed connectors with a one-component polyurethane humidity cross-linking adhesive, Mitopur E45 (Mitol d.d. Sežana, Slovenia). This adhesive has a viscosity of 5500–9000 (mPas) at 23°C, and meets the requirements with regard to EN 204, stress group D4 and thermal resistance from – 40°C to +120°C. It is intended for bonding all types of wood, even with high moisture content for exterior exposure (windows and doors), cement-bonded chipboards, metals, different types of steel, sheet aluminium, plastic materials (polystyrene, PVC, ABS, polyurethane), insulating materials, polyurethane foams, mineral and glass fibre boards. Joints prepared with this glue are strong and elastic. Wooden parts with applied adhesive were sprayed with water before assembly with 3D-printed connectors to provide faster adhesive curing and foaming of the adhesive to fill the space in the connectors.
Wooden parts were cut to form a tight fit with the 3D-printed connectors. Prior to adhesive application, the parts were lightly sanded, and fitting with the connectors was tested. If the fit was too tight, there would be not enough space for adhesive, and it would be scraped off during assembly. The wooden parts were thus sanded to ensure optimum fitting, based on previous experience.
The bonded parts were left to cure for seven days before being tested on a Zwick Roell Z100 universal testing machine. The test involved applying a load 100 mm from the specimen’s joint, as shown in (a).
Figure 3. Joint testing: (a) the diagram of joint loading, (b) working diagram of joint strength testing.

The loading rate was set to 8 mm/min and the load was applied to the specimen until failure occurred. The maximum force, i.e. the failure load and the deformation at failure, were recorded, as shown in (b). The analysis of the curves of the force-displacement diagram showed that the force values of 0.4 Fmax of the tested joints were located in the elastic region, i.e. below the point of proportional limit force. Increased displacements that occurred at the beginning of loading were neglected in data analysis
The stiffness was investigated by measuring the displacement of points in the direction of the force . On the basis of the obtained values, the stiffness coefficient
(N/mm) of the examined joints was calculated as:
(1)
(1) were
is maximum force and
displacement at the 40% of maximum applied load. This method of defining the stiffness coefficient allowed easier experimental determination of strains caused by external loading and easier use of numerical results of strains to compare experimental and numerical results of joint stiffnesses.
2.3. Numerical analysis of joints with connectors
The numerical results were obtained using the CAD/CAM/CAE system CATIA. The average failure force of joints obtained from the experiments was used in a simplified numerical analysis of stress and strain of the loaded joints. The physical model was defined based on the experimental loading diagram of the joints, as shown in . The vertical loading force of each model of joints was placed on the cross section of the horizontal wooden part (rail). The lower cross sections of the vertical wooden parts (post) of the joint models were clamped. The local coordinates (L, R, T) were used to define the grain directions of the wooden parts of the joints.
Figure 4. The physical model and mesh of the joints: (a) connector - type 1 (A- without inner wall), (b) reinforced connector – type 2 (C – without inner wall).
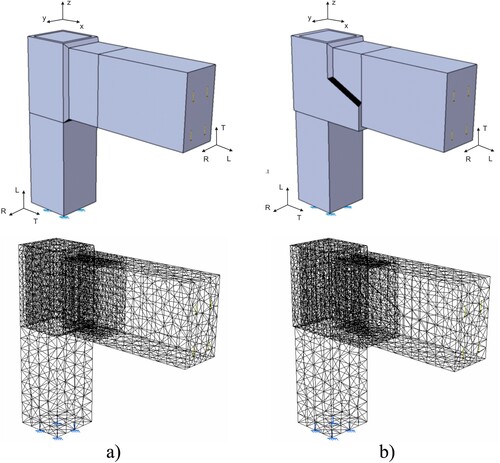
The numerical 3D linear-elastic model for both the orthotropic material (wooden parts) and isotropic material (connector) was solved by a method based on the finite elements. The printing orientation is a very important variable, because 3D printing produces part of the material with anisotropic mechanical properties. However, the printing orientations of connector parts were neglected due to the geometric complexity of the connector, which consequently affects the complexity of the physical model of the connector. Mesh models of joints with an unreinforced connector and reinforced connector are shown in . The 10-node parabolic tetrahedron finite element was used to create numerical model (about 18,177 nodes and 13,425 elements per model). The mesh was selectively refined to obtain more accurate results.
Calculation was carried out for beech wood, and the orthotropic elastic properties of the wood are presented in (Smardzewski Citation2008). The modulus of elasticity in the flexure of isotropic plastic filament (Z-ABS) is 1.08 GPa and Poissońs ratio (Zortrax Citation2021). The effects of the adhesive, i.e. glue line and interference fit, were neglected.
Table 1. Elastic properties of beech wood (Smardzewski Citation2008).
Three different concepts of boundary conditions between the surfaces of wooden parts and connectors were analysed. Boundary conditions were based on the assumption that different stress states occur, and there are different bond strengths on different contact areas between the wood and connector material. In the first, a fastened connection was modelled between all contact surfaces of the wooden parts and connector. In the second model, the contact connection was used on the cross sections of all wooden parts that were touching the connector. In the third model, the contact connection was modelled on the lateral contact surface of the wooden post and connector.
2.4. Seat and back static load tests
A chair was made from the beech wood elements and connectors that were tested in the first part of this study. The connectors were modified (added side connections) to connect the front and side rails to the legs. A plywood seat panel (15 mm thickness) was added and fixed with 4 × 30 mm wood screws to the frame. The chair was tested according to standard EN Citation1728:Citation2002 Domestic furniture – Seating – Test methods for determination of strength and durability (EN Citation1728:Citation2002). The seat front edge static load test (load of 1000 N), the seat and back static loading test (seat 1300 N and back 450 N), the leg forward static test (500 N) and leg sideways static load (350 N) were carried out.
The chair was standing on a solid floor and the force was applied using a standard loading pad attached to a pneumatic cylinder. Loading force was regulated by the applied air pressure. Wooden stops were used on the floor to prevent the chair sliding during the leg forward and leg sideways test ( right).
3. Results and discussion
3.1. Strength of joints with 3D-printed connectors
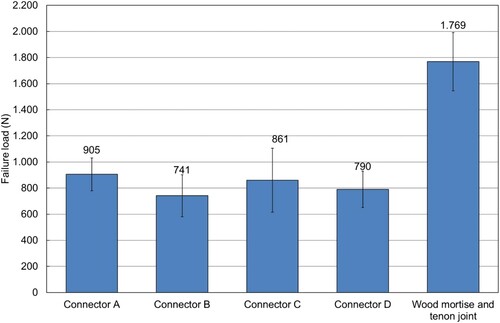
The strength of the joint was characterised by the experimental failure loads, due to the similarly presented joint stiffness as well as the simpler numerical calculation involved and the ease of comparing the results. Ten specimens were made and tested for each connector. The average force at failure, , was determined from the measurements. The highest average failure force was reached for connector A (905 N) and the lowest for connector B (741 N).
Figure 5. Average failure load (N) for the various 3D-printed connectors and wood mortise-and-tenon joints.
The results of failure forces were lower for the connectors B and D, connectors that had an inner wall inside the connector to which wooden parts were bonded, compared to the failure forces of connectors without an inner wall (connectors A and C). The strength of connectors without an inner wall, for which it was assumed that the failure load was an indicator of joint strength, had 22.0% (connector A) and 9.0% (reinforced connector C) higher strength than the connectors without an inner wall (connector B and reinforced connector D). Similar results for the effects of the structural differences of the connectors on the strength of joints with connectors (models with and without inner walls) were obtained by testing frontal parallel joints with printed connectors (Hajdarevic et al. Citation2019). The results showed that the effects of connector reinforcement on the joint strength were inconsistent. The connector without an inner wall (connector A) had 5% higher strength than the reinforced connector without an inner wall (connector C). In contrast, the connector with an inner wall (connector B) had 6% less strength than the reinforced connector with an inner wall (connector D).
The average failure forces were lower than the strength of the traditional wooden mortise-and-tenon joints for chairs (). Iskra (Citation2012) tested wooden mortise-and-tenon joints from beech wood (dimensions of the tenon: length 25 mm, width 40 mm and thickness 12 mm), and the average maximum load force was 1769 N. The ratios of the average values of failure load of connectors and failure load of the traditional wooden mortise-and-tenon joints were 0.51 (connector A), 0.42 (connector B), 0.49 (connector C) and 0.45 (connector D). The results showed that the 3D connectors have relatively good mechanical properties, despite having a small wall thickness of 3 mm or 5 mm.
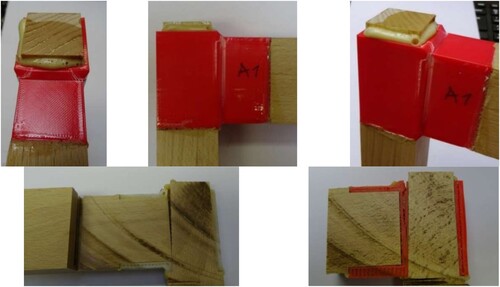
In all cases the joint failed at the 3D-printed material and there was no failure observed with the wooden pieces. The connectors were printed from red coloured ABS plastic, which changed colour to whiter shades when it was exposed to higher stresses. In this way the overloaded areas first changed colour and then the visible fracture occurred. During testing, the connector typically failed in the upper part of the connector, where the material was exposed to a tensile load, as seen in . The failure on connectors with an inner wall occurred mainly inside the wall from the printed materials, and there was no direct contact between the pieces of wood. Inside the joint, the fractures occurred in the wood-adhesive-ABS joint, where delamination of the printed material and inside adhesive occurred.
Figure 6. Typical failures for the 3D-printed connector (connection between front leg and side rail): connector type A (top three photos), vertical sections of connector type A (bottom left) and vertical sections of connector type B (bottom right).
The different concepts of boundary conditions in the numerical model were the result of considering the typical fracture of the joint, i.e. different bond strengths of wood-adhesive-ABS combinations. In the first model, it was assumed that all bonding lines had identical strength. The assumption for the second model was that the tensile strength of the bonding line at the cross-sectional areas of the wooden elements was negligible, and thus equal to zero. The last, third model additionally assumed that the tensile strength of the bonding line on the lateral contact surface of the wooden post and connector was negligible, i.e. equal to zero.
The joint deformations obtained by numerical calculation of the first and third models which were loaded with failure force are shown in . The result for the first deformed model shows that the characteristic gaps did not appear. For third model of a joint, a gap occurred between the lateral contact of the post and ABS and /or cross section of the rail in the tension zone of the joint. The gap appeared due to the assumption that the delamination strength of the adhesive was negligibly small.
Figure 7. Deformation of joints obtained by numerical calculation: (a) connector A – I mod (left) and III mod (right), (b) (a) connector C – I mod (left) and III mod (right).

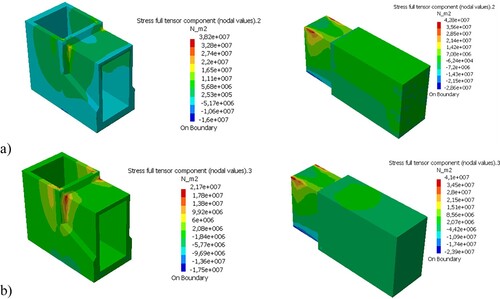
The distribution of effective stress (the Von Mises stress) in both types of connectors and for I numerical model and III numerical model which were loaded with failure force Fmax are shown in and .
Figure 8. Distribution of von Mises stress of the first type of connectors: (a) connector A – I mod (left) and III mod (right), (b) (a) connector B – I mod (left) and III mod (right).
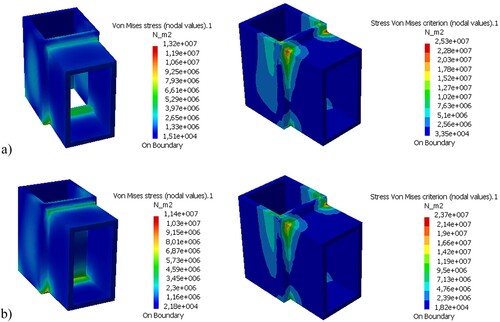
Figure 9. Distribution of von Mises stress of the second type of connectors: (a) connector C – I mod (left) and III mod (right), (b) (a) connector D – I mod (left) and III mod (right).
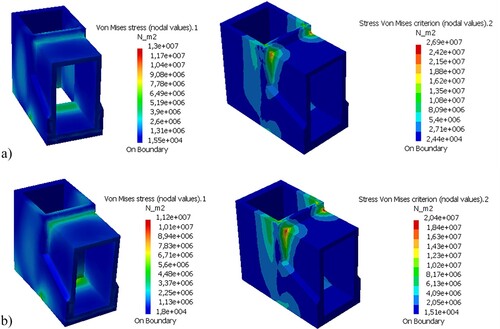
For all the first numerical model of connectors, the maximum and increased values of von Mises stress occurred in the lower width edge zone of the connectors i.e. the area with dominant negative normal stress. The second zone of increased values of stress was the upper width edge of the connectors i.e. with dominant positive normal stress. The maximum values of von Mises stress for all examples of the first numerical model were approximately 11–13 MPa, much less than the strength of ABS material, which has a tensile strength of 30.46 MPa and compressive strength of 37 MPa (Zortrax Citation2021).
For all the third numerical model of the connectors, the stress distribution corresponded well to the deformations of the connectors obtained by testing. The maximal values of stress occurred at the upper intersections of the width edges and longitudinal edges of the connectors in the area with dominant positive normal stress. These zones are the places where the highest deformations and eventually fractures occurred. All other connector surfaces sustained smaller stress. The increased values of von Mises stress occurred in the two upper zones of the connectors and in the lower width edge zone with dominant negative normal stress. The maximum values of von Mises stress for all examples of the III numerical model were approximately 20–27 MPa, which were close to the tensile strength of ABS material, at 30.46 MPa (Zortrax Citation2021).
Within the analysed numerical models, there were no particularly large differences between the von Mises stress distribution or von Mises stress values for different designs of connectors (with/without an inner wall or reinforced connectors).
The results obtained by numerical calculation show that the normal stresses were the dominant component stress in the loaded joints. The maximal values of normal stresses occurred in a cross section of the rail, i.e. in the left end of length
, . In that cross section, all connectors had the same or slightly corrected geometric characteristics (reinforced connectors). A rail section of the joint in which the connector is located is analysed as the composite material. The normal stress distribution in the cross section of the composite parts of joints not only depended on the cross-section geometry, but also on the materials.
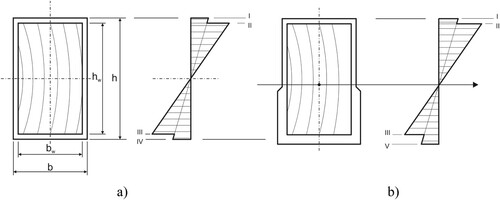
The length was a composite section of the joint i.e. the cross sections of this part of the joint were made of beech wood and ABS, as shown in and . In order to avoid a cross section with stress concentration, the distribution and values of normal stress
were analysed in a composite cross section of the rail which was located 80 mm from the applied load. The results of the calculation shown in were obtained by the analytical method of transforming the cross section in Matlab software. The equation used has the following general form:
(2)
(2) where:
,
is the modulus elasticity of ABS,
is the modulus elasticity of beech wood in the longitudinal direction,
is the bending moment,
is the distance from the neutral axis and
is the moment of inertia of the transformed cross section.
Table 2. Normal stress in the cross section of the rail at a distance of 80 mm from the applied load.
The distribution of normal stress is linear within wood and ABS, and there is a discontinuity at the interface of these two materials (levels II and III in ). The values of normal stress within the cross section depend upon the mechanical properties (relative stiffnesses) of the materials as well as the geometry of the cross sections of connectors. The maximum stresses in each of the materials, as seen in , were within the relevant materials’ elastic limits for both applied loads and connector designs. The differences between the values of the normal stress for the reinforced cross section of the second type of connectors for both applied load (
N and
) were small in contrast to the values obtained for the unreinforced cross section of the first type of connectors. The results show that the greater wall thickness and position of the reinforcements did not contribute much to the better properties of the composite cross section of the rail which is at a distance of 80 mm from the applied load, and it could be assumed that the reinforcement did not contribute to the better mechanical properties of the connector.
Figure 10. Cross section of a composite part of the joint (length ) and distribution of normal stress: (a) first type of connector (connectors A and B), (b) second type of connector (connectors C, D).
The numerical results of the normal stress for the third model of the first type of connectors are shown in and the numerical results of the normal stress
for the third model of the second type of connectors are shown in .
Figure 11. Distribution of normal stress of the first type connectors: (a) III mod of connector A – connector (left) and wooden rail (right), (b) (a) III mod of connector B – connector (left) and wooden rail (right).
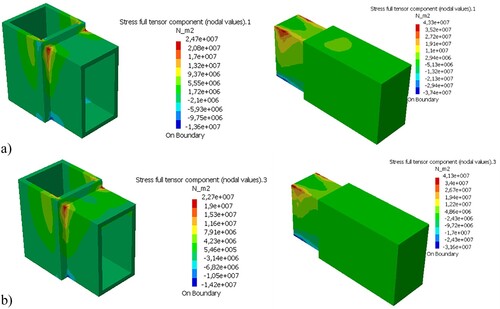
Figure 12. Distribution of normal stress of the second type of connectors (reinforced): (a) III mod of connector C – connector (left) and wooden rail (right), (b) (a) III mod of connector D – connector (left) and wooden rail (right).
The distributions of normal stresses within the analysed cross section (at a distance 80 mm from the applied load) coincided with the analytical calculations. The numerical values of normal stress were a good match with the analytical results in the analysed cross sections, because they were away from the zone of stress concentration.
For all connectors of the third numerical model, the maximum and increased values of normal stress occurred in the cross section at a distance 100 mm from the applied load, at the upper intersections of the width/height edges and longitudinal edges of the connectors. The maximum values of positive normal stress
for all examples of the third numerical model were slightly less than the tensile strength of ABS material. These zones where the places where the highest deformations and eventually fractures occurred, and all other connectors surfaces sustained less stress.
The distribution of normal stresses for the horizontal wooden part of joints (rails) obtained by numerical calculation shows that the increased values of normal stress
occurred along the longitudinal edges of the tenons and in the upper zones of tenon cheeks. The maximum values of normal stress
that occurred in the tension and compression zones of the tenons were less than the tensile and compression strengths of beech wood, respectively, with a tensile strength of 135 MPa and compressive strength of 62 MPa (Kollman and Cote Citation1984).
3.2. Stiffness of joints with 3D-printed connectors
The experimental results and numerical results for the stiffness coefficients of the three different models of boundary conditions between wooden parts and connectors are shown in and . The experimental and numerical results of the stiffness coefficient K were obtained by the expression (1).
Figure 13. Stiffness coefficient K of the joints with connectors.
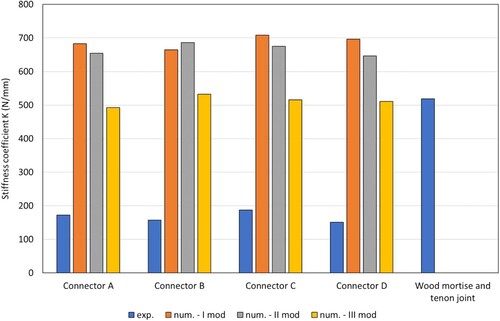
Table 3. The experimental and numerical stiffness coefficient K of the joints with connectors.
The highest experimental values of the stiffness coefficients of joints were obtained for connectors without an inner wall, i.e. connectors A and C. Based on the experimental results, the effects of connector reinforcement on the stiffness coefficient of joints with connectors could not be estimated. The average experimental stiffness coefficients of connectors was lower than the stiffness coefficient (519 N/mm) of the traditional wooden mortise-and-tenon joints for chairs which had similar dimensions to those analysed in this study (Iskra Citation2012). The ratios of the average values of stiffness coefficients of connectors and stiffness coefficients of the traditional wooden mortise-and-tenon joints were 0.35 (connector A), 0.30 (connector B), 0.36 (connector C) and 0.30 (connector D).
The numerical results showed much higher stiffness of the joints with connectors, i.e. much smaller displacements in the direction of the force for all three different models of boundary conditions between the wooden parts and connectors than the displacements measured in the test. The ratio between the stiffness coefficients for the second model of connectors and the first model of connectors ranges from 0.93–1.03, and the ratio between the stiffness coefficients for the third model of connectors and the first model of connectors ranges from 0.72–0.80.
The highest ratio between the experimental and numerical results of the stiffness coefficients is for the third model of connectors, and this ranges from 0.30 (connectors B and D) to 0.35 and 0.36 (connectors A and C). A comparison of the numerical and experimental results indicates that the accuracy of the established models of connectors with the introduced simplifications and assumptions was not large, but it was still able to predict the behaviour of loaded joints with connectors in the domain of linear-elastic deformation.
The ratios of the stiffness coefficients of joints with four different connector configurations are shown in .
Table 4. The ratios of the stiffness coefficients K of the joints with four different connectors.
The experimental results show that the stiffness of connectors without an inner wall was 10.0% (connector A) and 24.0% (reinforced connector C) higher than for the connectors without an inner wall (connector B and reinforced connector D). The opposite results with regard to the effects of the inner wall of connectors on the stiffness of joints with connectors were obtained by testing frontal parallel joints with printed connectors (Hajdarevic et al. Citation2019).
Slightly higher stiffnesses of the connectors without inner wall (connector A 3.0% and connector C 2.0%) were obtained by numerical analysis of the first model, i.e. a fastened boundary condition between all contact surfaces. In the third model, i.e. the contact boundary condition on cross sections of all wooden parts and, additionally, the lateral surface of the wooden post, connector A (connector without an inner wall) had 7% less stiffnesses than connector B (with an inner wall). A decrease in stiffness was not observed in the analysis of the third model of reinforced connectors (connectors C and D).
Both experimental and numerical results show that a connector without an inner wall (connector A) had less stiffness than a reinforced connector without inner wall (connector C). In contrast, both experimental and numerical results (II and III models) showed that a connector with an inner wall (connector B) had higher stiffness than a reinforced connector with an inner wall (connector D). In addition to the geometry and material used to reinforce the connector, the effects of the properties of the glue bond between different wooden surfaces and ABS material was also noticeable.
The experimental stiffness coefficients ranged from 30 to 36% of the numerical stiffness coefficients. The main reason for such differences in results are due to various factors that were ignored in the numerical model, such as the adhesive joint, interference fit and (especially) anisotropic mechanical properties of the printed material.
3.3. Seat testing according to standards
The chair made with 3D-printed connectors was tested according to standard EN Citation1728:Citation2002 Domestic furniture – Seating – Test methods for determination of strength and durability, as shown in . The standard requires that various properties are evaluated, but we have attempted to include a portion of these tests to show how the partial strength (joint strength) corresponds to the standard requirements for a complete chair.
Figure 14. From left to right: seat loading test, seat and back loading test, front edge forward loading test.
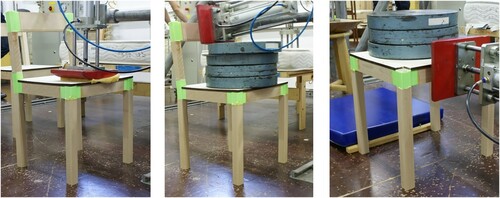
First the seat front edge static load was examined using a vertical loading of 1000 N at 80 mm back from the front edge (, left photo), The force was applied by a pneumatic cylinder from top and repeated 10 times. The chair withstood this loading. Then, the seat and back loading points were determined according to the standard by using the prescribed template. The seat and back static loading tests were then carried out. The seat was loaded with 1300N static load (mass) and the backrest was loaded with 450 N by a pneumatic cylinder. The backrest did not withstand the loading and broke at the 3D-printed connector, with the connector breaking along a 3D-printed layer. The crack began at the front of the connector and propagated to the backside. The rest of the chair structure, i.e. seating and legs, were not damaged in this test.
The chair also withstood the leg forward static test (500 N forward loading at the back of seating- right) and leg sideways static load test (350 N from side of seating) with 1000 N of seat balancing load in both cases.
The chair had enough strength for a person to sit on it, but the backrest connector was too weak for usage. This detail of the connector needs to be redesigned and reinforced to withstand the required loads. The orientation of the layers needs to be carefully chosen during the preparation of the 3D model for printing to ensure maximum strength of the connector, according to the expected loading directions. The backrest connector in complete chair test failed, splitting between the printed layers, because the loading from the backrest transferred to tensile loading between the layers. If the connector was printed with 90° rotation, and thus printing layers parallel to the side plane, the tensile stresses would act in the same direction as the printing lines, where 3D-printed parts are significantly stronger. Fatigue tests should also be done to determine the effects of cyclic loading on the connectors.
4. Conclusions
This study investigated the applicability of 3D-printed elements for connecting wood parts in furniture. The analysis of the mechanical properties of the chair’s mortise-and-tenon joints with two types (with and without inner wall) of 3D-printed, unreinforced and reinforced, connectors was performed.
The results showed that joints with 3D-printed connectors had a strength (failure load) that was 42–51% lower than that achieved with traditional wooden mortise-and-tenon joints with similar dimensions. The strength of joints with connectors without an inner wall, both unreinforced and reinforced, was higher than that of the connectors with an inner wall, while the results with regard to the effects of connector reinforcement on the joint strength were inconsistent.
Both experimental and numerical results showed that the connectors without an inner wall had less stiffness than the reinforced connectors without an inner wall and, in contrast, that the connectors with an inner wall had a higher stiffness than the reinforced connectors with an inner wall, and thus that the effects of connector reinforcement on the stiffness coefficient of joints with connectors could not be estimated. The experimental and numerical results indicate that the effects of reinforcement of the connectors were not identified because of the small thickness and inadequate geometric position and arrangement of the reinforcement ABS material, which has considerably worse mechanical properties than wood. But with proper design, optimisation and selected materials, 3D-printed connectors could compete with connectors made from plywood or even aluminium (Aiman et al. Citation2020).
The tests of the assembled chair showed that the seat is strong enough, but the backrest broke at the 3D-printed connector. The connector for the backrest should thus be redesigned (orientation of printing layers according to the expected loading directions) to withstand higher loads.
Additional research needs to be done to optimise the materials used (with the possible use of fibre reinforced materials), construction of the connector (using a reinforcement material and/or thicker walls in important positions), internal structure of the 3D-printed parts (percentage and pattern of infill), model printing orientation according to expected loading directions, and the adhesives used. With proper construction and reinforcement, such a connector could be used for the production of unique, individually designed chairs.
Acknowledgements
We also thank Erika Valentinčič for her enormous help in the laboratory and Ministry of Education, Science and Sport RS in the frame of the WoodWisdom-Net project W3BWood Believe.
Disclosure statement
No potential conflict of interest was reported by the author(s).
Additional information
Funding
References
- Aiman, A. F., Sanusi, H., Haidiezul, A. H. M. and Cheong, H. Y. (2020) Design and structural analysis of 3D-printed modular furniture joints. IOP Conference Series: Materials Science and Engineering, 932, 012101. doi:10.1088/1757-899X/932/1/012101
- ASTM. ASTM F2792-12 (2012). Standard terminology for additive manufacturing technologies. West Conshohocken: ASTM International.
- Aydin, M. (2015) Additive manufacturing: is it a new era for furniture production. Journal of Mechanics Engineering and Automation, 5(1), 38–347. doi:10.17265/2159-5275/2015.06.002
- Chua, K. C., Chou, M. S. and Wong, T. S. (1998) A study of the state-of-art rapid prototyping technologies. The International Journal of Advanced Manufacturing Technology, 14, 146–152. doi:10.1007/BF01322222
- Conner, B. P., Manogharan, G. P., Martof, A. N., Rodomsky, L. M., Rodomsky, C. M., Jordan, D. C. and Limperos, J. W. (2014) Making sense of 3-D printing: Creating a map of additive manufacturing products and services. Additive Manufacturing, 1-4, 64–67. doi:10.1016/j.addma.2014.08.005
- Derikvand, M. and Ebrahimi, G. (2014) Strength performance of mortise and loose-tenon furniture joints under uniaxial bending moment. Journal of Forestry Research, 25(2), 483–486. doi:10.1007/s11676-014-0479-5
- DeZeen (2013) Mycelium Chair by Eric Klarenbeek is 3D-printed with living fungus. (2013). Accessed 5 January 2022, available at: https://www.dezeen.com/2013/10/20/mycelium-chair-by-eric-klarenbeek-is-3d-printed-with-living-fungus/.
- Eckelman, C. A. and Sudarth, S. K. (1969) Analysis and design of furniture frames. Wood SciTechnol, 3, 239–255.
- EN 1728 (2002) 1728:2002 - domestic furniture - seating - test Methods for Determination of Strength and Durability (Brussels: European Committee for Standardization (CEN)).
- Gebler, M., Anton, M. J., Uiterkamp, S. and Visser, C. (2014) A global sustainability perspective on 3D printing technologies. Energy Policy, 74, 158–167. doi:10.1016/j.enpol.2014.08.033
- Gress, D. R. and Kalafsky, V. R. (2015) Geographies of production in 3D: Theoretical and research implications stemming from additive manufacturing. Geoforum; Journal of Physical, Human, and Regional Geosciences, 60, 43–52. doi:10.1016/j.geoforum.2015.01.003
- Grujovic, N., Zivic, F., Zivkovic, M., Sljivic, M., Radovanovic, A., Bukvic, L., Mladenovic, M. and Sindjelic, A. (2017) Custom design of furniture elements by fused filament fabrication. Proc. Inst. Mech. Eng. Part C J. Mech. Eng. Sci., 231, 88–95. doi:10.1177/0954406216646401
- Hajdarevic, S., Obucina, M., Mesic, S. and Martinovic, S. (2019) Stress and strain of the frontal parallel joints with 3D printed connectors. In: Proceedings of the 29th DAAAM International Symposium, 0361-0368. https://doi.org/10.2507/29th.daaam.proceedings.052.
- Hajdarevic, S., Obucina, M., Mesic, E. and Martinovic, S. (2020) Strength and stiffness analyses of standard and double mortise and tenon joints. BioResources, 15(4), 8249–8267. doi:10.15376/biores.15.4.8249-8267
- Henke, K. and Treml, S. (2013) Wood based bulk material in 3D printing processes for applications in construction. Eur. J. Wood Prod., 71, 139–141. doi:10.1007/s00107-012-0658-z
- Hopkinson, N., Hague, R. J. M. and Dickens, P. M. (2006) Rapid Manufacturing. An Industrial Revolution for the Digital Age (Chischester: John Wlley and Sons Ltd.).
- Iskra, B. (2012) Optimal structure choice of the Ken chair. BSc thesis at the Department of Wood science and technology, Biotechnical Faculty, University of Ljubljana, Slovenia.
- Kasal, A., Kuşkun, T. and Smardzewski, J. (2020) Experimental and numerical study on withdrawal strength of different types of auxetic dowels for furniture joints. Materials, 13, 4252. doi:10.3390/ma13194252
- Krzyżaniak, Ł, Kuşkun, T., Kasal, A. and Smardzewski, J. (2021) Analysis of the internal mounting forces and strength of newly designed fastener to joints wood and wood-based panels. Materials, 14, 7119. doi:10.3390/ma14237119
- Kollman, F. and Cote, W. A. (1984) Principles of Wood Sience and Technology Volume I, Solid Wood (New York: Springer-Verlag).
- Ntintakis, I., Stavroulakis, G. E. and Plakia, N. (2019) The perspective of topology optimization on 3d printed furniture prototypes. In: Sim-AM 2019: II International Conference on Simulation for Additive Manufacturing, 225-236. CIMNE.
- Smardzewski, J. (2008) Effect of wood species and glue type on contact stresses in a mortise and tenon joint. Journal of Mechanical Engineering Science, 222(12), 2293–2299. doi:10.1243/09544062JMES1084
- Smardzewski, J., Rzepa, B. and Kiliç, H. (2016) Mechanical properties of externally invisible furniture joints made of wood-based composites. BioResources, 11(1), 1224–1239. doi:10.15376/biores.11.1.1224-1239
- Tankut, A. N. and Tankut, N. (2011) Section modulus of corner joints in furniture frames as engineering design criteria for their efficient construction. Materials & Design, 32, 2391–2395. doi:10.1016/j.matdes.2010.10.027
- Tavsan, F. and Sonmez, E. (2015) Biomimicry in furniture design. Procedia-social and Behavioral Sciences, 197, 2285–2292. doi:10.1016/j.sbspro.2015.07.255
- Wilson, B. (2006) Wood joint torture test. Wood Magazine, 173, 58–63. Accessed 19 February 2015, http://www.survivorlibrary.com/?page_id = 1409.
- Zortrax, S. A. Z-ABS Technical data sheet, Date of issue: 01.01.2014; Update: 22.06.2021;| Version: 4.00; Accessed 15 December 2021, https://cf.zortrax.com/wp-content/uploads/2018/06/Z-ABS_Technical_Data_Sheet_eng-1.pdf.