
 ?Mathematical formulae have been encoded as MathML and are displayed in this HTML version using MathJax in order to improve their display. Uncheck the box to turn MathJax off. This feature requires Javascript. Click on a formula to zoom.
ABSTRACT
One obstacle to the industrial processing of oil palm wood is its nearly water-saturated state in green condition and its high tendency to develop cell collapse during kiln drying. This study analyzed mechanical dewatering by flat compression as an alternative pre-drying method for wet oil palm sawn timber. In the process, boards 700 mm long were compressed at ratios of 40% and 60% using a laboratory press, which resulted in water extraction of the free water varying between 38–52% and 60–73%, respectively. Since unperforated press plates were used, the water could only escape over the crosscut and long edges. The extent to which the crosscut and long edges were involved in dewatering was examined, and found to depend on the position of the board in the trunk due to the different water permeability conditions at the different heights. Permeability measurements, therefore, were carried out on cylindrical specimens using a specifically designed testing device. For the analysis of the hydrostatic pressure development in the boards, three pressure transducers were installed at different distances to the crosscut at half board thickness. The analysis of the recovery of compression showed, that the boards recovered to a large extend immediately after compression.
1. Introduction
The oil palm plantation area grows exponentially at the tropics, mainly in Southeast Asia and therefore, the amount of available oil palm wood continues to increase each year. At the end of the rotation cycle of 25–30 years, the plantations are cleared and almost all the felled trunks remain unused on the plantation as biowaste. Current estimates suggest an annual trunk volume worldwide of more than 100 million m³ (Fruehwald and Fruehwald-Koenig Citation2019). One of the obstacles to the use of oil palm wood is its high porosity and high moisture content of up to 600% (oven-dry basis) (Gan et al. Citation2001, Koelli Citation2016). Oil palm trunks consist of a vascular bundle system embedded in a parenchymatous ground tissue (Corley and Tinker Citation2015). The hard vascular bundles consist of 1–3 xylem vessels responsible for water transport, phloem sieve tubes for transport of photosynthesis assimilates and a fibrous sheath for mechanical support. The soft parenchymatous ground tissue stores water, sugars and starch; it is composed of thin-walled parenchyma cells arranged with wide intercellular spaces. The parenchyma cells are interconnected by simple pits and connected to the vessels by sclariform pits (Parthasarathy and Klotz Citation1976, Tomlinson Citation1990, Lim and Fujii Citation1997). The pit openings affect the permeability of the wood by allowing liquids or gases to pass more easily through the cell walls and flow through the void spaces of the wood. The permeability indicates how easily liquids or gases are transported through a porous solid under a pressure gradient and is, therefore, important for wood impregnation and wood drying (Siau Citation1984). Choo et al. (Citation2013) examined the gas and water permeability of oil palm wood parallel to the vascular bundles and found that water permeability in the wet state exceeds gas permeability in the dry state, suggesting that some form of pit aspiration occurs during the drying process. Initially during drying, the free water evaporates and escapes from the wood allowing air to fill the vacated spaces. When this exchange is unsuccessful, the cells are in danger of cell collapse. Cell collapse occurs in the early stages during drying when the free water is moved to the surface by the capillary tension that develops at the water–air interface due to negative pressure (Hawley Citation1931). When the negative pressure exceeds the perpendicular compressive strength, the cell wall collapses (Siau Citation1984). Additionally to the capillary tension, compressive stresses arise on the moist interior of the sawn timber when the dry surface layers start to shrink (Skaar Citation1988). Since there is almost no air inside the wood, the thin parenchyma cell walls are subjected to higher forces than they can withstand, resulting in substantial deformations during drying (Killmann and Lim Citation1985, Khozirah et al. Citation1991, Kurz Citation2013, Fruehwald-Koenig et al. Citation2023). Cell collapse is a major obstacle for the use of oil palm wood because it requires that drying be done very carefully with high humidity and low drying rates, resulting in a long and expensive process (Fruehwald and Fruehwald-Koenig Citation2019). Temperatures need to be low but also high enough to avoid mold growth, which develops easily due to the high sugar content in oil palms. Research to date focuses on the use of sugars stored in oil palm sap for the production of biochemicals such as bioethanol or lactic acid (Kosugi et al. Citation2010, Yamada et al. Citation2010, Dirkes et al. Citation2021). When oil palm sawn timber is kiln-dried, all the sugar remains in the wood and a large amount of water needs to be evaporated. Therefore, Rittiphet et al. (Citation2021) studied the influence of mechanical compression prior to kiln drying on the occurrence of drying defects such as cell collapse and internal voids. They used lateral restraint to compress specimens with dimensions of 50(t) · 75(w) · 350(l) mm³ at compression ratios ranging from 15% to 65%. The reduction in thickness achieved is mainly due to the reduction of the lumina of the parenchyma cells, which are completely water-saturated after the air is removed. When the wood is completely water saturated, the water removal is linearly dependent on the degree of compression since the volume of the removed water corresponds to the reduction in wood volume.
Rittiphet et al. (Citation2021) found that voids caused by cell collapse are eliminated when compression is above 45%, but also recognized microcracks in the thin-walled parenchyma. During the compression, the thin-walled parenchyma cells collapse and microcracks occur as well as shear failure between the parenchyma and the vascular bundles. During drying, the damages caused by compression lead to shear-induced voids and a reduction in mechanical properties. Like the drying process, the compression process also has a strong influence on the wood properties, and therefore the benefits of compression must be balanced with the disadvantages. The damages caused by compression reported by Rittiphet et al. (Citation2021) are compensated by the slight increase in density, and therefore the shear and compressive strength does not differ significantly between dried, compressed and uncompressed specimens. The advantages of mechanical dewatering are in addition to the reduced amount of water that must be evaporated, in the improved drying process. Microcracks increase the permeability of the wood and hence facilitate dewatering and drying (Simpson Citation1983). After the removal of the compressive force, the thickness partially recovers, resulting in air filling the empty spaces of the removed water. Since the risk of cell collapse is particularly high at high moisture contents when there is little air in the wood, predrying can reduce the risk of drying cell collapse because air, unlike water, expands when negative capillary pressure occurs. Mechanical dewatering of oil palm veneers using a roller press at pressures between 7.5 and 8 MPa was performed by Choo et al. (Citation2015) as a predrying process to reduce the high initial moisture content and thus accelerate subsequent drying of the veneer. Oil palm boards of 2 m length were mechanically dewatered with a roller press (Fruehwald-Koenig et al. Citation2023) before they were thermo-hygro-mechanical densified to improve the elasto-mechanical properties (Koelli and Fruehwald-Koenig Citation2024). So far, no study has been conducted on the mechanical dewatering of oil palm sawn timber with a flat press. Therefore, the mechanical dewatering of wet oil palm boards using a flat press was investigated in this study.
The aim of this study was to analyze the dewatering behavior of wet oil palm boards during flat compression in order to create a starting point for a dewatering process that can also be implemented for longer boards.
2. Material
The material originates from oil palms (Elaeis guineensis jacq. var. Tenera) felled in Malaysia (Johor) and transported in 5.2 m sections to Germany, then stored frozen at −10°C until processing. Due to the high sugar and starch content oil palm wood is very prone to mold and decay and therefore must be stored frozen if immediate processing or sample preparation and analysis is not possible. The trunk sections were then sawed into two 2 m long trunk parts from which discs were cut at the bottom, middle and top and used as test specimens to determine the oil palm wood’s permeability, among other properties. shows the crosscut surface of a trunk section with the permeability specimens schematically drawn ((a)) and the sawing pattern of the mechanically dewatered boards ((b)). Since many wood properties vary along the trunk diameter, due to the density gradient, the crosscut surface was classified into “outer”, “inter” (intermediate) and “inner” zones based on earlier research (using terms such as “outer/peripheral”, “inter/middle”, “inner/central”, cf. Killmann and Lim (Citation1985), Bakar et al. (Citation2006)). The usual density range varies between 150 and 250 kg/m³ in the inner zone, between 250 and 400 kg/m³ in the inter zone and 400–550 kg/m³ in the outer zone (Killmann and Lim Citation1985, Gan et al. Citation2001, Koelli Citation2016).
Figure 1. Cross-section view of the trunk showing: (a) the cutting pattern of the permeability specimens, the position and alignment schematically shown by cylinders and the different trunk zones indicated by dashed lines, (b) the sawing pattern of the boards, the trimmed board cross-sections schematically shown by rectangles.
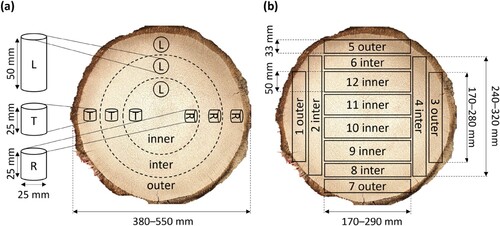
The transition between the zones is smooth and therefore the classification into three zones simplifies the actual property distribution, but it is useful for the analysis and comparison of the variating trunk properties. The permeability specimens were labeled according to their orientation (longitudinal – L, radial – R, tangential – T) and according to their location within the trunk zone (outer, inter, inner). They were all cut with a diameter of 25 mm, and radially and tangentially oriented specimens with a length of 25 mm and longitudinally oriented specimens with a length of 50 mm. Longitudinal specimens are cut longer due to the higher permeability in longitudinal direction. The boards were numbered in the order of sawing (1–12) and labeled according to their position within the trunk zone. The outer and inter boards containing cortex are partially trimmed after sawing. The diameter of the trunk parts varied between 380–550 mm. The width of the boards varied between 170–280 mm for the boards labeled “1” and “3”, 240–320 mm for the boards labeled “2” and “4” and 170–290 mm for the boards labeled “5"–"12”. The thickness of the boards was 33 mm for the outer and inter boards and 50 mm for the inner boards.
2.1. Specimens for permeability tests
The specimens for the permeability measurements (, a) were taken from two discs of 1 m trunk height from two oil palms and from one disc of 4 m trunk height from another oil palm. The discs (thickness 100–125 mm) were cut in the sawmill in frozen state with a crosscut saw between the trunk parts that were processed into boards. The discs were kept frozen at −10°C until specimen preparation. The specimen preparation was conducted in frozen state because the sawing and drilling performance is better in the solid state. For the specimen preparation, the discs were cut in pieces with the table saw using a sizing circular saw blade (Katana tool, by Leitz, Oberkochen, Germany) to maintain the targeted directions (L, R, T). Freeze drying became visible during the process at the outer centimeter below the crosscut surfaces which is brighter in color. To avoid any influence of the humidity loss by sublimation, the specimens were taken from the middle of the discs. The specimens were drilled in the direction of the main axis L, R and T with a tenon cutter. They are cylindrical with a diameter of 25 mm and a length of 50 mm for the longitudinal and 25 mm for the radial and tangential specimens. A total of 48 specimens were examined. shows the number of specimens analyzed in each trunk zone and direction.
Table 1. Number of permeability specimens of the analyzed directions and trunk zones from three trunks a, b and c.
2.2. Specimens for mechanical dewatering tests
The boards for the mechanical dewatering (, b) were sawn from 4 trunk parts of 2 oil palms. Trunk part 1 was taken from a different palm than trunk part 2, 3, and 4, due to material availability. The trunk parts, which had a length of about 2 m, are processed into boards using a band saw. After sawing, the boards were wrapped in plastic foil and stored frozen at −10°C. Freeze drying was visible at the outer millimeters which are brighter in color along with a small ice layer on top of each board. From each board, two pieces of 800 mm (hereinafter referred to as boards) were cut and 50 mm long specimens were cut from both board ends, so that the remaining board length was 700 mm (maximum press length). The two specimens were oven-dried to determine the wood moisture content (mc) by gravimetric analysis according to the EN 13183 standard (CEN Citation2002). The specimens were then conditioned to 20°C and 65% RH and the density of the specimens was determined according to the DIN 52182 standard (DIN Citation1976). The initial moisture content and mean density of the boards were determined by calculating the mean values of the two adjacent specimens. A total of 50 boards were mechanically dewatered. shows the trunk height, trunk part, compression ratio (CR), initial moisture content (IMC) and density of each board. The process (I, II) that was implemented on the specific boards is also shown in and explained in Chapter 3.
Table 2. Initial moisture content and mean density of the boards.
3. Methods
3.1. Permeability tests
Each specimen was tested nine times with three specimen lengths (the initial length of 50 or 25 mm was shortened two times during the measurement) and with three pressure gradients (1–3 m water column). shows the three test sequences with the corresponding lengths of the L, R, T specimens and the three different pressures.
Table 3. Permeability test sequences with specimen lengths and analyzed pressures.
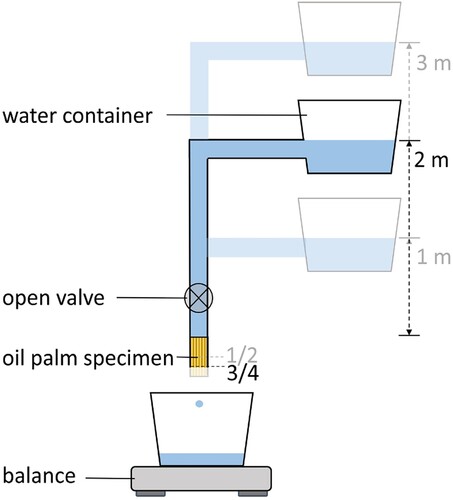
The experimental setup for the permeability measurements was developed by Voecker (Citation2021) (). After drilling and cutting to length, the specimens were coated with a sealing paste at the lateral surface and inserted into a shrink hose that had already been shrunk to a short (170 mm) PVC hose with hose connector. After shrinking the shrink hose with a heat gun, the PVC hose was filled with water and connected to a longer (5 m) PVC hose, which was connected to a water container at the other end and filled with distilled water. The water container was placed above the specimen, with the water level in the canister 1 m above the specimen and the valve was opened and the mass flowing through the specimen was measured using a laboratory balance (accuracy 0.01 g). The scale was read every 60 s, after 15 min the valve was closed, and the container was moved up to repeat the measurement at higher pressures of 2 and 3 m water column. In the second test sequence, the specimen was shortened to ¾ of the original length and in the third test sequence, the specimen was shortened to ½ of the original length using a precision band saw and the measurements were repeated with the three water levels. shows the experimental setup during the second test sequence (¾ of the original specimen length) with a pressure of 2 m water column.
Figure 2. Experimental setup for the permeability measurements.
For the calculation of the permeability Darcy’s law, which describes the flow of fluids through a porous solid was used. It is applicable to the flow of liquids through wood (Siau Citation1984, Hansmann et al. Citation2002) and can be used to calculate the wood’s specific permeability, which is the product of its permeability and the viscosity of the fluid. EquationEquation (1(1)
(1) ) shows the calculation of the specific permeability:
(1)
(1) where K is specific permeability, Q is volumetric flow rate, L is length of specimen in flow direction, η is viscosity of water, A is cross-sectional area of specimen perpendicular to flow direction and ΔP is pressure gradient.
In the literature, specific permeability is often expressed in the unit Darcy which is equal to 10−12 m2, therefore the values are presented in the same unit of 10−12 m2. For the statistical analysis of the permeability results IBM SPSS 29 software was used. A Two-Way ANOVA was performed for the lower trunk height for each trunk zone and orthogonal direction to analyze the effect of specimen length and pressure gradient on the specific permeability. Due to the number of test specimens, the analysis of the length and pressure gradient was only conducted with the specimens of the lower trunk height. When the data was not normally distributed according to Shapiro–Wilk test or no homogeneity of variances according to Levene test was given, the Kruskal Wallis test was used. Due to uneven distributions and strong outliers, the median of each trunk zone and direction for both trunk heights was calculated, and the median absolute deviation (MAD) was determined for each distinct group (e.g. outer zone in longitudinal direction at 1 m trunk height). A Kruskal Wallis test was performed to determine if there is a significant difference between the groups. Then a stepwise stepdown comparison following Campbell and Skillings was performed as a post hoc test to identify which groups differ significantly from each other. Afterwards, the permeability ratios between the directions (L: R: T) and trunk zones (outer: inter: inner) were calculated using the median. Since no permeability values were present from the inter area at 4 m trunk height, the values were estimated using the average between the outer and inner zone.
3.2. Mechanical dewatering test
Before defrosting, three holes were drilled with a diameter of 5.5 mm in each board. The drill holes are located 50, 200 and 350 mm (, a) from the bottom crosscut end and reach to the middle of the board. Then the boards were defrosted and both crosscut ends were wrapped with sturdy bags. Subsequently, stainless-steel pipes with an outer diameter of 6 mm (inner diameter 4 mm) were pushed into the respective drill holes. Due to the smaller diameter of the drill hole (5.5 mm), the pipe is attached firmly to the wood and during compression the connection between the wood and the pipe is further sealed. The pipes were slightly beveled on one end to make them easier to slide into the board and were connected on the other end to a compression fitting with a M8x1.25 external thread. The thread of the compression fitting was wrapped with PTFE tape to seal the thread. The pipes were then carefully filled with water using a syringe, and a pressure transducer (P8AP by HBM, Darmstadt, Germany; accuracy 0.3% at a measuring span of 100 bar) with its M8x1.25 internal thread was bolted to each pipe for the hydrostatic pressure measurement. shows an oil palm board with wrapped crosscut ends, inserted pipes and mounted pressure transducers ((a)) and a close-up view of a pressure transducer ((b)). The board was then placed in the flat laboratory press (SIEMPELKAMP, Krefeld, Germany) and the pressure transducers were plugged into the measuring amplifier (QUANTUMX from HBM, Darmstadt, Germany), which was connected to the PC and data were measured via the MX Assistant Software (HBM, Darmstadt, Germany) ().
Figure 3. Oil palm board with pressure transducers and wrapped crosscut ends.
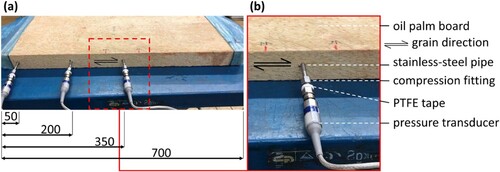
Figure 4. Experimental setup of the compression process for the mechanical dewatering.
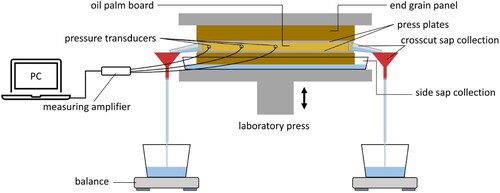
The oil palm boards were placed between smooth metal press plates and between end grain panels (surface-sealed pine wood) below and above the boards. The sap pressed out at the sides was collected in a tub and placed under the lower end grain panel. The sap pressed out at the crosscuts was fed into a hose on both ends. The hose led the sap into a bucket that was placed on a digital balance (accuracy 1 g). The balance was read every 30 s to measure the crosscut sap extraction. shows the experimental setup of the compression process for mechanical dewatering with the setup for hydrostatic pressure measurement and the sap collection devices.
Two process variants were carried out () for both compression ratios. The boards of process I were compressed at a constant speed of 5 mm/min. After reaching the target thickness, the distance was kept for 5 min. The boards of process II were compressed with 5 mm/min until ⅔ of the target thickness was reached, then the closing speed was reduced to 2.5 mm/min until reaching the target thickness and the distance was kept for 2.5 min. From each trunk part (1–4) and trunk zone (outer, inter, inner) one board was compressed with 40% and one was compressed with 60% compression ratio according to processes I and II (cf. ). shows the process parameters of the process variants I and II with the closing speed and the target thickness holding time.
Table 4. Process parameters of the process variants I and II.
Two compression ratios (cr), 40% and 60% were used for the experiments. The cr was calculated according to EquationEquation (2(2)
(2) ):
(2)
(2) where ti is initial thickness and tt is target thickness.
The moisture content mc was calculated according to EquationEquation (3(3)
(3) ):
(3)
(3) where mi/f is initial/ final mass and m0 is dry mass.
The mc measurements are conducted on 50 mm specimens that were cut off from both board ends during specimen preparation. The mean mc of each board is calculated as the average of the two 50 mm specimens. From the averaged mc, the dry mass m0 of the boards was calculated according to EquationEquation (4(4)
(4) ):
(4)
(4) where m0 is dry mass, mi is initial mass and mc is moisture content.
The theoretical maximum moisture content mcmax was calculated according to EquationEquation (5(5)
(5) ):
(5)
(5) where ρt is true density, i.e. density of solid wood cell wall without pores ≈ 1.5 g/cm³, ρb is basic density, i.e. ratio of dry mass over initial wet volume (Kollmann and Côté Citation1968, p. 200).
The free water mass mfw was calculated according to EquationEquation (6(6)
(6) ):
(6)
(6) where mtw is total water mass, i.e. the difference between initial mass and dry mass and mbw is bound water mass. Fiber saturation of wood is generally around 28% mc (Kollmann and Côté Citation1968), however Sulaiman et al. (Citation2012) estimated that oil palm wood has a lower mc between 22% and 25%. Therefore, the calculation was done based on an estimated fiber saturation at 25% mc.
The extracted water ew in % of the total free water was calculated according to EquationEquation (7(7)
(7) ):
(7)
(7) where mi is initial mass, mf is final mass and mfw,i is initial free water mass.
The extracted water per wood volume was calculated according to EquationEquation (8(8)
(8) ):
(8)
(8) where mi is initial mass, mf is final mass and Vi is initial wet volume.
The recovery ratio rr was calculated according to EquationEquation (9(9)
(9) ):
(9)
(9) where tr is recovered thickness, tc is compressed thickness and ti is initial thickness.
4. Results and discussion
4.1. Permeability
The specific permeability K is shown in a boxplot diagram in separated in the radial, tangential and longitudinal direction. In the radial and tangential direction, the ordinate axis goes to a maximum of 0.6 · 10−12 m2 and in the longitudinal direction to a maximum of 6 · 10−12 m2. The terms for the categories of the boxes (out-1, int-1, …) and the number of specimens are stated below after a #. Each specimen was tested nine times with the three pressure gradients and the three specimen lengths; therefore, nine values were obtained from each specimen. The statistical analysis revealed that neither specimen length nor pressure gradient has a statistically significant (p < 0.05) influence on the specific permeability. Therefore, the results are not distinguished between specimen length or pressure gradient. The specific permeability increases from the outer specimens inwards and from 1 to 4 m. In the longitudinal direction much higher values are found than in the radial or tangential direction, especially at 4 m. In the tangential direction the specific permeability is slightly higher than in the radial direction. Some groups, such as the inner zone at 1 m trunk height (inn-1) show large bars due to the large scatter of the individual values. Small structural differences, like the composition of the intercellular space, can lead to large differences in the permeability. In addition, small differences in the flow rate quickly lead to larger deviations since only small flow rates are measured due to the low pressure. Using higher pressures increases the risk of bypasses between the specimen and the shrink hose, therefore higher pressures were not used. The increase in permeability inwards and upwards is attributed to the higher porosity in the inter and inner trunk zone and at the higher trunk height of 4 m. Water flow in oil palm wood can be through the pit openings of the parenchyma cells, the intercellular spaces, and the vascular bundles. Since the parenchyma cells and vascular bundles are more densely packed in the outer part, this region has fewer intercellular spaces and therefore lower permeability. Longitudinal permeability always exceeds radial and tangential permeability because the main flow paths in wood are in the longitudinal direction (Siau Citation1984). In oil palm wood the vascular bundles are mainly oriented longitudinally, although there are more vascular bundles in the outer part, the inner part shows a higher permeability due to the bigger vessel diameter of the vascular bundles from the inner part (Choo et al. Citation2013). In dicotyledonous wood, radial permeability is found to be greater than tangential permeability (Hansmann et al. Citation2002), which is influenced by the occurrence and conductivity of wood rays (Siau Citation1984). Oil palm wood does not possess wood rays or other horizontal pathways, except for locally occurring diagonally oriented vascular bundles called “leaf traces” (Zimmermann and Tomlinson Citation1972). Therefore, it can be assumed that the main transverse flow is through the parenchyma tissue. Differences in the radial and tangential directions can be linked to the orientation and arrangement of the vascular bundles, which also influences the density gradient in the radial direction and therefore explains the lower permeability values in this direction. Additionally, movement through intercellular spaces and cracks may also have an influence on the transverse flow (Hansmann et al. Citation2002).
Figure 5. Specific permeability of the outer, inter and inner trunk zone in (a) radial, (b) tangential and (c) longitudinal direction, at 1 and 4 m trunk height, number behind # indicates the number of specimens, nine values were obtained from each specimen (three pressure gradients · three specimen lengths).
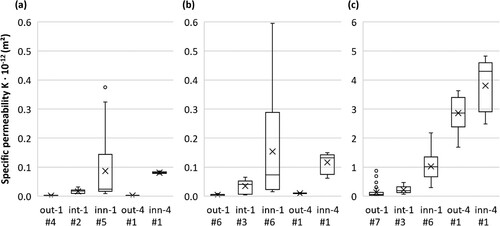
The Kruskal Wallis test (H(14) = 326.996; p < 0.001) revealed that there are significant differences between the median values of the specific permeability of the 15 specimen groups. shows the median of each group, the median absolute deviation (MAD) and the results of the post hoc stepwise stepdown comparison following Campbell and Skillings with different letters behind the median indicating significant differences. Values of inter area at 4 m are estimated as mean values between outer and inner values.
Table 5. Permeability values of the specific trunk zones in the analyzed directions.
Rittiphet et al. (Citation2022) found that freezing oil palm wood below −10°C generates microcracks that increase its permeability. However, the permeability values in longitudinal direction obtained in this study are lower, or comparable (at 4 m) to the values obtained by Choo et al. (Citation2013), who studied the longitudinal water permeability of 50 mm long specimens without prior freezing. It is therefore assumed that the influence of pre-freezing in this study is rather small. Choo et al. (Citation2013) recorded average mean values for the outer zone of 4.3 · 10−12 m2, inter zone of 7.9 · 10−12 m2 and inner zone of 5.6 · 10−12 m2. The material used came from 30-year-old oil palm trees with an average length of 14 m. Exact specimen preparation details regarding trunk height are not provided, but the values at 4 m trunk height from this study for the outer zone of 2.9 · 10−12 m2 and inner zone of 4.3 · 10−12 m2 fall in an similar range as those of Choo et al. (Citation2013). The highest permeability is measured in the inter zone, which is surprising given the horizontal density gradient. In contrast to the results of Choo et al. (Citation2013), there was a clear tendency in the analyzed specimens at 1 m trunk height for the inter zone values to fall between the values of the outer and inner zone. The specific permeability ratios for the three orthogonal directions and three trunk zones are shown in . At the outer zone at 4 m there is an exceptionally higher longitudinal permeability with a ratio from 1:5:1492 (R:T:L). In the inner zone the ratio is only 1:2:53, although the longitudinal permeability in the inner zone is 1.5 times higher than in the outer zone. This is caused by the low radial and tangential permeability in the outer zone that remains low at 4 m, while the longitudinal permeability increases from 1 to 4 m in all three trunk zones. The permeability ratios give an indication of the preferred direction in which the water is forced out of the board during compression. This is in particularly important for the dewatering of longer boards where the water has to travel a longer distance to the boards crosscut edges.
Table 6. Ratios for the specific permeability of the three orthogonal directions and the three trunk zones.
4.2. Mechanical dewatering
The two-tailed t-tests revealed no significant (p < 0.05) differences between the two processes I and II in terms of moisture content mc, extracted water ew, and share of transverse ewtrans and therefore mean values from the two respective boards can be taken. The moisture content reduction is shown in . Each column shows the average of the two respective boards of process I and process II. Since some freeze drying became visible at the boards’ surfaces, the theoretical maximum mc of the boards is calculated to show the maximum possible moisture loss due to freeze drying, assuming that the boards were close to moisture saturation in green condition. The graph shows the theoretical maximum mc on top of each column as horizontal lines, the mc reduction as diagonal lines and the final mc as light gray (40% cr) or dark gray (60% cr) solid columns. Error bars on top of each stacked column show the upper and lower values from which the average value of the two boards was calculated. The range of the error bars is comparable small, since the two boards used to calculate the average values were located one behind the other in the trunk. The initial mc (top of the mc reduction) increases from outer zone inwards in all four trunk parts. This increase is also visible at the final mc, but with smaller differences. The values of the outer and inter boards are closer together compared to the inner boards. Due to the higher initial mc, the differences in moisture content reduction between the 40% and 60% compressed boards are particularly visible in the inner boards. The inner boards show the greatest difference to the theoretically possible mc and show the highest mc reduction, but it is important to consider how the mc is calculated. Since the mc value is calculated by relating the mass of water contained to the dry mass of the board, and the inner boards have a comparably low dry mass, the removal of the same amount of water would have a greater effect on the mc reduction of an inner board than on an outer or inter board. This becomes clear when the extracted water (ew) as portion of the total included free water and in absolute amounts is analyzed as shown in .
Figure 6. Reduction of moisture content by the compression process.
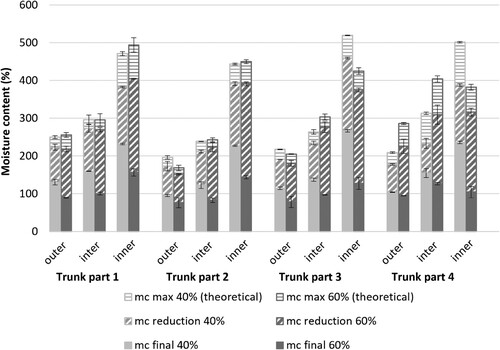
Figure 7. Extracted water in % of the total included free water (left axis) and in l/m3 (right axis).
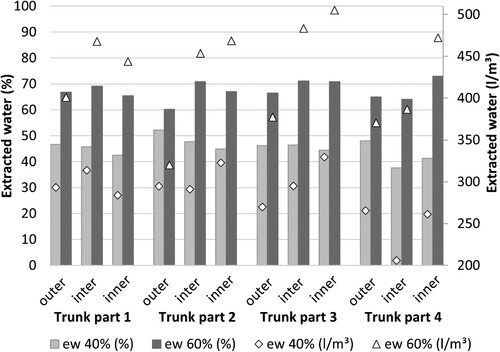
Despite the greater mc reduction in the inner boards (cf. ), the ew, as portion of the total included free water, is similar in the different trunk zones and trunk parts. It varies between 38–52% and 60–73% for the boards with 40% and 60% cr. The absolute amount of ew varies between 206–329 and 320–505 l/m3 for the boards with 40% and 60% cr respectively, with the highest values in the boards from the inner zone. Even though more water tends to be squeezed out of the inner boards, a considerable amount of water is equally squeezed out of the outer and inter boards. This shows that mechanical dewatering is also useful for outer and inter boards, and that overall large amounts of press sap can be recovered from all trunk areas, which could be an additional benefit of the process in terms of industrial use of the sugars contained. The amount of removed water also shows the process’ potential for reducing drying energy compared to kiln drying, which requires all water to be heated for evaporation.
4.3. Transverse dewatering
The boards used in this study were 700 mm long due to the size of the available laboratory press. When the process is applied to 2 m and longer boards, transverse dewatering becomes more important. The share of transverse dewatering is shown in . The highest transverse dewatering occurs in the inner boards (40% and 60% cr) with mean values of about 60% and the lowest transverse dewatering occurs in the inter boards with 40% cr with a mean value of 23%. Although the boards are comparatively short, there is already a considerable amount of transverse dewatering.
Figure 8. Share of transverse extracted water ew depending on trunk height (cf. ).
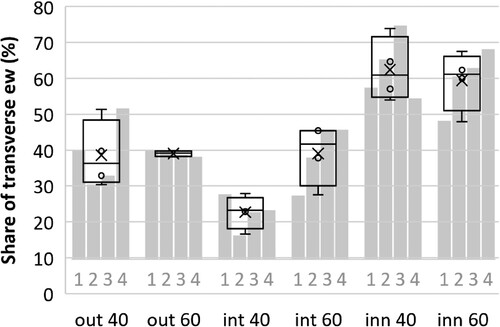
Multiple regression analysis is used to test the influence of transverse/longitudinal permeability ratio, board dimensions (length/width ratio), compression ratio and trunk height on the transverse water extraction for statistical significance (p = 0.05). Compression ratio (p = 0.80) and trunk height (p = 0.18) are not included because they do not improve the multiple regression equation. Since the trunk zone (outer, inter, inner) is already integrated in the permeability ratios, it is not included in the equation to avoid multicollinearity. Therefore, only the transverse/longitudinal permeability ratios and length width ratios are included into the equation. The multiple regression results in the functional equation ewtrans = 3197×1 + 8.6×2 – 0.5 with x1 = transverse to longitudinal permeability ratio and x2 = length to width ratio. The length-to-width ratio varies between the boards due to the different board widths, as can be seen in (b). The transverse/longitudinal permeability ratios are calculated according to the edge orientation of the boards. Since the permeability is lowest at the trunk periphery, it can be assumed that the permeability in the transverse direction is determined by the permeability present at the edges of the individual boards (cf. b). The outer boards edges are mainly oriented tangentially at the outer trunk zone (Tout), the inter boards edges are mixed tangentially and radially at the outer trunk zone (Tout + Rout)/2 and the inner boards are mainly radially at the inter trunk zone (Rint). The longitudinal permeability of the boards is determined by the longitudinal permeability at the respective trunk zone (Lout, Lint and Linn). shows how the transverse/longitudinal permeability ratios are calculated, and contains the calculated ratios for the boards. Lower ratios are calculated for 1 m trunk height compared to 4 m trunk height, where the lowest ratio is in the inner boards and the highest ratio is in the inter boards. The comparatively low pressures between 0.01 and 0.03 MPa could affect the absolute values and thus the calculated ratios. If the ratios are evaluated in terms of transversal/longitudinal dewatering it could be assumed that water is unlikely to be removed over the transverse edges, which is contradicted by the test results. During compression, permeability decreases and therefore the permeability in the green uncompressed state only gives an orientation and not exact values for the conditions present during compression.
Table 7. Determination of the transverse/longitudinal permeability ratios according to the main edge orientation.
Table 8. Ratios of the transverse to longitudinal permeability of the outer, inter and inner boards.
The limited number of test specimens influences the multiple regression calculation, any weaker influences are therefore not statistically recorded. For an adjustment and validation of the multiple regression equation, tests would have to be carried out with more test specimens. In addition, more permeability measurements should be made, especially at the higher trunk parts and how the permeability behaves under compression should be analyzed. However, the data suggest that the transverse/longitudinal permeability ratios together with the length/width ratios have a decisive influence on transverse dewatering.
4.4. Pressure development
shows the pressure development in the boards as average curves of the four trunk parts. During the compression process, the boards from the same trunk zone (outer/ inter/ inner) showed similar tendencies in all trunk heights. Therefore, the average pressure curves for all trunk heights are shown for each trunk zone. The values of the 30-second measuring intervals of the crosscut dewatering are connected with a line and are shown as light yellow and blue areas in the background. For better comparison between the graphs, the dewatering values are adjusted to the y-axis, so that the maximum value is always 8%. Process I is shown as yellow curves and process II as blue curves. In process II, due to the reduced closing speed after 2/3 of compression the water flow is slower and for a longer period. At the 40% compression ratio ((a, c and e)), the hydrostatic pressure p(h) curves follow the course of the specific pressure p(sp) curve on a substantial lower level. The curves of pressure sensors 2 and 3 that were located 200 and 350 mm from the crosscut end, respectively differ only slightly, with pressure sensor 3 showing slightly higher values. Pressure sensor 1, which was in 50 mm from the crosscut end, shows considerably lower values. This development is also reflected at the compression ratio of 60% ((b, d, and f)). This demonstrates, that at 50 mm from the crosscut end, the water outflow leads to a considerably lower hydrostatic pressure, but the hydrostatic pressure does not decrease linearly toward the center of the board. At 200 mm from the crosscut end there is already a high hydrostatic pressure, which indicates reduced permeability.
Figure 9. Pressure development during the compression processes I and II and dewatering over the crosscut ends of the different boards and compression ratios: (a) outer 40%, (b) outer 60%), (c) inter 40%, (d) inter 60%, (e) inner 40%, and (f) inner 60%. Explanation to the l (local) and g (global) maxima of the specific pressure p(sp), l / g and hydrostatic pressure p(h), l / g in the text. For better comparison the scale of the dewatering is the same in all graphs, with a maximum of the axis of 8%, the value in front of the unit indicates the respective multiplier.
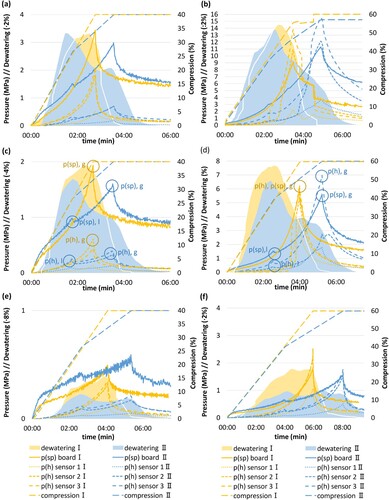
The specific pressures p(sp) of process II show a local (l) maximum p(sp), l at the point where the compression speed is reduced (highlighted with circles in (c)). The same local maximum is observed at the hydrostatic pressure p(h), l followed by a short downfall of the pressure which shows that the slower compression speed immediately leads to a lower hydrostatic pressure p(h). The local (l) and global (g) maxima of the hydrostatic pressure p(h) are by a multiple smaller than the maxima of the specific pressure p(sp). At the 60% compression ratio ((d)) the local maximum of the hydrostatic pressure p(h), l still is below the maximum of the specific pressure p(sp), l while the global maximum of the hydrostatic pressure p(h), g is equal to or even higher than the global maximum of the specific pressure p(sp), g. This shows that the reduction of the hydrostatic pressure p(h) through the slower compression speed is reversed when the pressure exceeds a certain level. Since the hydrostatic pressure p(h) is generated by the uniaxial directed compression force but acts uniformly in all directions, a higher hydrostatic pressure p(h) than the (average) specific pressure p(sp) is only possible if higher specific pressures p(sp) are generated locally. This indicates that the specific pressure is not evenly distributed in the board and that the remaining enclosed water in the middle of the board leads to higher local pressures.
The two mechanisms for densification and dewatering represent two opposing developments. The driving force of the dewatering is the pressure gradient between the inside and outside of the board. But when the cells are compressed to such an extent that almost all cell cavities are closed and only a small amount of free water is still enclosed in the wood, a further increase in pressure does not lead to any further dewatering. This is shown especially in the outer and inter boards, since at 60% compression about 2/3 of the free water (cf. ) has already been squeezed out. Any additional water removal will be laborious, as it is impossible to reduce all the free water.
The board length used in this study is twice the specimen length used by Rittiphet et al. (Citation2021), who examine that liquid water only slightly affects the resistance of wood during compression, but assume that commercial full-length boards could suffer from high hydrostatic pressures during compression. In this study, high pressures were already examined at quite a short distance (200 mm) from the crosscut end. Therefore, it can be assumed, that in full-length boards the hydrostatic pressure in the middle of the board exceeds the specific pressure at an earlier stage, and that the ratio of transverse to longitudinal dewatering depends on board length and, therefore, a comparatively small amount of water is removed over the crosscut ends. A reduction of the compression speed could reduce the hydrostatic pressure p(h), but only as long as enough pathways for the water are open. Since the hydrostatic pressure decreases over time if enough water flows out, a pressure-depending compression process could balance the optimum compression speed and reduce the maximum hydrostatic pressures p(h).
The maximum values of the specific pressure p(sp) and hydrostatic pressure p(h) are shown in for the outer, inter and inner boards. At the boards with 40% cr (thin lines), the hydrostatic pressure p(h) is lower than the specific pressure p(sp) in all boards and at all three distances to the crosscut end. At the boards with 60% cr (thick lines) the hydrostatic pressure p(h) only is lower at the distance of 50 mm to the crosscut end in all the boards. At a distance of 350 mm from the crosscut end the hydrostatic pressure p(h) exceeds the specific pressure in all boards. At 200 mm the hydrostatic pressure is lower but closer to the hydrostatic pressure p(h) at 350 mm than to the hydrostatic pressure p(h) at 50 mm besides the inter boards of process II (Figure 10(b)), which show an irregular curve progression compared to the other curves due to the comparatively low value of the hydrostatic pressure at 200 mm from the crosscut end. The irregular curve progression of the hydrostatic pressure p(h) at 200 mm can be seen also in (d) (sensor 2). Most likely a leakage between the sensor and the wood led to lower measured values as actually present without a drilled-in sensor. To create a tight connection between the wood and the stainless-steel pipe, the drill hole was 0.5 mm smaller than the diameter of the stainless-steel pipe. However, leakages can occasionally occur, but since the values for the hydrostatic pressures are comparatively high, it can be assumed, that the connection was mostly tight, and the connection is further sealed by the densification of the wood. If the stainless-steel pipe hinders the water flow, this could also lead to higher hydrostatic pressures than would be present without the sensor. However, since a remarkable amount of water escapes over the long edges, a substantial influence of the stainless-steel pipe on the measurement is considered unlikely. The influence of the two processes on hydrostatic pressure was tested with a paired one-tailed t-test which only showed significant difference between two of the tested groups. The outer boards with 40% cr of process II showed significantly lower values than the corresponding boards of process I at 200 mm (p = 0.042) and 350 mm (p = 0.047) distance from the crosscut end. Regarding the number of specimens, the statistical analysis can only be interpreted as a tendency that with slower compression speed the maximum pressures can be reduced at lower cr, but 2.5 mm/min still is too fast to reduce the hydrostatic pressure p(h) at a 60% cr.
Figure 10. Hydrostatic pressure p(h) distribution at the three measuring points in the middle of the boards at the time of maximum specific pressure p(sp) in the (a) outer, (b) inter, and (c) inner boards.

The maximum values for the specific pressure p(sp) and hydrostatic pressure p(h) of sensor 3 (350 mm) are shown in as boxplot diagrams with the distinct values of the trunk parts as light gray columns in the back. It is assumed that less pressure is required with increasing trunk height because the age of the cells and thus the strength and stiffness decrease with the trunk height. However, this assumed pattern is only recognizable to a limited extent, except that trunk part two mostly shows the highest value and trunk part four the lowest. In general, the differences across the trunk diameter are more clearly pronounced than the differences along the trunk height. The higher cr of 60% also leads to a higher variation between the trunk parts. The mean maximum specific pressure p(sp) varies between the outer, inter and inner boards between 3.2, 1.8 and 0.5 MPa for the 40% cr and between 10.2, 5.8 and 1.6 MPa for the 60% cr.
Figure 11. Maximum specific p(sp) and hydrostatic p(h) pressure of sensor 3 (350 mm from crosscut end) of the 40% (a) and 60% (b) compressed boards.
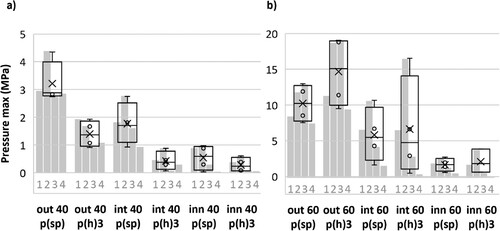
The compressive strength of small oil palm specimens perpendicular to the vascular bundles σ⊥ varies across the trunk diameter between the inner zone and outer zone between 0.4 and 1.2 MPa for dry wood (Srivaro et al. Citation2018). In green condition, the compressive strength and modulus of compression are lower than in dry state. The maximum specific pressure during 40% compression is only slightly above these values and shows a sharp decrease in compressive strength from the outer boards inward, as is known for the elastomechanical properties of oil palm wood. As compression increases, the density increases and so does the resistance to further compression and consequently the required pressure, as can be seen from the much higher maximum pressure values at 60% cr.
Since water is an incompressible fluid, this effect is strongly influenced by the occurrence of liquid water that is enclosed in the middle of the board. This is observable at the 60% cr where the hydrostatic pressure p(h) exceeds the specific pressure p(sp). Choowang and Hiziroglu (Citation2015) reported that dried (conditioned to 20°C/65% RH) oil palm specimens of 350 mm length were thermally compressed with a 60% cr with a pressure of 2 MPa at temperatures between 140°C and 220°C. The high temperatures soften the wood and thus less pressure is required, but also the absence of liquid water results in lower pressures compared to this study.
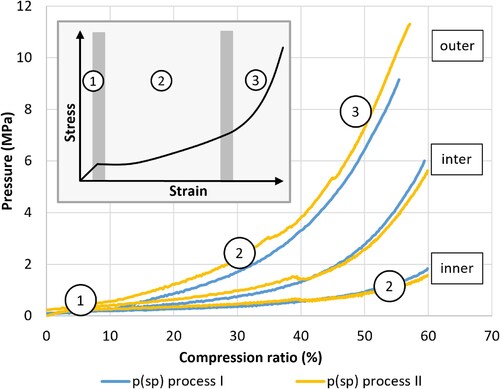
shows the relationship between the specific pressure p(sp) and the continuous compression ratio of the stronger compressed boards (60% cr). The typical stress–strain relationship of wood during compression perpendicular to the fiber is shown in and can be distinguished into the three major phases: (1) Linear elastic, (2) Cellular collapse and (3) Densification (Ashby Citation1983). Under lesser strains, wood shows a linear elastic behavior because the cell walls bend elastically. When the stress increases, the cell walls start to collapse either by elastic buckling or plastic fracture and even a small amount of additional stress leads to an increasing collapsing of the cells. Once most of the cells have collapsed, the densification phase begins, where the cell walls crush together and the continuing compression leads to rapidly growing stress (Ashby Citation1983, Wolcott Citation1989). The curves of the compressed oil palm boards show a similar course like the typical stress–strain relationship of wood under compressive load. Linear elastic behavior occurs approximately until 10% compression and shows a comparatively low slope, which could be due to the wet and soft condition of the boards. The linear elastic region transitions smoothly into the cellular collapse phase that passes over after approximately 40% into the densification phase where the slope rises more exponentially. The compression in this phase is by some means hindered through the remaining enclosed water, leading to an additional increase in stress. The outer boards have the highest slope, which corresponds to the higher density and, therefore, the lower void volume of the outer zone. The slope of the inter boards are in between the outer and inner boards, with the inner boards having the lowest slope due to their high proportion of thin-walled high-porous parenchyma tissue (Lim and Khoo Citation1986). They appear to be still in phase 2 at the end of compression, indicating that the inner boards could be further compressed, while the outer and inter boards are already close to the maximum possible thickness reduction due to their denser structure. Although the reduction of the specific pressure p(sp) is visible at process II, the curves of the two processes show a similar course.
Figure 12. Relationship between the specific pressure p(sp) and the continuous compression ratio of the stronger compressed boards (60% cr). The diagram in the figure shows a typical stress–strain curve of a cellular material during compression with the three phases: 1. Linear elastic, 2. Cellular collapse and 3. Densification; cf. Ashby (Citation1983).
4.5. Recovery behavior and quality of the boards
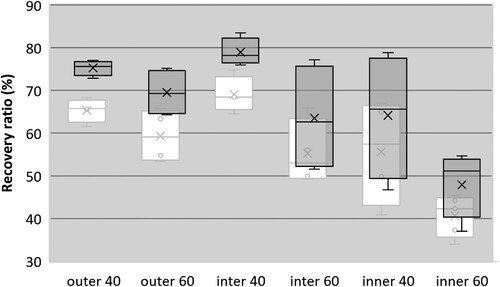
During compression, compressive stresses are stored in the microfibrils and in the cell wall matrix (Norimoto et al. Citation1993). When the load is removed, the stresses lead to spontaneous and creep-dependent recovery due to the viscoelastic behavior of wood. Therefore, if permanent densification is desired, it is essential that the densification is carried out under conditions in which the wood is softened by heat and moisture and hence can be more permanently formed into new shapes (Navi and Sandberg Citation2012, Sandberg et al. Citation2021). Temperatures above the glass transition of lignin (>72°C, depending on the mc (Salmén Citation1982)) allow the relaxation of internal stresses and the formation of cross links between the microfibrils (Norimoto et al. Citation1993). Therefore, press-drying at temperatures above the glass transition temperature of lignin is necessary to fix the densification more permanently. Koelli and Fruehwald-Koenig (Citation2024) showed that the densification of oil palm wood can increase the elastomechanical properties to higher levels than found in natural oil palm wood. If the objective of the compression is only to reduce the high initial moisture content before kiln-drying, the recovery of compression could be advantageous. Rittiphet et al. (Citation2021) showed that pre-mechanical compression before kiln-drying can be used to facilitate the drying process and maintain the low-density character of oil palm wood. shows the recovery ratio rr of the outer, inter and inner boards with cr of 40% and 60%. The immediate springback after compression is shown as white boxes and the recovery after 24 h is shown as gray boxes. The boards with 60% cr have comparatively lower recovery than the boards with 40% cr which is also evident in the t-test for all pairings (outer: p = 0.03, inter p = 0.03, inner p = 0.04). Greater compression leads to slightly lower recovery, because of the higher stresses and deformations in the densification phase (cf. ). The lowest recovery is experienced by the inner boards with a 60% cr which is approximately 50% after 24 h. This can be explained by the lower initial density of the inner boards, which have a higher share of thin-walled parenchyma tissue than the outer and inter boards and are therefore more easily permanently deformed. Most of the recovery occurs immediately after compression, after 24 h approximately another 10% is additionally recovered. High recovery ratios of up to 80% are possible and may even increase after a longer period and after dry-wet cycles.
Figure 13. Recovery ratio of the boards immediately after compression (white boxes) and after 24 h (gray boxes).
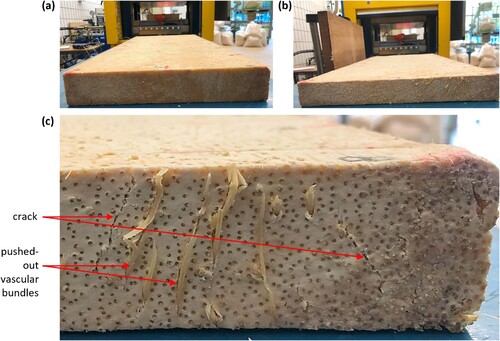
The damages, like twisted shape of boards or rough surface with loose vascular bundles reported by Fruehwald-Koenig et al. (Citation2023), who used a roller press for mechanical dewatering did not occur in the flat compression process of this study. However, thin cracks and slightly pushed out vascular bundles were observed at the crosscut surfaces of the boards ().
Figure 14. Crosscut surface of an inner board: (a) before compression, (b) after compression with 60% cr and (c) close-up view showing thin cracks and pushed-out vascular bundles.
5. Conclusions
This study examines the dewatering behavior of wet oil palm boards during compression and analyzes the influencing factors such as permeability, compression ratio (40% and 60%) and compression speed (2.5 and 5 mm/min). The study’s aim is to reduce the high initial moisture content of oil plam wood through mechanical compression. Like many material properties of oil palm wood, permeability varies within the trunk, increasing from the outer zone inward and from 1 to 4 m trunk height. In addition, permeability is orthogonally directed. While only slightly higher values occur in the tangential direction than in the radial direction, the values in the longitudinal direction are substantially higher than in the other two directions in all three trunk zones investigated.
The transverse dewatering of the boards (700 mm in length) used in this study is about 23–40% for the outer and inter boards, and about 60% for the inner boards. This shows that the inner boards are more easily dewatered by the long edges, while the inter and outer boards are more likely to be dewatered by the crosscut edges. Multiple regression analysis shows that the share of water removed in the transverse direction is influenced by the longitudinal to transverse permeability ratio and the length-to-width ratio.
The pressure measurements show that most of the water is removed at comparatively low hydrostatic pressures. The high hydrostatic pressures of the outer and inter boards indicate that no further dewatering is to be expected at higher pressures; a compression ratio of 60% is likely to be close to the compression that can be achieved with unperforated press plates for outer boards. Since much lower pressure develop in the inner boards, further dewatering can be expected at higher compression ratios even though 60–73% of the free water has already been removed.
The high recovery of up to 80% after 24 h shows that the thickness reduction is largely reversible. This can either be beneficial if light weight is preferred or it indicates that heat stabilization must be applied if recovery is unwanted and densification is targeted.
This study shows that wet, nearly water-saturated oil palm boards of 700 mm in length can be largely mechanically dewatered using a flat press with unperforated press plates. This shows that mechanical dewatering is a promising approach to facilitate drying and simultaneously extract sugar containing oil palm sap as a by-product.
Acknowledgements
The procurement of the oil palm material was supported by the Malaysian Timber Industry Board (MTIB) and the Fibre and Biocomposite Development Centre (FIDEC) represented by Dr. Loh Yueh Feng. Leitz GmbH & Co. KG provided the wood processing tools. The permeability measurements were supported by B.Eng. Jana Voecker, B.Eng. Karin Lueke and M.Sc. Rainer Kuschel from OWL University of Applied Sciences and Arts Lemgo. The flat compression tests were supported by Johannes Beruda from the Institute of Wood Science of the University of Hamburg and Dipl. -Ing. (FH) Hannes Koehm from the Thuenen Institute. Prof. Dr. Arno Fruehwald from the University of Hamburg and Prof. Katja Fruehwald-Koenig from the OWL University of Applied Sciences and Arts Lemgo advised the research and proofread the manuscript.
Disclosure statement
No potential conflict of interest was reported by the author(s).
Additional information
Funding
References
- Ashby, M.F., 1983. The mechanical properties of cellular solids. Metallurgical Transactions, 14, 1755–1769.
- Bakar, E.S., et al., 2006. Polygon sawing: an optimum sawing pattern for oil palm stems. Journal of Biological Sciences, 6, 744–749.
- Choo, A.C.Y., et al., 2013. Study on the longitudinal permeability of oil palm wood. Industrial & Engineering Chemistry Research, 52, 9405–9410. doi:10.1021/ie4009259.
- Choo, A.C.Y., et al., 2015. Pre-drying optimization of oil palm veneers by response surface methodology. European Journal of Wood and Wood Products, 73, 493–498. doi:10.1007/s00107-015-0893-1.
- Choowang, R. and Hiziroglu, S., 2015. Properties of thermally-compressed oil palm trunks (Elaeis guineensis). Journal of Tropical Forest Science, 27, 39–46.
- Corley, R.H.V. and Tinker, P., 2015. The oil palm. Hoboken, NJ: Wiley Blackwell. 639 p. doi: 10.1002/9781118953297.
- DIN 52182, 1976. Testing of wood; determination of density. Berlin: German Institute for Standardization. 3.
- Dirkes, R., Neubauer, P.R., and Rabenhorst, J., 2021. Pressed sap from oil palm (Elaeis guineensis) trunks: a revolutionary growth medium for the biotechnological industry? Biofuels, Bioproducts and Biorefining, 15, 931–944. doi:10.1002/bbb.2201.
- EN 13183-1, 2002. Moisture content of a piece of sawn timber – part 1: determination by oven dry method. Brussels: European Committee for Standardization CEN. 4.
- Fruehwald-Koenig, K., Koelli, N., and Fruehwald, A., 2023. Mechanical dewatering of wet oil palm lumber prior to press-drying. Springer Proceedings in Materials, 19, 26. doi:10.1007/978-981-19-6195-3_2.
- Fruehwald, A. and Fruehwald-Koenig, K., 2019. The use of oil palm trunks for wood products. Material Research Proceedings, 11, 69–80.
- Gan, K., Choo, K., and Lim, S., 2001. Basic density and moisture content distributions in 30-year-old oil palm (Elaeis guineensis) stems. Journal of Tropical Forest Products, 7, 184–191.
- Hansmann, C., et al., 2002. Permeability of wood – a review. Wood Research, 47, 1–16.
- Hawley, L.F., 1931. Wood-liquid relations. Technical Bulletin U.S. Dept. of Agriculture, 248, 1–35.
- Khozirah, S., Khoo, K.C., and Ali, A.R.M., 1991. Oil palm stem utilization – review of a research. Forest Research Institute Malaysia (FRIM). 120 p.
- Killmann, W. and Lim, S.C., 1985. Anatomy and properties of oil palm stem. In: Proceedings national symposium of oil palm by-products, Kuala Lumpur, Malaysia.
- Koelli, N., 2016. Density and moisture distribution in oil palm trunks from peninsular Malaysia. Thesis (BSc). University of Hamburg, 52 p.
- Koelli, N. and Fruehwald-Koenig, K., 2024. Elasto-mechanical properties of thermo-hygro-mechanical (THM) densified oil palm sawn timber. Wood Material Science & Engineering, 1–18. doi:10.1080/17480272.2024.2317977.
- Kollmann, F.F.P. and Côté, W.A.J., 1968. Principles of wood science and technology: I solid wood. Berlin: Springer. 592 p.
- Kosugi, A., et al., 2010. Ethanol and lactic acid production using sap squeezed from old oil palm trunks felled for replanting. Journal of Bioscience and Bioengineering, 110, 322–325. doi:10.1016/j.jbiosc.2010.03.001.
- Kurz, V., 2013. Drying of oil palm lumber – state of the art and potential for improvements. Thesis (MSc). University of Hamburg. 104 p.
- Lim, S. and Fujii, T., 1997. A note on the structure of oil palm trunk by scanning electron microscopy. Journal of Tropical Forest Products, 3, 105–109.
- Lim, S. and Khoo, K., 1986. Characteristics of oil palm trunk and its potential utilization. Malaysian Forester, 49, 3–22.
- Navi, P. and Sandberg, D., 2012. Thermo-hydro-mechanical processing of wood. Lausanne: EPFL Press. 360 p.
- Norimoto, M., et al., 1993. Permanent fixation of bending deformation in wood by heat. Bulletin of the Wood Research Institute Kyoto University, 79, 23–33.
- Parthasarathy, M.V. and Klotz, L.H., 1976. Palm “wood” I. Anatomical aspects. Wood Science and Technology, 10, 215–229.
- Rittiphet, C., et al., 2022. A simple method to eliminate drying collapse of liquid-filled porous palm wood. Drying Technology, 41, 89–106. doi:10.1080/07373937.2022.2086565.
- Rittiphet, C., Dumyang, K., and Matan, N., 2021. Effect of pre-mechanical compression on free water removal, drying collapses and associated internal voids of oil palm wood. European Journal of Wood and Wood Products, 79, 925–940. doi:10.1007/s00107-021-01674-6.
- Salmén, L., 1982. Temperature and water induced softening behaviour of wood fiber based materials. Thesis (PhD). Royal Institute of Technology (KTH). 150 p.
- Sandberg, D., et al., 2021. Wood modification technologies. Boca Raton: CRC Press. doi:10.1201/9781351028226.
- Siau, J.F., 1984. Transport processes in wood. Berlin: Springer. 245 p.
- Simpson, W.T., 1983. Drying wood: A review. Drying Technology, 2, 235–264.
- Skaar, C., 1988. Wood-water relations. Berlin: Springer. 283 p. doi:10.1007/978-3-642-73683-4.
- Srivaro, S., Matan, N., and Lam, F., 2018. Property gradients in oil palm trunk (Elaeis guineensis). Journal of Wood Science, 64, 709–719. doi:10.1007/s10086-018-1750-8.
- Sulaiman, O., et al., 2012. The effect of relative humidity on the physical and mechanical properties of oil palm trunk and rubberwood. Cellulose Chemistry and Technology, 46, 401–407.
- Tomlinson, P.B., 1990. The structural biology of palms. Oxford: Oxford University Press. 496 p.
- Voecker, J., 2021. Development of a experimental setup for measuring the water permeability of oil palm wood (Eleais guineensis JACQ.). Thesis (BEng). University of Applied Sciences and Arts Ostwestfalen-Lippe, 89 p. (In German).
- Wolcott, M.P., 1989. Modeling viscoelastic cellular materials for the pressing of wood composites. Thesis (PhD). Virginia Polytechnic Institute and State University. 182 p.
- Yamada, H., et al., 2010. Old oil palm trunk: a promising source of sugars for bioethanol production. Biomass and Bioenergy, 34, 1608–1613.
- Zimmermann, M.H. and Tomlinson, P.B., 1972. The vascular system of monocotyledonous stems. Botanical Gazette, 133, 141–155.