
ABSTRACT
The paper has two interconnected bodies. The first one deals with mineral resource indicators and their role in drawing 11 EU–Africa Strategic Corridors, in a broader context of Africa–EU partnership. The second strives to understand how such Strategic Corridors are also mineral corridors, i.e. development promotors that use mineral resources as a catalyser to create and strengthen value chains and territorial organisation, boosting economic and societal development at regional scale. The results can help understand how Strategic Corridors can improve access to the present and future mines, mitigating the risk of supply disruptions of critical raw materials for the EU.
1. Introduction
There are no widely accepted definitions of ‘corridors’, and the concept is used in different contexts by different players, often preceded by specific qualifiers, such as ‘economic’, ‘development’, ‘strategic’, ‘resource’, etc., depending on the sectors of interest and with given objectives in mind [Citation1]. Pottier dedicated extensive research to study the phenomenon of corridors, following their evolution from mere transport link to multi-purpose communication axis, which can facilitate the creation of agglomeration economies [Citation2].
In the case of ‘resource corridors', the concept has been frequently reported in the literature, often in combination with other qualifiers, such as 'growth' [Citation3] [Citation4]. Interpretations may vary and attempts have been made to give more comprehensive definitions, such as the one proposed by the World Bank and according to which a 'resource corridor' is 'a sequence of investments and actions to leverage a large extractive industry investment in infrastructure, goods and services, into viable economic development and diversification along a specific geographic area' [Citation5]. Other organisations and actors have adapted the same definition: in 2015, the World Wildlife Fund (WWF) and UKaid, together with the Adam Smith International (ASI), implemented the Integrated Resource Corridors Initiative (IRCI) and expanded 'viable economic development' into 'sustainable, inclusive economic development' [Citation6] [Citation7].
From an economic and social development perspective, ‘corridors’ are most often understood as efficient transport systems that facilitate trade, attract investment and generate economic activities along a specific territory. Besides transport infrastructures, corridors can support the deployment of digital and energy networks as well. In an evolutionary framing, these functions may also be seen as stages of the same development axis, evolving from a pure transport corridor to a logistics, trade, economic and, eventually, growth or development corridor [Citation8] [Citation9].
As the African continent is concerned, often the use of the ‘corridor’ term is derived from a restrictive view that, in practice, indicates road highways that links, for instance, country capitals or ports with hinterland and omits the aspects of multimodality, rural development, cities, logistics, digitalisation, etc. Planning and implementation challenges often hinder a full-fledged realisation of corridors [Citation7], which should include both 'hard' and 'soft' infrastructure [Citation10]. Unforeseen and occasionally adverse impacts that corridor development has on different population groups [Citation11] [Citation12] [Citation13] are often neglected, together with the development of local connectivity [Citation14].
Coming closer to EU–Africa inter-relations, large-scale investments in cross-border corridors have become a priority of governments, Regional Economic Communities (RECs) and the African Union (AU). These initiatives are, however, often sparse and not harmonised [Citation14].
The concept of 'EU–Africa Strategic Corridor', recently developed by the European Commission [Citation1], goes beyond the infrastructure elements and entails also the area of interest along them, i.e. the adjacent territory that is influenced by those infrastructures. From this perspective, EU–Africa Strategic Corridors are intended as a mean to support the strengthening and creation of value chains and territorial organisation, embracing both rural and urban areas. This is also the definition embraced in this paper.
In the context of the 2021–2027 EU programming exercise, the Global Gateway Africa–Europe Investment Package will support the creation of strategic, sustainable and secure transport corridors and support value chains, services and jobs that can benefit industries in both Africa and Europe [Citation15,Citation16]. Strategic Corridors are also meant to support territorial development (both rural and urban) through reliable networks and services, including the deployment of digital and energy-related infrastructure. In such a context, the Joint Research Centre (JRC) and the Directorate-General for International Partnerships (DG INTPA) of the European Commission have initiated in 2020 a project on ‘Strategic Corridors and Urban Systems in Africa’ (CUSA) [Citation1].
The development of Strategic Corridors is meant to facilitate mobility and trade within Africa, as well as between Africa and Europe. They underpin the organisation of the whole territory, functionally linking rural and urban areas through reliable networks and services that create jobs and support value chains that can benefit industries in both Africa and Europe.
As the present paper is concerned, objectives and novelty are multi-fold. The paper starts from a summary on how the EC has set an ad-hoc methodology to identify and characterise Strategic Corridors using a wide range of indicators (more than 140), based on large volumes of data from multiple sources. The work then emphasises the role of the mining sector and mineral resource deposits in the search for indicators and underlying data. Both mineral-related indicators that were prioritised in the selection of corridors and indicators that were discarded are discussed by highlighting pros and cons.
Out of 55 corridors initially identified through an iterative step-wise delineation approach, a restricted set of 11 corridors has been determined using a combination of machine-based approach and policy-prioritisation process: therefore, a second body of research strives to investigate on how selected corridors can be functional to the development of the mining sector and in turn beneficial to the regional economy at a broader sector scale. Mineral resources were, in fact, embodied in 1 out of the 32 prioritised indicators, so not necessarily the final Strategic Corridors are also mineral resource corridors such as those discussed in the recent scientific literature [Citation3].
As a final novel contribution, the paper interlinks the selected corridors with current and future critical (and non-critical) raw material projects, with special attention to battery materials, which in turn can be regarded as a supply risk mitigation strategy from the EU side [Citation17]. Critical and non-critical raw materials are in fact crucial to Europe’s economy, as they form a strong industrial base, producing a broad range of goods and applications used in everyday life and modern technologies. Reliable and unhindered access to raw materials, also through strategic international initiatives and partnerships, is a growing concern within the EU. To address this challenge, the European Commission strives to develop and keep up to date criticality and risk assessment metrics [Citation18] [Citation19].
2. Materials and methods
2.1. Identification, characterisation and ranking of EU–Africa Strategic Corridors
The Global Gateway Africa–Europe Investment Package [Citation16] supports the creation of Strategic Corridors that can benefit industries in both Africa and Europe. The European Commission (Directorate-General Joint Research Centre [DG-JRC] and Directorate-General for International Partnerships [DG-INTPA]) has recently completed a project on ‘Strategic Corridors and Urban Systems in Africa – Phase 1’ (CUSA) with the aim to support decision-making towards a limited number of Strategic Corridors in Africa [Citation1].
CUSA project was aimed at (1) facilitating intra-African and Africa–Europe trade and improving sustainable, efficient, safe and secure connectivity between the two continents, as well as (2) developing diversified value chains in Africa that can benefit both African and European industries.
At the core of CUSA, a quantitative methodology has been developed, made of three main steps: (1) delineation (or identification), (2) characterisation and (3) optimisation of corridors, followed by a last qualitative step ().
Figure 1. Overview of the methodology applied in the CUSA project – Phase 1 [Citation1].
![Figure 1. Overview of the methodology applied in the CUSA project – Phase 1 [Citation1].](/cms/asset/1f886129-b3fa-4c24-a910-0b448f2224cc/nsme_a_2124786_f0001_oc.jpg)
The first phase entailed the delineation of the actual corridors of potential interest, focusing on main transport connections (road, railways and waterways) and the area of interest along them. Once the corridors had been identified, they were characterised by means of quantitative indicators that covered several topics and that could describe the performance of each corridor regarding, for instance, economy and investments, or connectivity and logistics. During the phase of optimisation, the corridors were compared and ranked according to the priorities set by four different scenarios, all aligned with Africa–EU policy strategies and each with a different focus:
Strengthening Europe-Africa connectivity;
Sustainable growth and jobs;
Green deal;
Human development, peace and security.
The evaluation had to address:
Economy and investments;
Connectivity and logistics;
Biodiversity and sustainability;
Human development; and
Cities and security.
In order to cover such a wide range of topics, an extensive research was carried out to identify the best data sources, in terms of reliability, comprehensiveness, completeness, geographical coverage, geographical detail and homogeneous quality [Citation1].
Out of 141 indicators, 32 were finally selected and used as input to the multicriteria analysis. Its scope was to order all 55 corridors according to their overall performance over the selected indicators. This exercise was repeated four times, once per scenario, on the basis of four different sets of utility functions and weights. Each utility (or ‘objective’) function indicates whether the objective, measured by the associated indicator, is to minimise or maximise it, i.e. lower or higher values of the indicator are more desirable. Each utility function was linked to a weight that translates the relative importance of the associated criterion with respect to all other criteria. The human development and peace and security, green deal and sustainable growth and jobs scenarios received machine-based weights, whereas for the Strengthening Europe-Africa connectivity scenario user-defined weights were applied. The use of machine-based weights guaranteed the transparency of the process while keeping it relatively simple. In the case of the EU scenario, the adoption of user-based weights allowed to directly control the importance of a few key criteria and indicators, also discussed with the involved stakeholders.
Eventually, the utility functions and weights were employed to produce the four rankings. Two ranking methods were applied – SAW (Simple Additive Weighting) and TOPSIS (Technique for Order Preference by Similarity to Ideal Solution). These are among the most widely used multi-attribute decision techniques: the literature generally considers TOPSIS method more accurate than SAW method in calculating distances from the extreme (best or worst) options (Chen, [Citation20] 2012). Results from both TOPSIS and SAW were then compared in order to ensure their reliability, guaranteed if both methods had generated similar outcomes. In that case, the final rankings were derived from the results generated by TOPSIS. Final scores range from 0 (worst performance) to 1 (best performance): a higher rank value indicates that, overall, the specific corridor better fits the criteria represented by the objective function.
This method allows to identify relative differences in the performance of corridors across the four scenarios, as each corridor may score similarly or substantially different across them.
The most promising corridors were identified based on the Kendall coefficient [Citation21], which is a similarity measure and led to the selection of the top 20 positions across the four scenarios.
The resulting list is composed by 31 Strategic Corridors, with the following geographical distribution:
5 corridors are located in the Northern region (Tangier-Tunis, Dakar-Tangier, Tunis-Cairo, Cairo-Khartoum and Algiers-Kano-Niamey);
9 corridors run across predominantly the West region (Abidjan-Lagos, Abidjan-Ouagadougou, Lagos-Niamey-Kano-Port Harcourt, Dakar-Abidjan, Bamako-N’Djamena, Cotonou-Niamey, Dakar-Banjul-Bamako, Lomé-Ouagadougou and Accra-Ouagadougou);
3 corridors are mainly located in the Central region (Lagos-Kinshasa, Douala-N’Djamena and Douala-Kampala);
6 corridors run mainly across the East region (Kismayo-Addis Ababa, Lamu-Mtwara, Mombasa-Dar es Salaam-Addis Ababa, Asmara-Addis Ababa, Beira-Lubumbashi and Mombasa-Kisangani); and
8 corridors are predominantly located in the Southern region (Maputo-Gaborone, Durban-Lusaka, Luderitz-Johannesburg-Durban, Johannesburg-Mbeya, Luanda-Mbuji Mayi, Walvis Bay-Kinshasa, Cape Town-Windhoek and Walvis Bay-Gaborone).
The above corridors were eventually provided in input to the decision-making process in charge of identifying a preliminary set of Strategic Corridors as best candidates to be supported under the programming framework of the NDICI-Global Europe [Citation22]. Qualitative and policy-related considerations contributed to the shortlisting of 11 corridors: amongst other factors, the process took into account the distinction between corridors mainly located in Northern Africa and sub-Saharan Africa; the geographical balance amongst African regions; and the possibility to leverage long-standing work on infrastructures, developed by partnerships between European and African public institutions and private sector. The short-listed corridors were formalised in the conclusions of the sixth European Union–African Union Summit and were presented to public and private investors, e.g. at the 7th EU–Africa Business Forum (https://www.euafrica-businessforum.com/en).
2.2. Availability, selection and weighting of mineral-related indicators
All the indicators have been selected to be highly relevant to the specific criteria and, at the same time, applicable to all corridors.
The proposed indicators with a direct connection to mineral resources were originally seven (), six of which from S&P Global Market Intelligence [Citation23] and one from the International Council on Mining and Metals [Citation24].
Table 1. Mineral resource-related indicators initially identified in CUSA project (source [Citation1].
Several more indicators that are indirectly correlated to the mining sectors were identified, among which:
Number of ports
Railways
Main roads
Electricity from renewable sources
Protected areas
Conflict areas
The seven mineral resource indicators were found to be similar and highly correlated to each other when screened against the adopted criteria:
Avoid collinearity as much as possible, inspecting correlation plots between pairs of indicators and computing the Generalised Variance Inflation Factor (GVIF);
Avoid indicators characterised by the presence of outliers and the rest of the values distributed with very low variability;
Between two similar indicators, i.e. indicators measuring the same phenomenon, the preference was given to the one with the simpler definition and easier explanation for non-experts;
Between two highly correlated indicators, but measuring different phenomena, the preference is given to the one with the higher policy relevance;
Between two indicators measuring the same phenomenon, but the first one referring to historical data, while the second one referring to projections, the preference was given to the projections.
As a consequence, only one indicator based on S&P Global data was retained. Such an indicator, named as 'Mineral resources', is expressed as number of mining properties, i.e. all mining sites, with the exception of those that are currently closed and classified inactive. Moreover, MCI was found to be only partially useful, as it is referred to the country as a whole and it does not allow to distinguish different regions or territories of the same country.
For what concerns indicators directly (mineral resources) and indirectly connected to mineral resources (port distinct connections, average drive time to the nearest sea port, protected areas, renewable resources, high- and medium-voltage infrastructure and conflict-prone areas), different weighting sets have been adopted.
The user-based weights have been derived along with expert opinions, focusing on selected indicators with particular relevance to the EU–Africa scenario:
Highest weights: Trade, investments (FDI, EC-financed projects and China investments), air traffic (passengers) and container sea port connections;
Medium weights: Presence of mining sites and conflict-prone areas;
Lowest weights: Presence of renewable resources, occurrence of floods and educational attainment of women.
2.3. Understanding how Strategic Corridors can support the mineral sector
As a follow-up, a range of possibility for further development emerged, including for identifying specific areas of interventions for each of the selected Strategic Corridors. These might strengthen the corridor efficiency in its multiple dimensions, including, but not limited to, transport performance (costs, time and reliability), socio-economic aspects, logistics and trade development and environmental impact.
In the context of this paper, the initial step focused on spatial analyses related to the present and future (prospective) mine projects. Mining properties were extracted from S&P Global data and assessed whether they fall inside or outside the corridors. The analysis grouped mining properties in two main categories, one representative for active mines and one for exploration activities, the latter considered as an outlook to potential mines of the future.
According to S&P Global data, 4091 mining properties can be georeferenced across Africa: the majority of them are described in terms of development stage and status: few of them lack a designation in terms of either stage (118) or status (131), but all of them are described by at least one of the two attributes.
The current analysis concentrates on mining properties of any stage and status combined, excluding only those that are classified as 'closed' and 'inactive'. For the purpose of this exercise, the remaining properties, 3903 in the whole continent, are further classified into two categories: consolidated and perspective. The first category includes all mining properties that are associated with a 'Production' stage, i.e. Operating, Satellite, Expansion, Limited or Residual, irrespective of their associated status. All other stages, from 'Early-Stage' to 'Preproduction', are included under the second category. Also, mining properties that are reported as 'closed', but not inactive, are retained in this second category.
A certain number of mining properties (27) are of type 'Ocean': they are included in the statistics at Country level, and since they cannot be allocated to any specific Strategic Corridor, they are excluded from the analysis at corridor level.
The number of mining properties that are located in at least one corridor is 1601: their distribution per corridor is reported in .
Table 2. Distribution of mining properties across the Strategic Corridors.
For the current elaborations, the considered critical and non-critical raw materials derive from the list of critical raw materials for the EU [Citation17]. The analysis also considered the following four battery materials: cobalt, nickel, lithium and natural graphite.
Mining properties in S&P Global data have been considered according to all commodities reported in the original database.
3. Results
3.1. Main results from CUSA
The first part of CUSA project led to the identification of 55 corridors, in close dialogue with the EU Delegations in Africa, and covering all regions of the continent ().
Figure 2. The initially identified 55 Corridors and the final envisaged 11 Strategic Corridors, as emerged from the CUSA project (source [Citation1]).
![Figure 2. The initially identified 55 Corridors and the final envisaged 11 Strategic Corridors, as emerged from the CUSA project (source [Citation1]).](/cms/asset/a8b2359e-0857-4628-9f11-e089efe73074/nsme_a_2124786_f0002_oc.jpg)
The characterisation and subsequent multi-criteria analysis, which used the 32 selected quantitative indicators, led to specific rankings of the 55 corridors. In turn, for 31 corridors best scoring in each of the four scenarios, detailed informative fiches have been compiled and used for further scrutiny within the European Commission Services, financial institutions, African Union and other relevant stakeholders. Such a process has further contributed to define the 11 prioritised Strategic Corridors in Africa ().
The final recommended corridors would potentially benefit from NDICI investments (Neighbourhood, Development and International Cooperation Instrument), in the form of multi-country Team Europe Initiatives shaped along the Strategic Corridors themselves [Citation22].
3.2. Main results from CUSA as mineral resource corridors
gives an overview of the 11 corridors with an emphasis on the number of mining properties falling inside them. More detailed results are reported in .
Figure 3. Number of mining properties located in Strategic corridors, by production stage and type.
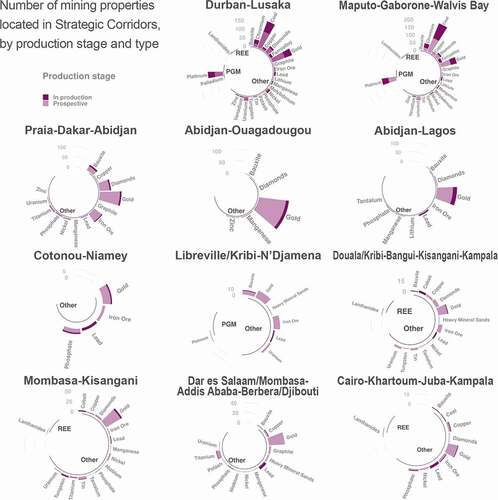
Table 3. Number of mining properties distributed across corridors (source: elaboration from S&P Global data).
At a glance, some corridors look particularly rich in type of commodities and number of related mining properties, e.g. Durban-Lusaka and Maputo-Gaborone-Walvis Bay, while other corridors show opposite results, e.g. Cotonou-Niamey.
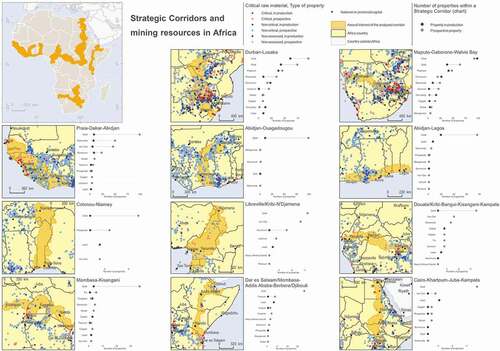
maps the overlap between the 11 corridors and mining properties, with an emphasis on critical raw materials. In the context of the current paper, the bar charts of report the number of mining properties only, in view of future and more detailed analyses in which, for narrower target areas, it will be possible to better investigate on the size of deposits, possible volumes of production and interlinks with the related infrastructures for energy, transport and water, among others.
Figure 4. Strategic Corridors and mining resources in Africa.
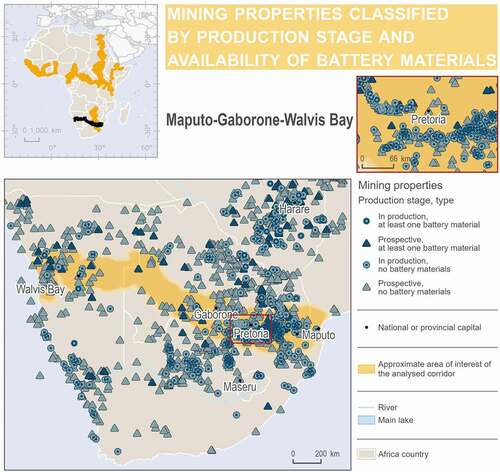
zoom on two corridors with substantial current and potential future mines, including for battery materials, which clearly shows that in the case of Durban-Lusaka and Maputo-Gaborone-Walvis Bay Strategic Corridors are also mineral corridors.
Figure 5. Mining properties classified by production stage and availability of battery materials: Durban-Lusaka.
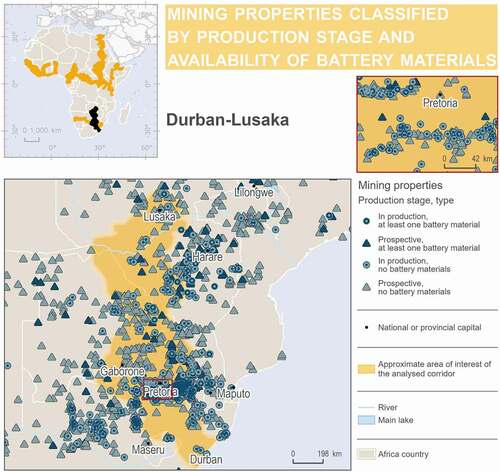
Figure 6. Mining properties classified by production stage and availability of battery materials: Maputo-Gaborone-Walvis Bay.
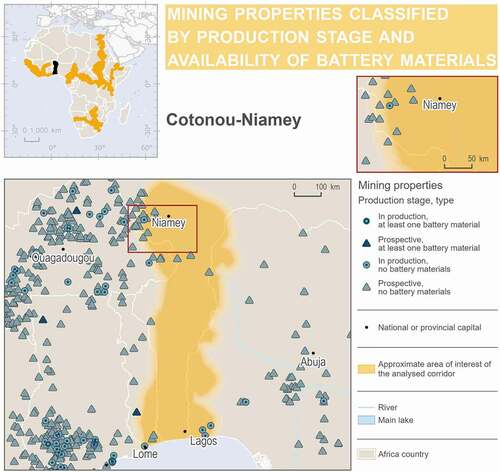
On the contrary, highlights one example in which the role of Strategic Corridors as mineral resource corridors seems marginal, at least based on this level of knowledge.
Figure 7. Mining properties classified by production stage and availability of battery materials: Cotonou-Niamey.
The supplementary information shows the same visual analysis for the remaining eight corridors.
reports the distribution of mining properties across African regions and Strategic Corridors. The analysis shows that in two regions, Southern and West, nearly half (49%) of the mining properties fall inside one corridor at least. In the case of the Northern and Central regions, only 12% and 15%, respectively, of the mining properties fall inside at least one corridor. The East region features 24% of the mining properties included in corridors. As a reference term, the total area covered by all the 11 Strategic Corridors is around 18% of the African continent.
Table 4. Distribution of mining properties across African regions and Strategic Corridors (source: elaboration from S&P Global data).
4. Discussion
The requirements of the study in support to the selection of EU–Africa Strategic Corridors and the wide range of topics to cover made it necessary to deal with very diverse data sources and, as a consequence, input data with different characteristics as to the criteria listed above. Data and indicators where therefore selected to make them compatible in terms of quality and accuracy, also filling data gaps by using data fusion techniques.
Conversely, in the investigation on Strategic Corridors as mineral resource corridors, only one data source was identified with continent-wide coverage and adequate spatial resolution: S&P Global data. Even though the initial assessment was possible and the results appeared to be consistent with the stated objectives, for more in-depth and quantitative analyses also other sources should be considered, as well as the scale of investigation should be narrowed to single corridors or sub-corridors. In fact, only at a lower scale, it would be possible to better understand how mineral resources can act as a catalyser to create and strengthen value chains and territorial organisation, in turn boosting economic and societal development at regional or higher scale.
Nonetheless, 5 of the 11 Strategic Corridors seem to also be mineral resource corridors, as 49% of mining properties fall inside them: Durban-Lusaka and Maputo-Gaborone-Walvis Bay in the Southern Region and Praia-Dakar-Abidjan, Abidjan-Lagos and Abidjan-Ouagadougou in the Western region. Some of the other corridors show several mining properties in the close neighbourhood, so that the initial results shown in this paper might be used as a starting point for future expansion of the corridors or parallel initiatives. Also, the presence of several mining properties associated with battery materials encourages future investigation.
The only corridor across the Northern region, Cairo-Khartoum-Juba-Kampala, can be taken as an example of limited coverage by S&P Global data, which again suggests to use multiple data sources in future assessments.
5. Conclusions
The methodology, developed in the CUSA project and discussed in this paper, constituted a novelty in the way Strategic Corridors and urban systems were defined and mapped, characterised and assessed using quantitative approaches. These approaches, coupled with the extensive consultations with various stakeholders, guaranteed the objectivity and transparency of the whole process. The evidence produced could therefore support decision-makers in the final selection of Strategic Corridors.
Based on the current results at continent-wide scale, it can be concluded that at least five EU–Africa Strategic Corridors can also be considered as mineral resource corridors. Corridors, in fact, facilitate access to current and potential future mines by providing transport and energy infrastructures, among others, and, in turn, put the related mineral industries in the context of a stronger and more strategic territorial organisation focused on economic and social development at regional or higher scale.
Even though a general conclusion can be drawn on the fact that EU–Africa Strategic Corridors certainly contribute to mitigate the risk of supply disruptions of Critical Raw Materials for the EU, further investigation is needed, in narrowed and targeted areas and using multiple data sources, to identify future potential flows of mineral commodities and quantify the related risk mitigation factors.
Supplemental Material
Download JPEG Image (605.2 KB)
Supplemental Material
Download JPEG Image (596 KB)
Supplemental Material
Download JPEG Image (605.2 KB)
Supplemental Material
Download JPEG Image (638.7 KB)
Supplemental Material
Download JPEG Image (515.4 KB)
Supplemental Material
Download JPEG Image (626.6 KB)
Supplemental Material
Download JPEG Image (683.6 KB)
Supplemental Material
Download JPEG Image (702.6 KB)
Supplemental Material
Download MS Word (66.5 KB)Acknowledgements
The analysis presented in this paper is based on the work carried out in the CUSA Project, which was financed and supported by the Directorate General for International Partnerships of the European Commission.
Disclosure statement
The authors are responsible for the content, which does not necessarily reflect the views of the European Commission.
Supplemental data
Supplemental data for this article can be accessed online at https://doi.org/10.1080/17480930.2022.2124786.
Correction Statement
This article has been corrected with minor changes. These changes do not impact the academic content of the article.
References
- C. Baranzelli, A. Kucas, B. Kavalov, A. Maistrali, M. Kompil, S. Oliete Josa, M. Parolin, and C. Lavalle , Identification, characterisation and ranking of Strategic Corridors for an Enhanced and Greener in Africa, EUR 31069 EN, Luxembourg: Publications Office of the European Union, 2022. ISBN 978-92-76-52430-4, doi:10.2760/498757, JRC128942.
- P. Pottier, Axes de communication et développement économique, Revue. Économique. 14 (1963), pp. 58–132. doi:10.3406/RECO.1963.407543.
- S.I. Azubuike, S. Nakanwagi, and J. Pinto, Mining resource corridor development in Nigeria: Critical considerations and actions for a diversified and sustainable economic future, Mineral. Economics. (2022), pp. 1–17. doi:10.1007/s13563-022-00307-5.
- W.(. Xu, Y. Long, and W. Zhang, Prioritizing future funding and construction of the planned high-speed rail corridors of China – According to regional structure and urban land development potential indices, Transp. Policy (Oxf) 81 (2019), pp. 381–395. doi:10.1016/J.TRANPOL.2017.08.002.
- A.E. Bastida, From extractive to transformative industries: Paths for linkages and diversification for resource-driven development, Mineral. Economics 27 (2–3) (2014), pp. 73–87. doi:https://doi.org/10.1007/s13563-014-0062-8.
- Adam Smith International (ASI), Integrated Resource Corridors Initiative Scoping &, Business Plan , 2015. http://wwf-sight.org/wp-content/uploads/2017/01/IRCI_Scoping_Report_Business_Plan.pdf
- J. Baxter, A.C. Howard, T. Mills, S. Rickard, and S. Macey, A bumpy road: Maximising the value of a resource corridor, Extr. Ind. Soc. 4 (2017), pp. 439–442. doi:10.1016/j.exis.2017.06.007.
- W. Dzumbira, H.S. Geyer, and H.S. Geyer, Measuring the spatial economic impact of the Maputo development corridor, Dev. South Afr. 34 (2017), pp. 635–651. doi:10.1080/0376835X.2017.1318699.
- P. Srivastava, 2011. ADB Economics Working Paper Series Regional Corridors Development in Regional Cooperation.
- A. Hope and J. Cox, Development Corridors, EPS-PEAKS Topic Guide, 2015. https://assets.publishing.service.gov.uk/media/57a08995e5274a31e000016a/Topic_Guide_Development_Corridors.pdf
- C. Enns, Mobilising research on Africa’s development corridors, Geofurum 88 (2018), pp. 105–108. doi:10.1016/j.geoforum.2017.11.017.
- J. Kirshner and M. Power, Mining and extractive urbanism: Postdevelopment in a mozambican boomtown, Geoforum 61 (2015), pp. 67–78. doi:10.1016/J.GEOFORUM.2015.02.019.
- E. Sulle, Social differentiation and the politics of land: Sugar cane outgrowing in Kilombero, Tanzania, 43 (2016), 517–533. 10.1080/03057070.2016.1215171.
- S. Oliete Josa and F. Magrinyà, Patchwork in an interconnected world: The challenges of transport networks in Sub-Saharan Africa*, 38 (2018), 710–736. 10.1080/01441647.2017.1414899.
- EC, 2020. JOIN, 4 Final - JOINT COMMUNICATION to the EUROPEAN PARLIAMENT and the COUNCIL – Towards a Comprehensive Strategy with Africa, 2020. https://eur-lex.europa.eu/legal-content/EN/TXT/PDF/?uri=CELEX:52020JC0004&from=EN
- European Commission, 2022. EU-Africa: Global gateway – Strategic corridors [WWW Document]. (accessed 9.5.2022). https://ec.europa.eu/commission/presscorner/detail/en/fs_22_1119
- E. Commission, 2020. European commission, critical raw materials resilience: Charting a path towards greater security and sustainability, communication COM (2020) 474 final, (20.4.2022) https://eur-lex.europa.eu/legal-content/EN/TXT/HTML/?uri=CELEX:52020DC0474&from=EN.
- G.A. Blengini, P. Nuss, J. Dewulf, V. Nita, L.T. Peirò, B. Vidal-Legaz, C. Latunussa, L. Mancini, D. Blagoeva, D. Pennington, M. Pellegrini, A. van Maercke, S. Solar, M. Grohol, and C. Ciupagea, EU methodology for critical raw materials assessment: Policy needs and proposed solutions for incremental improvements, Resour. Policy. (2017), pp. 53. doi:10.1016/j.resourpol.2017.05.008.
- D. Schrijvers, A. Hool, G.A. Blengini, W.-Q. Chen, J. Dewulf, R. Eggert, L. van Ellen, R. Gauss, J. Goddin, K. Habib, A. Thorenz, and P.A. Wäger, A review of methods and data to determine raw material criticality, Resour. Conserv. Recycl. (2020), pp. 155. doi:10.1016/j.resconrec.2019.104617.
- T.Y. Chen, Comparative analysis of SAW and TOPSIS based on interval-valued fuzzy sets: Discussions on score functions and weight constraints, Expert Systems with Application. 39 2 (2012), pp. 1848–1861. https://doi.org/10.1016/J.ESWA.2011.08.065
- M.G. Kendall Gibbons Jean Dickinson, Rank Correlation Methods, E. Arnold ; Oxford University Press, London; New York, NY, 1990.
- European Parliament, REPORT on the Proposal for a Regulation of the European Parliament and of the Council Establishing the Neighbourhood, Development and International Cooperation Instrument | A8-0173/2019 |, European Parliament, 2019. https://www.europarl.europa.eu/doceo/document/A-8-2019-0173_EN.html
- S&P Global, S&P Global Market Intelligence, SNL Metals & Mining data, 2022. https://www.spglobal.com/marketintelligence/en/campaigns/metals-mining Data last accessed: April 2022
- ICMM, 2020. International Council on Mining & Metals – Role of mining in national economies: Mining contribution index, (5th edition).