
 ?Mathematical formulae have been encoded as MathML and are displayed in this HTML version using MathJax in order to improve their display. Uncheck the box to turn MathJax off. This feature requires Javascript. Click on a formula to zoom.
ABSTRACT
Social media has opened new doors of opportunities and risks for youth. Potential risks include exposure to harmful content, engagement with strangers, or unwanted consequences from irresponsible or naive use. Social media literacy has been proposed as a way to mitigate such risks and promote positive ways of social media engagement. This paper aimed to develop a comprehensive Youth Social Media Literacy Inventory (YSMLI) to objectively assess young adolescents’ (9–13 years) knowledge and skills in the context of social media use. The development process included four consecutive steps: 1) an in-depth review of the literature to identify core competencies and domains of social media literacy, 2) creation of a large item pool that assesses these core competencies within six domains (advertising, cyberbullying, privacy, news, phishing, and media balance), 3) expert review and cognitive pretesting with youth, and 4) empirical validation of the final 90-item pool using item response theory based on a sample of n = 306 youth participants in the US. The final item bank is well-fitting, reliable, and valid, offering scales with varying lengths for different purposes including domain-specific assessment and parallel testing.
IMPACT SUMMARY
Prior State of Knowledge
Social media literacy has been proposed as a way to mitigate risks and maximize the benefits of social media use. Yet, there are currently no objectives and validated measures for assessing young children’s social media literacy knowledge and skills.
Novel Contributions
We developed and validated the Youth Social Media Literacy Inventory, a 90-item bank, that can be used to objectively assess youth’s social media literacy. Due to its excellent psychometric properties, it allows scholars to create scales of varying length and for different research purposes.
Practical Implications
Educators and researchers can use the inventory to assess the effectiveness of social media literacy interventions; compare levels of social media literacy across groups, schools, or populations; and assess antecedents and consequences of social media literacy.
Introduction
Adolescents are more digitally connected than ever before (Vogels, Citation2019). Among those aged 13–19, 95% have access to a smartphone and 45% report being online almost constantly (M. Anderson & Jiang, Citation2018). Across ages, social media have become a place to connect with others, find news, and engage in politics (Auxier et al., Citation2019), with many social and developmental opportunities for youth, including social connection and communication, exposure to new ideas and knowledge, safe identity experimentation, and opportunities for self-presentation (Best et al., Citation2014; Craig et al., Citation2021). Despite many opportunities, there are legitimate concerns about media exposure and (over)use, especially for youth who are at a greater risk due to their age-related vulnerabilities. These risks originate from potentially harmful content (e.g., violent, sexual, or hate material), contacts (e.g., cyberbullying, privacy violation, cyberstalking, or being contacted by strangers), conduct in which the youth can be either a perpetrator or victim (e.g., sharing too much personal information, illegally downloading materials, hacking, etc), and contracts resulting from being exploited by a contract or commercial interests (Livingstone & Stoilova, Citation2021; Livingstone et al., Citation2015). These mixed risks and benefits imply that we should not simply discourage social media use. Despite potential risks, it can help with key developmental tasks for adolescents (Uhls et al., Citation2017).
Media literacy education is an essential tool to help youth strike the right balance in their use of social media by fostering knowledge and skills to adeptly navigate the online world (Hobbs, Citation2010; Potter, Citation2010). Developmentally, middle school-aged youth are a prime audience for media literacy education. On the brink of adolescence, they are faced with key developmental tasks related to building and expanding relationships with peers as well as identity exploration and formation (Erikson, Citation1950; Orenstein & Lewis, Citation2021). Social media is an increasingly pervasive space in which young people are engaging in these tasks (Best et al., Citation2014; Reid & Weigle, Citation2014; Third et al., Citation2017; Uhls et al., Citation2017). This developmental stage is a key point for educational interventions designed to promote social media literacy but must be specifically applied to the contexts and issues found in socialmedia.
Educational interventions have the potential to improve youth social media literacy, but researchers need a way to rigorously assess the impact of these efforts, highlighting the need for objective measures of youth social media literacy. Although some measures of overall media literacy exist, they have considerable limitations. First, they mostly fall short of assessing social media literacy specifically. Second, they are not designed for use with a youth population. Third, most of them measure subjective rather than objective literacy that requires individuals to rate their own level of literacy and are thus based on potentially biased self-assessments. Fourth, existing measures are limited to specific use cases, without offering flexibility (e.g., in length or domain specificity) or parallel tests. To address these limitations, the goal of the current study is to develop a reliable, valid, and objective social media literacy inventory for young adolescent populations from which different scales and tests can be created.
This paper describes the development of the Youth Social Media Literacy Inventory (YSMLI) through four steps (cf. Carpenter, Citation2018): The item development process encompasses (1) a media and social media literacy literature review, (2) the initial item bank creation and first phase of item reduction, and (3) cognitive pretesting with a sample of youth and expert review. The last step, (4) the validation using item response theory (IRT), presents an empirical survey study among youth to assess the inventory’s psychometric properties.
Step 1: Exploration of social media literacy concepts
Prior to developing the inventory items, we reviewed definitions and concepts of media literacy and social media literacy to better understand how these constructs were conceptualized in existing research. This limited review included definitions of related terms, such as digital literacy, information literacy, and digital citizenship, as well as underlying competencies central to the development of social media literacy. We also reviewed existing scales and instruments designed to assess social media literacy to highlight gaps and potential for improvement.
Theoretical perspectives
Modern digital and media literacy approaches extend protectionist frameworks, which focus on teaching youth to identify and reduce the potential negative effects of media exposure, to include skills for creating messages and engaging in online communities in socially responsible ways, thus “empowering” individuals in the process (Hobbs, Citation2010). Educational efforts should be more than inoculation, aiming to develop critical thinkers, effective communicators, and active citizens (Hobbs, Citation2010).
Hobbs identified five core competencies of digital and media literacy, which include accessing media and technology tools skillfully, analyzing and evaluating messages and their potential effects, creating content, reflecting on one’s own behavior and conduct, and acting to share knowledge and solve problems in online communities (Hobbs, Citation2010). Digital citizenship is related to some of these competencies (such as reflect and act), but focuses on the social responsibility and appropriate, responsible behavior that comes with being part of an online community, helping to develop respect, tolerance, and civic engagement online (Chen et al., Citation2021; Jones & Mitchell, Citation2016).
Although social media literacy can be partly derived from the literature on digital and media literacy, the distinctive affordances and characteristics of social media require customized approaches (Daneels & Vanwynsberghe, Citation2017; Schreurs & Vandenbosch, Citation2021). Social media platforms contain mostly user-generated content, which is more personal and self-focused than traditional media content (Cho et al., Citation2022), with audiences who are often close to and similar to the content creator (Schreurs & Vandenbosch, Citation2021). That is, despite the potential to reach and interact with wide, diverse audiences on social media, by creating and interacting with selective content most social media users experience algorithmic curation, which shapes the content and people with which they connect through previous interaction choices (Kitchens et al., Citation2020; Spohr, Citation2017). The interpersonal features and affordances of social media are the core appeal for most users and are characterized by the editability, accessibility, and asynchronicity of social media (Bayer et al., Citation2020), blending mass and interpersonal features through personalized content (Cho et al., Citation2022) and fostering communicative relationships between content creators and audiences (French & Bazarova, Citation2017). Social media literacy must encompass the skills of decoding, evaluating, and creating communication in the realms of representation and interaction (Cho et al., Citation2022; Livingstone et al., Citation2014) and acknowledge the self’s role in selection of and engagement with social media content, resulting in a malleable representation of reality (Cho et al., Citation2022; Schreurs & Vandenbosch, Citation2021).
Youth social media literacy must address the core competencies of media literacy but adapt them to the unique nature of social media. Based on the literature review above, we define social media literacy as a multidimensional concept consisting of five cross-cutting competencies: the ability to 1) find and access social media platforms and use them and their respective options and channels skillfully, 2) critically evaluate social media content and its potential consequences, 3) generate creative social media content with an awareness of the specific audience, 4) reflect on one’s own behavior, apply social responsibility, and adequately manage one’s affective responses, and 5) develop and perpetuate prosocial behavioral norms and exhibit digital citizenship. By defining social media literacy as a set of competencies, we explicitly differentiate literacy (as the combination of knowledge, abilities, and skills) from performance (the actual demonstration of literacy in observable behavior). From this, it follows that one may have high social media literacy (competencies or abilities) but not apply them to action (though one is more likely to act if one has the competencies, which provides the justification for developing these competencies). Both objective measures of these competencies and observations of the connected behaviors (or lack thereof) are critical for understanding social media literacy. Clearly separating literacy from performance also allows for the investigation of enforcing or inhibiting factors that explain why higher literacy at times does not translate into literate behavior.
Conceptually, social media literacy may be well defined by these core competencies, which are sufficiently abstract to be applied to different types of uses, contents, and context. They apply across social media platforms as well as use situations. However, for the purpose of measuring social media literacy, they remain too abstract and are difficult to grasp for young adolescents (Piaget, Citation1964). Social media use is diverse ranging from creating posts, using like and share buttons, managing privacy, assessing content, and dealing with advertising to understand user practices, norms, and managing excessive use. For a meaningful measure of social media literacy, the core competencies must be applied to these various concrete domains. Thereby, they will be translated into specific skills that can be assessed as reliable, manifest indicators in an objective test situation.
Drawing on the research literature describing both the benefits and the risks of social media use (e.g., Livingstone et al., Citation2014; O’Keeffe et al., Citation2011), we identified commonly described risk/opportunity situations for youth. Further, we consulted with media literacy education experts from Common Sense Education and drew topics from their current Digital Citizenship curriculum (James et al., Citation2021). Following this synthesis, we identified six domains that pose the most frequently discussed and addressed opportunities and challenges for youth 1) reflecting on how social media can make you feel and using social media in a positive and balanced way (“media balance”), 2) identifying signs of cyberbullying and practicing how to respond (“cyberbullying”), 3) learning how to positively shape digital footprints and manage privacy (“privacy”), 4) learning how to identify and cope with advertisements on social media (“advertisements”), 5) evaluating and responding to (fake) news in social media (“news”), and 6) learning how to identify and take action against phishing scams on social media (“phishing”). Though not exhaustive of all the situations a young user may face in social media, they should supply enough information to infer overall social media literacy. These domains further provide contexts to which the cross-cutting social media literacy competencies described above can be adapted and thus ultimately demonstrated. For example, in the privacy domain, users can apply skills such as the abilities to find/access and evaluate content with regard to its intimacy, generate content with an awareness of the potential audience and associated risks and benefits, reflect on one’s own behavior and implemented safeguards, and perpetuate prosocial behavioral norms such as asking for consent before sharing sensitive information.
Limitations of existing measures
Several measures of media literacy exist (e.g., Festl, Citation2021; Koc & Barut, Citation2016; Powers et al., Citation2018). However, these measures have limited applicability to social media literacy because they do not address the interpersonal and interactive nature of such platforms. Measures of social media literacy developed for adults are not appropriate to use with youth, either. Youth are very different from adults in their reading literacy and cognitive developmental stage (Piaget, Citation1964), which may significantly change question comprehension. Most importantly, these existing measures of social media literacy require individuals to rate their own level of literacy and are thus prone to individual biases, over- and underestimation, and subjective beliefs about what skills and abilities are actually meant. Therefore, a major aim of this research is to provide a validated instrument that allows for the objective, unbiased assessment of social media literacy. By objective assessment, we mean a quantifiable, impartial, and thus diagnostic instrument that allows us to assess social media literacy consistently and is less prone to biases (e.g., a measure that is based on a standard test format, such as, e.g., multiple choice questions that can be coded as objectively correct or incorrect). Moreover, we aimed to create a larger item bank instead of a single scale that offers adaptability to different uses and contexts. Informal, but objective assessments of youth social media literacy by Facebook, Google, and Common Sense EducationFootnote1 also exist but have not been psychometrically validated.
Step 2: Item development
Initial creation of a comprehensive item pool
We drafted 20 questions for each of the six social media literacy domains described above, resulting in 120 items. These questions were designed to reflect the key competencies in each domain as well as actions that could be taken related to each issue (for example items and how they map onto domains and competencies, see on p. 3 in the online supplement: https://osf.io/mxsz4/). For example, one of the items within the domain “cyberbullying” assesses a user’s ability to identify examples of cyberbullying on social media (“Which of the following is an example of cyberbullying?”), reflecting the core competency “critically evaluate.” For many items, we created hypothetical scenarios that represent particular risks or opportunities. Response options reflect literate or non-literate behavioral responses, allowing participants to hypothetically demonstrate literate behavior via choice of the correct answer. Although there is a clear correct response in the options provided for each question, the response options are not exhaustive of all appropriate responses or actions for a particular dilemma. For each of the six domains, we developed items that reflected the core competencies in a similar fashion. Within each domain, we created questions with varying difficulty for middle school-aged youth. To cover the range of potential proficiencies in each domain, we aimed to create 5 easy, 10 medium, and 5 difficult items. Most items were multiple-choice items with four response options (with only one correct response). Some items were true/false statements. We further added the answer option “I don’t know,” to reduce guessing. As each item has only one correct answer from the list of options provided, all items can be scored as 1 = correct and 0 = incorrect.
Table 1. Fit indices for each domain.
Each item and its response options were reviewed for reading level, using Microsoft Word’s tool to determine Flesch-Kincaid reading level (Kincaid et al., Citation1975). We aimed to keep the items at a fourth-grade reading level. More complex items were simplified and the reading level was re-assessed.
Qualitative item assessment and item pool reduction
To assess the range of difficulties of the items in each domain and ensure that they would adequately cover the range of expected proficiency within the targeted youth population, all items were independently rated by all five members of the research team for perceived level of difficulty, with 1 being easiest to answer correctly and 3 being perceived as the most difficult. Independent rates were compared and discussed until consensus was reached. Three members of the team also assessed each item based on Bloom’s Taxonomy, a hierarchical categorization of educational goals (Bloom, Citation1956). The levels of this model reflect increasingly complex cognitive activities, from remembering, understanding, applying, and analyzing to evaluating and creating (L. W. Anderson et al., Citation2001). Categorization within this taxonomy was an additional way of examining the complexity of a particular question. The independent rankings of taxonomy levels for each item were compared and discussed until consensus was reached for each item. Using the perceived difficulty and Bloom’s Taxonomy rankings, the item pool for each of the six domains was reduced from 20 to 15, yielding a total of 90 items. Items were reduced such that the final 15 items for each domain contained a range of difficulty (about 4 easy, 7 medium, and 4 difficult items), reflected various levels of cognitive complexity (according to Bloom’s Taxonomy), and addressed the scope of social media literacy core competencies.
Step 3: Expert review and cognitive pretesting
Next, we obtained expert feedback regarding the items from two educators, each with over 10 years of experience working with middle school-aged children. The educators were asked to review each of the 90 items and provide qualitative feedback on question and response option content, wording, readability, interpretation, and quality (Carpenter, Citation2018). This step enhanced the overall content validity and ensured questions are relevant to the construct, clear, and concise (Kyriazos & Stalikas, Citation2018). Feedback was given through written and verbal comments, which was used to revise items.
Additionally, we cognitively pretested the items with six young people, ages 9 and 10 (the younger end of the age range of people expected to respond to the YSMLI). Each youth was compensated with a $10 Amazon gift card. During these interviews, a member of the research team connected with a youth participant via Zoom, reviewing one question at a time. Each participant reviewed the questions from two of six domains; at least two young people reviewed the items from a single domain. Participants read the questions and response options aloud and described their thoughts in selecting an answer. By observing this process, the interviewer was able to identify problematic words, unclear questions, or items that were too lengthy. After the question was answered, the participant was asked what they thought the question was about and to identify any words they thought other youth might have difficulty in understanding. This process helped us to streamline the questions further and also identified problematic jargon to replace.
Step 4: Empirical scale validation
Finally, we statistically examined the inventory’s potential to assess the latent ability (proficiency) of social media literacy and the presence (or lack) of the six domains within that latent ability. We assumed that social media literacy would be a multidimensional construct, meaning each item loads onto its specific domain (e.g., news in social media) and also loads onto a comprehensive global factor. These model assumptions were tested using item response theory, described below. To further ensure the convergent validity of the inventory, we tested whether objectively measured social media literacy (as assessed by the YSMLI; overall and in each domain) significantly relates to participants’ subjective perceptions of their social media literacy (overall and in these domains). Based on a meta-analysis of 51 studies, which found a moderate positive correlation between objective and subjective knowledge (r = .37; Carlson et al., Citation2009), we hypothesizedFootnote2:
H1:
Social media literacy in each of the six domains is positively related to subjective knowledge in each of the six domains.
Regarding criterion validity, we tested whether overall social media literacy can be predicted with diverse social media use variables, such as experience with social media, duration of daily use, number of social media platforms used, and degree of interactivity on social media (i.e., passive consumption versus active content creation). Social network site use among students has been shown to be positively correlated with digital literacy scores (Yildiz Durak & Seferoğlu, Citation2020). Likewise, frequency of use has been found to have a positive relationship with some types of literacy (Appel, Citation2012; Chan et al., Citation2021). As both findings support the argument that social media literacy increases the longer and the more people have interacted with such platforms, we hypothesized:
H2:
Social media literacy is positively related with a) experience using social media, b) average social media use duration per day, and c) breadth of platform use.
H3:
Social media literacy is positively related with more interactive social media use (e.g., creating their own posts will be related to higher levels of literacy compared to passive use).
Methods
The preregistration of this study as well as all materials (including all item formulations as well as information about which items should be chosen for different versions and parallel tests), analysis scripts, results, synthetic data, and additional analyses, tables and figures in an online supplementary materials (OSMs) document can be accessed via a respective OSF page: https://osf.io/h6jrp/. While we do not share the original data publicly due to the sensitivity of the encoded information and the vulnerability of the population (youth aged 9–13), we uploaded synthetic data, a data set with similar properties to the original data set, that can be used to computationally reproduce the analyses (albeit with slightly different results). The study was approved by the Institutional Review Board of the Cornell University (protocol number: 1901008496).
Item sampling and power considerations
The purpose of this validation study is to evaluate the entire 90-item inventory, but we anticipated that youth cannot concentrate on all 90 items at once. Therefore, we used an item sampling approach, randomly assigning a subset of the item pool to each participant (Husek & Sirotnik, Citation1967). In order to determine the minimum number of items each individual participant would need to answer to still have enough information to evaluate the full scale, we simulated data that corresponds to the intended measurement model (for the complete simulation procedure see: https://osf.io/5fhvb), while varying the parameters with respect to a) number of participants (from 200 to 500) and b) number of items (from 60 to 120). Next, we duplicated these datasets and introduced varying amounts of random missings per respondent (33% to 66%). We then computed the Rasch score for the full dataset as well as the dataset with varying amounts of random missings and computed correlations between these resulting Rasch scores. This comparison indicated the maximum number of random missings allowable to yield a Rasch score comparable to a dataset with no random missings. Each combination was run 100 times (see on p. 4 in the OSM: https://osf.io/mxsz4/). The simulation showed that the latent ability could still be reasonably approximated (r > .90) if participants did not answer two-thirds of the overall item pool, the sample size was > 300, and the item pool was > 80. To allow for a bit larger margin of error, we decided to test the items with a sample size of n > 320, and 42 items per participant (53.33% missing per person). Furthermore, we conducted a priori power analyses for our convergent and criterion validity analyses (see hypotheses). The literature suggests that subjective and objective knowledge are moderately correlated (r = .37; Carlson et al., Citation2009). We further assumed a small to moderate relationship between overall social media literacy and the other criterion variables (r = .20). To test an effect size of r = .20, while assuming an alpha-level of 5%, we determined that we would need at least 318 participants to achieve a power of 95% and at least 193 participants to achieve a power of 80%.
Participants and procedure
To assess the 90-item bank, we conducted an online survey with n = 347 middle school students in March 2021, after obtaining parent or guardian permission and youth assent to participate. Participants were recruited from a school district in upstate New York in the United States. One participant who did not pass a simple attention check was excluded from the analyses. Participants with more than 70% missing in response to the literacy items were further excluded from the analyses (n = 40) because the simulation showed a decline in the ability to approximate latent ability with less than one-third of items completed (average amount of missing items was 54.9%; only 23.5% of the sample had more than the 53.33% missing that was expected because of our item sampling procedure). The final sample included n = 306 participants (age: M = 11.4 years, SD = 1.13, range = 9–13; female: 48.57%). Participants were drawn from fourth (15.11%), fifth (21.94%), sixth (32.01%), seventh (30.58%), and eighth (0.36%) grades. More than half of the participants (65%) have used social media for at least one year prior to completing the questionnaire. Most commonly used platforms included YouTube (91.3%), TikTok (53.1%), SnapChat (42.6%), and Instagram (39.4%). Twitter and Facebook were hardly used (<10%).
Measures
The entire questionnaire including all item formulations can be found on the OSF page via the following link: https://osf.io/yb67h/. For the final inventory and the different scales that can be created based on it, see: https://osf.io/md8ch/.
Youth social media literacy inventory
As outlined before, our newly developed item pool consisted of 90 multiple-choice or true-or-false items, with 15 items for each of the six domains described above. We report all validity and reliability analyses for this measure in the result section.
Subjective social media literacy
Participants were asked to estimate their own literacy with six original items (one per domain: e.g., “I know how to spot ads on social media,” “I know how long things posted on social media stay there”). Answer options ranged from 1 = This is not like me at all! to 5 = This is exactly like me! For an overall assessment of a person’s subjective social media literacy, we estimated a unidimensional model (with constrained factor loadings), which fitted the data well, χ2(14) = 26.81, p = .020; CFI = .95, TLI = .95, RMSEA = .06. Composite reliability was acceptable (⍵ = .71). On average, the participants considered themselves moderately literate (M = 3.98, SD = 0.78).
Experience of using social media
Length of experience using social media was assessed with one item: “How long have you been using social media?” Response options ranged from: 0 = I don’t use social media to 4 = More than 2 years. Nearly half (45.0%) of the sample reported using social media for two or more years, 40.6% have used social media for less than two years, and 14.4% reported they do not use social media at all.
Duration of social media use
Duration of social media use was assessed with one item: “How much time do you spend on social media each day?” Response options ranged from: 0 = I don’t use social media to 6 =More than 6 hours a day. Of all participants, 13.7% did not use social media at all, 7.2% used it less than 30 min per day, 14.8% used it between 30 and 60 minutes per day, and the remaining 64.3% reported using social media more than 1 h per day.
Breadth and interactivity of social media use
Breadth and interactivity of social media use was assessed by asking participants how they use social media platforms including YouTube, Instagram, TikTok, SnapChat, Twitter, and Facebook. Response options included: 0 = Don’t use, 1 = Just watch/read posts (or videos) others make, 2 = Like other people’s posts/videos, 3 = Comment on other people’s posts/videos, or 4 = Create my own posts/videos. Responses were dummy-coded and summed, yielding a total number of platforms used (M = 2.27, SD = 1.45 of the six platforms). Participants reported being the most creative on TikTok (20.9% reporting they create their own posts/videos). We computed the highest level of interaction across all six social media platforms per person: 0 = don’t use the platform, 1 = passive use, 2 = moderate active use (liking and commenting), and 3 = active use (creating content).
Measurement theory
For the purpose of designing an objective knowledge test, item response theory (IRT; Bond & Fox, Citation2007; DeMars, Citation2010) provides several advantages over classical test theory (CTT). IRT refers to a set of mathematical models which aim to explain the relationship between a latent ability, trait, or proficiency (denoted by the Greek letter θ) and its observable manifestations (e.g., multiple-choice questions). In contrast to CTT, IRT considers responses in probabilistic terms, rather than focusing on composite variables and linear regression theory. IRT further accounts for item discrimination (ability of an item to differentiate between respondents with different levels of proficiency) and difficulty (likelihood of a correct response, expressed as the proficiency level at which 50% of the participant sample is estimated to answer an item correctly; DeMars, Citation2010). Assessing item difficulties is useful in matching the test and trait levels of a target population and in ensuring that the entire range of the proficiency is covered. This focus on the difficulty range generally leads to scales that perform better at differentiating at the extremes of proficiency (Bond & Fox, Citation2007).
Within the family of IRT models, the Rasch model represents a specific case in which the asymptote (i.e., the guessing probability) is fixed to zero and the slope (i.e., the discrimination parameter) is fixed to the same value across items. This model, traditionally specified in terms of odds or log odds, is the natural logarithm of the ratio between the probability of a person correctly answering an item and the probability of not answering this item correctly. This is equal to the differential between the proficiency of a person and the item’s difficulty. This constrained model has some mathematical properties that cannot be obtained with less constrained models (e.g., 2PL or 3PL models). First, the number-correct score (i.e., the raw sum score) is a sufficient estimation of θ, making such a scale highly usable in various research contexts. Second, due to the fixed discrimination parameter, the difference between the probabilities of correctly answering two different items remains constant across the entire range of the latent proficiency (DeMars, Citation2010). This means that all items do not differ in their ability to differentiate examinees. Third, such a constrained model is particularly useful for creating a social media literacy inventory due to its specific objectivity: Because the Rasch model is based on the idea that items are designed to fit certain properties instead of finding a model that fits the data (Thissen & Orlando, Citation2001), item as well as person parameter estimates are invariant across samples (up to a linear transformation, DeMars, Citation2010). Accordingly, the person (i.e., proficiency scores) and item parameters (i.e., item difficulty) will be similar even if only a subset of the item pool is used or a different population is studied.
Results
Assessment of the overall item bank
Model, item, and person fit
We estimated a unidimensional Rasch (1PL) model using all 90 items (converged after 31 cycles). Based on this model, we imputed the systematic missings in the social media literacy items (due to the item sampling procedure outlined above) and re-estimated the Rasch model using the imputed data (converged after 32 cycles) as model fit indices can only be estimated based on full data. The resulting Rasch scores were equivalent (r > .99), indicating there were only negligible differences in the results of these models. Thus, imputed data were used in subsequent analyses of item and person fit.
To assess overall model fit, we estimated the M2 test statistic, which works better with binary data compared to the typically implemented test statistics. The overall fit of the model was very good, M2(4005) = 4261, p = .002; CFI = 1.00, TLI = 1.00, RMSEA = 0.01, 95% CI [0.01, 0.018].Footnote3 We further computed Infit (sensitive to inliers, which are more targeted to the individual responding) and Outfit indices (which is sensitive to outliers, or unexpected instances of an item being very hard or very easy for a respondent) for each of the 90 items (Linacre, Citation2002). A guideline is that mean-square (MSQ) Infit and Outfit values should be between 0.5 and 1.5 to not be degrading or unproductive for measurement (DeMars, Citation2010; Linacre, Citation2002). MSQ Infit and Outfit indices fell within that range for all items, suggesting that all items fit the model well. We also assessed the standardized (z) person fit indices, which examines how well individual response patterns fit the model. Only a few respondents had a low person fit (z-Infit >1.9: 2.6%; z-Outfit >1.9: 2.6%; Linacre, Citation2002).
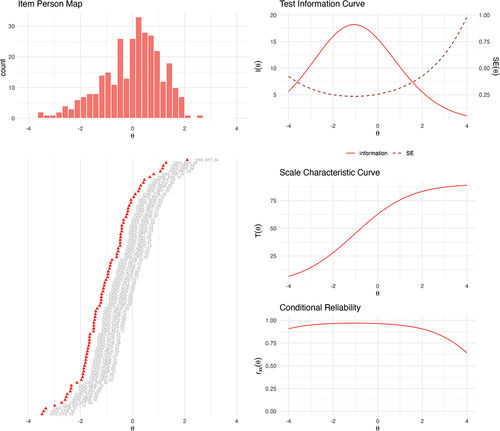
As illustrated in the histogram shown in (top left), the resulting theta score ranged from −3.42 to 2.48 (M = −0.01, SD = 1.13; equivalent to M = 60.42 correct items, SD = 18.80 on the raw inventory, i.e., the imputed 90-item bank). The test items were well matched to the participants’ latent proficiencies as shown by the S-curve in comparison to the person parameter distribution in the item-person map. Yet, we can also see that the scale is slightly better at discriminating people with lower proficiency and could hence be improved by adding some more difficult questions. As shown by the scale information curve (middle, right), the items are particularly good at estimating lower proficiency levels between the −2.5 and 1.0 theta range. The standard error for each parameter estimate (red, dotted line) thereby conveys the degree of estimation precision.
Figure 1. Psychometric characteristics of the 90-item YSMLI. The item-person map displays item difficulty parameters and person parameters along the same latent ability metric. The test information curve shows estimation precision across different values of theta. The scale characteristic curve represents the relationships between theta scores and the expected true scores in the original scale metric. The conditional reliability curve provides information about the scale’s reliability at different values of theta.
Marginal reliability
In IRT, an average index of reliability (similar to internal consistency scores such as Cronbach’s alpha) can be based on the mean standard error and computed as the ratio of true score variance to observed variance. This average marginal reliability was excellent: .93. As we also obtained separate standard errors for each value of , we computed both item information and conditional marginal reliability estimates across the entire range of proficiency (see , right). As bottom right demonstrates, the model’s reliability slightly decreases at theta values > 3. Again, this is likely due to the lack of highly difficult items in the pool.
Convergent and criterion validity
We anticipated that social media literacy as assessed by the entire item bank would be positively related to subjective social media knowledge (H1, convergent validity). Bivariate correlation analyses showed the expected moderate-to-strong positive relationship (r = .45, 95% CI [.36, .54], p < .001). Hypothesis 1 was supported.
We also anticipated that social media literacy would be positively related to experience using social media, average social media use duration per day, and breadth of social media platforms used (H2, criterion validity). In line with our predictions, bivariate correlations revealed positive relationships between social media literacy and experience using social media (r = .14, 95% CI [.02, .25], p = .021), duration of social media use per day (r = .18, 95% CI [.07, .29], p = .002), and breadth of social media platforms used (r = .14, 95% CI [.002, .26], p = .047). As pre-registered, we also estimated a linear regression. With all predictors in the model, only duration of social media use per day emerged as a significant predictor of social media literacy (b = .17, 95% CI [.02, .32], beta = .23). However, it is likely that this result is misleading as there was strong multicollinearity between the predictors. Based on the independent bivariate analyses, we consider hypotheses 2a to 2c supported.
With hypothesis 3, we assumed that people who use social media more interactively would also show higher social media literacy. Using an analysis of variance, we tested differences in social media literacy across different degrees of interactivity. We found a positive main effect (F(3, 266) = 5.29, p = .002, eta-squared = .056). Post-hoc tests (Tukey’s HSD), however, only revealed significant differences between those who did not at all use any social media platforms and those who did (independent of their level of interactivity). H3 was not supported.
To further explore the validity of the item bank, we also found that social media literacy moderately increased with age (r = .43, 95% [.33, .53], p < .001). Females had slightly higher social media literacy than males (on average, female participants answered 3.35 more questions correctly, t(250.83) = 3.05, p = .003). These findings are consistent with other assessments of media and social media literacy (Xiao et al., Citation2021).
Assessing the domains of social media literacy
Model, item, and person fit
We next examined each of the six domains within the overall item bank to assess their ability to stand alone as modular aspects of social media literacy. We estimated independent Rasch models for each domain, which each fitted the data well (see ). Only three items overall (in the domains Cyberbullying, Privacy, and News) had MSQ infit values slightly below .50, which means they are less productive for measurement, but not degrading (Linacre, Citation2002). Participants with low person fits were also negligible (less than 5% of the participants exceeded z-infit and -outfit thresholds). The items in each domain were well matched to the respondents’ social media literacy proficiencies as contextualized in that domain and could be used as a stand-alone set of items to assess social media literacy in that particular context (i.e., news in social media, cyberbullying, etc.).
Marginal reliability
The average marginal reliability for each domain was mixed (between .61 and .71). Whereas Advertising, Phishing, and Media Balance exhibited acceptable reliability (>.70), Cyberbullying, Privacy, and News had questionable reliability (.61–.67). This may be due to the diversity of concepts and skills assessed by items within each of these domains. Due to excellent item and person fit indices for all domains (generally more important evaluations in IRT) and strong convergent validity (see further below), we deem these lower marginal reliability estimates acceptable.
Convergent validity
We anticipated that social media literacy within each of the six domains assessed by the YSMLI would be positively related to subjective social media knowledge for each of those domains (H1, convergent validity). Bivariate correlation analyses showed that there were moderate positive relationships for advertising (r = .45, 95% CI [.36, .54], p < .001), cyberbullying (r = .24, 95% CI [.13, .34], p < .001), privacy (r = .31, 95% CI [.20, .41], p < .001), news (r = .25, 95% CI [.15, .36], p < .001), phishing (r = .17, 95% CI [.06, .28], p = .004), and ups and downs (r = .26, 95% CI [.15, .37], p < .001). Hence, hypothesis 1 was supported for each of the six domains.
Creating scales with different lengths and parallel tests
In most use cases, 90 items are too many to efficiently assess social media literacy. Therefore, this large item bank can also be used to create shorter versions or parallel tests for various purposes (for information about which items should be chosen for which version, see: https://osf.io/md8ch/). For example, to assess a population’s latent social media literacy as comprehensively as possible (e.g., similar to a PISA testFootnote4), it is useful to have a shorter version of the YSMLI. It should be sufficiently long to retain all the estimation precision of the original inventory, but short enough to be implemented in a test questionnaire. As the Rasch model constrained the discrimination parameter to be equal across all items, removing items does not necessarily reduce the model’s ability to approximate participants’ latent ability – particularly if the remaining items still adequately cover the distribution of the person parameters. We iteratively removed items from the 90-item bank by assessing their location on the latent ability (to keep a good range of difficulty) and their redundancy with other items. We were able to reduce the overall item bank to 48 items (eight items per domain). This shorter version showed a similarly good fit as the full inventory and had good reliability (.88). Detailed information about model, person, and item fit are provided in the OSM. To assess convergent validity, we computed the bivariate correlation between the Rasch scores of the full 90-item bank and the 48-item version, which revealed an almost perfect equivalence (r = .96).
As we selected items that also map well on the latent ability in each domain, bivariate correlations between the 15-item and the shorter 8-item domain scales were likewise still very high (r = .87–.90), suggesting excellent convergent validity for each domain. This presents a second potential use case as each domain can be assessed with only eight items. Researchers interested in measuring only one of these domains within a larger survey (e.g., a scholar interested in assessing social media advertising literacy) can use these subsets of items.
A third use case is assessing overall social media literacy as one of many variables. We aimed to find the smallest subset of items that still sufficiently estimated the overall latent ability. Using the same approach outlined earlier, we created an 18-item version, which still exhibited a good fit and still had an acceptable marginal reliability (.73). It still performed well in approximating the overall latent ability (correlation with 90-item Rasch score: r = .88; with 48-item Rasch score: r = .89). Additionally, each of the five social media literacy competencies described in step 1 of the scale development process are still addressed multiple times across the 18 items. As we again took great care to map remaining items (3 per domain) on the latent ability in each domain, the resulting 3-item scale per domain still correlated comparatively strongly with the full 15-item scale versions per domain (r = .68–.79). However, despite this seemingly statistical validity, we caution against using only three items as standalone measures for the subdomains as it is questionable how well they cover the broad range of knowledge and skills necessary in each domain.
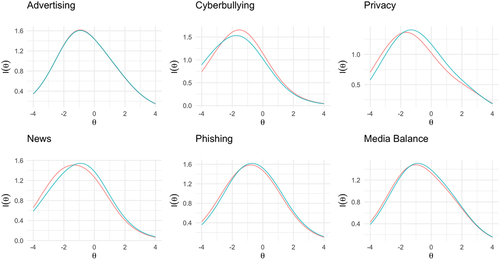
A fourth use case refers to designs in which repeated measurement of the latent ability is desirable (e.g., assessment before and after an intervention). In this situation, a researcher would want to use two different sets of items to assess the latent ability as a way to eliminate inflated post-intervention scores because respondents are familiar with the items. This requires parallel tests which have different items but the same number of items and exactly the same test information and characteristic function (Boekkooi-Timminga, Citation1990). To create such tests for each of the six domains, we identified similar items (in terms of difficulty and meaning), distributed them onto two sets with eight items each, and then assessed the overlap in the final test information curves for these two sets of items (). All subsets created in each domain overlap almost perfectly and correlate strongly with the full domain item sets (r > .82).
Figure 2. Test information curves for parallel test in each domain. Red = Test 1; Blue = Test 2.
Discussion
In this study, we sought to develop and validate a 90-item inventory that reliably assesses youth social media literacy. We engaged in a four-step process to rigorously create and psychometrically test the YSMLI.
First, based on our literature review, we found that although media literacy concepts suggest important core competencies, they neglect the affordances and features of the interactive social media environment. Building on previous work (Hobbs, Citation2010; Livingstone et al., Citation2014; Schreurs & Vandenbosch, Citation2021), we adapted core competencies of media literacy to address the unique characteristics of social media. More importantly, we argued that such abstract competencies must be grounded in specific domains of social media use to make them concrete enough for young adolescents to cognitively understand and thus measurable. For this reason, the final inventory measures core competencies in six distinct domains (such as cyberbullying, media balance, and privacy) which are representative of the issues and situations young adolescents face on social media.
The second and third steps involved item pool creation, revision, and reduction, based on ratings of the items’ perceived difficulty, complexity of learner action, expert educator review, and cognitive pretesting with youth. In the fourth step, the inventory was validated in a cross-sectional survey study using IRT. Rasch models revealed that the items in the overall item pool as well as those within each domain are well matched to the participants’ latent ability, thus serving well to discriminate between learners across a large range of proficiency. Further, overall reliability was high, although it decreased slightly at higher levels of proficiency. The Rasch score resulting from the overall item bank (and those resulting the subdomains) correlated positively with subjective knowledge, length of experience of using social media, duration of social media use per day, as well as breadth of social media use, demonstrating convergent and criterion validity. However, the YSMLI showed no correlation with the level of social media interactivity. That is, although literacy was clearly higher among users of social media compared to non-users, how much they interacted (i.e., whether they just consume content passively or like, comment, or produce content themselves) did not make a difference. With this new instrument, however, scholars may be particularly able to investigate such relationships and provide a deeper understanding of the antecedents and outcomes of social media literacy. In sum, the results suggest that the YSMLI has excellent psychometric properties and can be used to reliably assess youth social media literacy (ages 9–13).
We further demonstrated the adaptability of the inventory for four use cases. Our results show that a shorter, 48-item (8 items per domain) version can be drawn from the larger item pool, whose remaining items still cover the distribution of person parameters. This shorter scale as well as the resulting shorter scales for each domain showed as good a fit as the full scales, good convergent validity, and acceptable reliability. This shorter version retains high precision while reducing redundancy and may be particularly valuable for comprehensive assessments (e.g., for comparative purposes). The domain-specific sub-scales further provide measures for researchers who study these particular domains instead of overall social media literacy. We further identified the smallest item set (18-item, 3 per domain) that could still sufficiently approximate the latent ability of social media literacy and thus may be most useful for researchers seeking to assess social media literacy within a larger questionnaire. It is important to note that with only three items per dimension, it may no longer adequately assesses the domains individually. Finally, parallel tests for all six domains can be drawn from the item bank, which is useful for assessing social media literacy repeatedly, when test learning and familiarity effects may be an issue, such as when assessments are conducted before and after an intervention (i.e., in a pre-post within-subject design).
With this adaptability of the YSMLI, we anticipate a variety of uses in both academic and practical fields. Educators could assess the effectiveness of social media literacy interventions, or more broadly assess social media learning progress. Educational institutions can use the YSLMI to objectively evaluate a baseline level of social media literacy within larger populations, compare social media literacy across groups, classes, schools, or sub-populations. Scholars can further assess social media literacy with a comparatively short, objective, and validated scale and thereby expand their ways to assess potential antecedents as well as consequences of social media literacy.
Limitations and future perspectives
Although the full version of YSLMI showed good psychometric properties and high validity, the inventory has some limitations. First, it could benefit from adding more difficult items. As can be seen in the item-person maps, the ability to discriminate between people decreases slightly at higher levels of proficiency. Future research on the YSMLI should aim to add more difficult items to each domain and re-test model fit and ability to discriminate at all levels of proficiency. Similarly, future researchers should always check whether all items still apply to the context they study. Although we believe that the core competencies and domains included in the item bank are sufficiently general to be relevant in the long-run, the fast-changing social media landscape potentially requires readjustment of individual items or even the addition of new risks or benefits of novel social media platforms or features.
Second, although the sample size provided enough information and statistical power for us to examine the item properties and validity, the survey was not conducted with a very large representative youth sample. Given the specific objectivity of Rasch models, however, the found item and person parameter should be independent of the sample (up to a linear transformation) and thus provide a good framework for assessing social media literacy even beyond the studied population. That said, we hope that future research will test the scale in larger, more diverse, and representative samples of youth.
Third, although the item bank and its respective scales showed good convergent (expected correlations with subjective social media literacy) and criterion validity (positive correlation with age as well as experience and frequency, and breadth of social media use), future research should test other, commonly found antecedents and outcomes of social media literacy, such as, e.g.,, type and strength of parental mediation (e.g., Daneels & Vanwynsberghe, Citation2017) or well-being (Schreurs & Vandenbosch, Citation2021).
Finally, the reliability of the specific domain scales was mostly acceptable, but suggested potential for improvement. Lower reliabilities were found in domains that covered a broader range of concepts and skills. This heterogeneity in items may be a cause for the lower reliability. As item and person fit (traditionally more central in IRT) were excellent, this is not a cause for concern, but an opportunity for improvement.
Conclusion
With this work, we developed a comprehensive inventory to assess youth social media literacy. It is unique in the limited pool of media literacy measures in that it is an objective, reliable, valid, and flexible inventory to be used with youth to specifically assess social media literacy in a variety of contexts. We validated versions with different lengths to make the inventory applicable to various research areas and projects. We hope the inventory will be used to further research the effectiveness of social media literacy education, and evaluate the success of efforts to maximize benefits while minimizing risks of social media use for youth.
Acknowledgments
We want to thank Yoon Choi, Victoria Baum, Eunice Han, and the Social Media Lab research assistants for their contributions to this project.
Disclosure statement
No potential conflict of interest was reported by the author(s).
Data availability statement
Please note that we do not share the original data publicly due to the sensitivity of the encoded information and the vulnerability of the population (young children). To ensure transparency, we nonetheless uploaded synthetic data (a data set with similar properties to the original data set) that can be used to reproduce the analyses (albeit with slightly different results). This data set, as well as code to reproduce the analyses and figures reported in this article are available at https://osf.io/h6jrp/.
Additional information
Funding
Notes on contributors
Amanda Purington Drake
Amanda Purington Drake, (PhD, Cornell University) is the Director of ACT for Youth within the Bronfenbrenner Center for Translational Research at Cornell University. She is also a research collaborator with the Social Media Lab at Cornell University. Professionally and academically, Amanda is passionate about using research and evaluation to promote the health and well-being of youth.
Philipp K. Masur
Philipp K. Masur, (PhD, University of Hohenheim) is an Assistant Professor in the Department of Communication Science at the Vrije Universiteit Amsterdam, The Netherlands. His research examines socio-psychological processes of online communication by combining traditional survey and experimental methods with computational approaches. He particularly focuses on privacy and self-disclosure processes, the role of media literacy in shaping online behavior, and social influence in online environments.
Natalie N. Bazarova
Natalie N. Bazarova, (PhD, Cornell University) is a professor of communication, social media, and human-computer interaction at Cornell University. Her research aims to advance knowledge of socio-psychological dynamics that underlie our digital lives and the ways in which technology impacts them, as well as to leverage these insights to create new interventions and solutions that promote digital literacy, privacy, and digital well-being in youth and other populations.
Wenting Zou
Wenting Zou, (PhD, University of Texas) is an Assistant Professor of Educational Psychology at The Pennsylvania State University. Her research focuses on using advanced computational methods to understand the cognitive, social, and affective processes in different online learning contexts. She also designs AI-supported personalized learning environments to address diverse learning needs.
Janis Whitlock
Janis Whitlock, (PhD, Cornell University) is an emerita research scientist at Cornell University. She is the founder and director of the Cornell research program on self-injury and recovery and currently works with youth serving professionals and systems to translate research into applicable knowledge in the areas of youth health and well-being.
Notes
1. e.g., see https://www.facebook.com/fbgetdigital/educators, https://beinternetawesome.withgoogle.com/en_us/educators, https://www.commonsense.org/education
2. We preregistered all hypotheses, sample size rationale and analysis plan prior to data collection: https://osf.io/w94nt/.
3. We also fitted a 2PL model and a bifactor model. The 2PL had a slightly better fit to the data, but overall fit was similar to the simpler Rasch model. The bifactor model showed a worse fit. All these additional analyses can be found on the OSF page.
References
- Anderson, M., & Jiang, J. (2018). Teens, social media and technology 2018. Pew Research Center. https://www.pewresearch.org/internet/2018/05/31/teens-social-media-technology-2018/
- Anderson, L. W., Krathwohl, D. R., Airasian, P. W., & Wittrock, M. C. (2001). A revision of bloom’s taxonomy of educational objectives. Addison Wesley Longman, Inc.
- Appel, M. (2012). Are heavy users of computer games and social media more computer literate? Computers & Education, 59(4), 1339–1349. https://doi.org/10.1016/j.compedu.2012.06.004
- Auxier, B., Anderson, M., & Kumar, M. (2019). 10 tech-related trends that shaped the decade. Pew Research Center. https://www.pewresearch.org/fact-tank/2019/12/20/10-tech-related-trends-that-shaped-the-decade/
- Bayer, J. B., Triệu, P., & Ellison, N. B. (2020). Social media elements, ecologies, and effects. Annual Review of Psychology, 71(1), 471–497. https://doi.org/10.1146/annurev-psych-010419-050944
- Best, P., Manktelow, R., & Taylor, B. (2014). Online communication, social media and adolescent wellbeing: A systematic narrative review. Children & Youth Services Review, 41, 27–36. https://doi.org/10.1016/j.childyouth.2014.03.001
- Bloom, B. S. (1956). Taxonomy of educational objectives. Vol. 1: Cognitive domain. McKay.
- Boekkooi-Timminga, E. (1990). The construction of parallel tests from IRT-based item banks. Journal of Educational Statistics, 15(2), 129. https://doi.org/10.3102/10769986015002129
- Bond, T. G., & Fox, C. F. (2007). Applying the rasch model: Fundamental measurement in the human sciences (2nd ed.). Routledge.
- Carlson, J. P., Vincent, L. H., Hardesty, D. M., & Bearden, W. O. (2009). Objective and subjective knowledge relationships: A quantitative analysis of consumer research findings. The Journal of Consumer Research, 35(5), 864–876. https://doi.org/10.1086/593688
- Carpenter, S. (2018). Ten Steps in scale development and reporting: A guide for researchers. Communication Methods and Measures, 12(1), 25–44. https://doi.org/10.1080/19312458.2017.1396583
- Chan, M., Lee, F. L. F., & Chen, H.-T. (2021). Examining the roles of multi-platform social media news use, engagement, and connections with news organizations and journalists on news literacy: A comparison of seven democracies. Digital Journalism, 9(5), 571–588. https://doi.org/10.1080/21670811.2021.1890168
- Chen, L. L., Mirpuri, S., Rao, N., & Law, N. (2021). Conceptualization and measurement of digital citizenship across disciplines. Educational Research Review, 33, 100379. https://doi.org/10.1016/j.edurev.2021.100379
- Cho, H., Cannon, J., Lopez, R., & Li, W. (2022). Social media literacy: A conceptual framework. New Media & Society. https://doi.org/10.1177/14614448211068530
- Craig, S. L., Eaton, A. D., McInroy, L. B., Leung, V. W. Y., & Krishnan, S. (2021). Can social media participation enhance LGBTQ+ youth well-being? Development of the social media benefits scale. Social Media + Society, 7(1), 2056305121988931. https://doi.org/10.1177/2056305121988931
- Daneels, R., & Vanwynsberghe, H. (2017). Mediating social media use: Connecting parents mediation strategies and social media literacy. Cyberpsychology: Journal of Psychosocial Research on Cyberpspace, 11(3), 5. https://doi.org/10.5817/CP2017-3-5
- DeMars, C. (2010). Item response theory. Oxford University Press.
- Erikson, E. H. (1950). Childhood and society. W W Norton & Co.
- Festl, R. (2021). Social media literacy and adolescent social online behavior in Germany. Journal of Children and Media, 15(2), 249–271. https://doi.org/10.1080/17482798.2020.1770110
- French, M., & Bazarova, N. N. (2017). Is anybody out there?: Understanding masspersonal communication through expectations for response across social media platforms. Journal of Computer-Mediated Communication, 22(6), 303–319. https://doi.org/10.1111/jcc4.12197
- Hobbs, R. (2010). Digital and media literacy: A plan of action. The Aspen Institute.
- Husek, T. R., & Sirotnik, K. (1967). Item Sampling in Educational Research. https://eric.ed.gov/?id=ED013975
- James, C., Weinstein, E., & Mendoza, K. (2021). Teaching digital citizens in today’s world: Research and insights behind the common sense K–12 Digital citizenship curriculum. (2 Version) Common Sense Media.
- Jones, L. M., & Mitchell, K. J. (2016). Defining and measuring youth digital citizenship. New Media & Society, 18(9), 2063–2079. https://doi.org/10.1177/1461444815577797
- Kincaid, J., Fishburne, R., Rogers, R., & Chissom, B. (1975). Derivation of new readability formulas (automated readability index, fog count and flesch reading ease formula) for navy enlisted personnel. Institute for Simulation and Training. https://stars.library.ucf.edu/istlibrary/56
- Kitchens, B., Johnson, S. L., & Gray, P. (2020). Understanding echo chambers and filter bubbles: The impact of social media on diversification and partisan shifts in news consumption. MIS Quarterly, 44(4), 1619–1649. https://doi.org/10.25300/MISQ/2020/16371
- Koc, M., & Barut, E. (2016). Development and validation of New Media Literacy Scale (NMLS) for university students. Computers in Human Behavior, 63, 834–843. https://doi.org/10.1016/j.chb.2016.06.035
- Kyriazos, T. A., & Stalikas, A. (2018). Applied psychometrics: The steps of scale development and standardization process. Psychology, 9(11), 2531–2560. https://doi.org/10.4236/psych.2018.911145
- Linacre, J. M. (2002). What do infit and outfit, mean-square and standardized mean? Rasch Measurement Transactions. https://www.rasch.org/rmt/rmt162f.htm
- Livingstone, S., Mascheroni, G., Ólafsson, K., & Haddon, L. (2014). Children’s online risks and opportunities: Comparative findings from EU kids online and net children go mobile. http://eprints.lse.ac.uk/60513/1/__lse.ac.uk_storage_LIBRARY_Secondary_libfile_shared_repository_Content_EU%20Kids%20Online_EU%20Kids%20Online-Children’s%20online%20risks_2014.pdf
- Livingstone, S., Mascheroni, G., & Staksrud, E. (2015). Developing a framework for researching children’s online risks and opportunities in Europe.
- Livingstone, S., & Stoilova, M. (2021). The 4Cs: Classifying online risk to children. CO:RE Short Report Series on Key Topics. https://doi.org/10.21241/SSOAR.71817
- O’Keeffe, G. S., Clarke-Pearson, K., & Council on Communications and Media. (2011). The impact of social media on children, adolescents, and families. Pediatrics, 127(4), 800–804.
- Orenstein, G. A., & Lewis, L. (2021). Erikson’s stages of psychosocial development. StatPearls, StatPearls Publishing. http://www.ncbi.nlm.nih.gov/books/NBK556096/
- Piaget, J. (1964). Cognitive development in children. Journal of Research in Science Teaching, 2(3), 176–186. https://doi.org/10.1002/tea.3660020306
- Potter, W. J. (2010). The state of media literacy. Journal of Broadcasting & Electronic Media, 54(4), 675–696. https://doi.org/10.1080/08838151.2011.521462
- Powers, K. L., Brodsky, J. E., Blumberg, F. C., & Brooks, P. J. (2018). Creating developmentally-appropriate measures of media literacy for adolescents. In Proceedings of the Technology, Mind, and Society, 1–5. https://doi.org/10.1145/3183654.3183670
- Reid, D., & Weigle, P. (2014). Social media use among adolescents: Benefits and risks. Adolescent Psychiatry, 4(2), 73–80. https://doi.org/10.2174/221067660402140709115810
- Schreurs, L., & Vandenbosch, L. (2021). Introducing the Social Media Literacy (SMILE) model with the case of the positivity bias on social media. Journal of Children and Media, 15(3), 320–337. https://doi.org/10.1080/17482798.2020.1809481
- Spohr, D. (2017). Fake news and ideological polarization: Filter bubbles and selective exposure on social media. Business Information Review, 34(3), 150–160. https://doi.org/10.1177/0266382117722446
- Third, A., Lala, G., Diniz De Oliveira, J., Bellerose, D., & Theakstone, G. (2017). Young and online: Children’s perspectives on life in the digital age (State of the World’s Children 2017 companion report). https://doi.org/10.4225/35/5A1B885F6D4DB
- Thissen, D., & Orlando, M. (2001). Item response theory for items scored in two categories. In Thissen, D., Wainer, H. (Eds.) Test Scoring (pp. 73–140). Lawrence Erlbaum Associates Publishers.
- Uhls, Y. T., Ellison, N. B., & Subrahmanyam, K. (2017). Benefits and costs of social media in adolescence. Pediatrics, 140(Supplement 2), S67–S70. https://doi.org/10.1542/peds.2016-1758E
- Vogels, E. A. (2019). Millennials stand out for their technology use, but older generations also embrace digital life. Pew Research Center. https://www.pewresearch.org/fact-tank/2019/09/09/us-generations-technology-use/
- Xiao, X., Su, Y., & Lee, D. K. L. (2021). Who consumes new media content more wisely? Examining personality factors, SNS use, and new media literacy in the era of misinformation. Social Media + Society, 7(1), 1–12. https://doi.org/10.1177/2056305121990635
- Yildiz Durak, H., & Seferoğlu, S. S. (2020). Antecedents of social media usage status: Examination of predictiveness of digital literacy, academic performance, and fear of missing out variables. Social Science Quarterly, 101(3), 1056–1074. https://doi.org/10.1111/ssqu.12790