Abstract
Purpose
To determine the prevalence and severity of manual wheelchair rear wheel misalignment in community-dwelling manual wheelchair users and estimate the associated increases in rolling resistance (RR) and risk of repetitive strain injuries (RSIs).
Materials and Methods
Data were collected in an outpatient rehabilitation clinic, a university research laboratory, and at adaptive sporting events in the United States. Two hundred active, self-propelling manual wheelchair users were recruited. Angular misalignment (referred to as toe angle) while the wheelchair was loaded with the user, and the difference between the maximum and minimum toe angle (referred to as slop) with the wheelchair unloaded.
Results
Average results for toe angle and slop (movement in the rear wheels) were 0.92 and 0.61 degrees, respectively. Using a lab-based testing method, we quantified the impact of increased RR forces due to misalignment in increased RR forces. Our results indicate that the average toe angle while under load and slop, without loading, measured in the community increase required propulsion force by 3.0 N. Combined toe angle and slop (i.e., the worst-case scenario) added increased propulsion force by 3.9 N.
Conclusions
We found that rear-wheel misalignment was prevalent and severe enough that it may increase the risk for RSIs and decrease participation. To mitigate this issue, future work should focus on reducing misalignment through improved maintenance interventions and increased manufacturing quality through more stringent standards.
The work reveals a previously unknown and significant contributor to RR that could have health implications for users who self-propel.
Maintenance and repairs should be adjusted to help reduce the impact of misalignment.
Our results suggests that WC designers should take additional care to designs wheels and frames to minimize misalignment.
Service providers setting up wheelchairs should take additional care to make sure the wheels are aligned.
Users should monitor misalignment and prioritize maintaining or having their chair repaired when misalignment occurs.
Implications for Rehabilitation
Keywords:
Introduction
Worldwide there are approximately 75 million people with a disability that requires the use of a wheelchair with an estimated 3.2 million in the United States. There are 250 000 individuals with spinal cord injuries using manual wheelchairs (MWCs) in the United States [Citation1]. MWC use is associated with an increased risk for repetitive strain injuries (RSIs) in upper extremities (UE) including shoulders, wrist and hands. Increased propulsion forces are associated with increased pain or RSI for manual wheelchair users (MWUs) and reducing the forces are one of the goals of common interventions including adjusting the wheelchair setup and training users to propel with certain stroke-styles [Citation1–3]. For MWUs, UE injuries, such as rotator cuff injuries, can pose significant hardship from reduced activity and challenges associated with activities of daily living, especially if surgical repair is required. Higher rolling resistance (RR) forces and high frequency use are risk factors for pain as well as potential RSIs as a result of increased propulsion forces or continued use of MWCs.
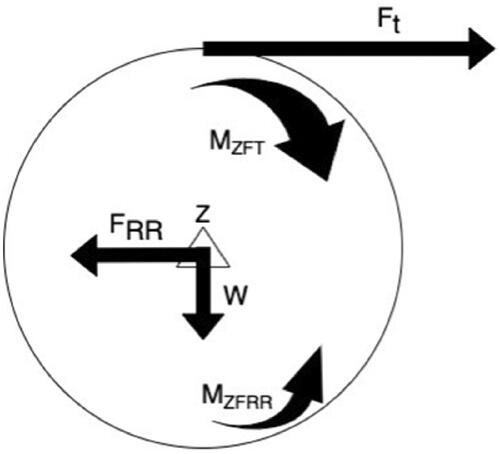
Factors that contribute to increased propulsion forces impact MWUs’ propulsion and have been an area of research and testing to improve understanding and clinical recommendations. RR is the primary resistive force to propulsion [Citation4]. An illustration of the forces of propulsion and RR is shown in . Ft is the tangential force from propelling and FRR is the RR force that opposes propulsion. RR forces are primarily from inelastic hysteresis and energy loss from the tire, which induces the moment MZFRR and therefore incites the RR Force [Citation4]. Many factors affect the energy dissipation of the wheel in the form of RR force, in terms of angle of the wheel (toe angles), load, tire type, tire pressure and surfaces being propelled upon.
Figure 1. RR free body diagram where Ft is the tangential force, V is the angular velocity and W is the load on the axle, FRR is the RR force, MZFT is the moment due to the tangential force, MZFRR is the moment inducing the RR force.
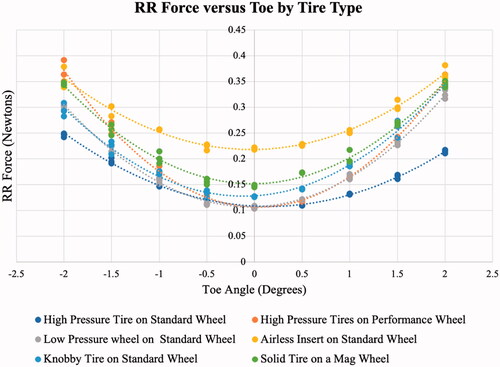
Testing shows that RR forces increase non-linearly with increased toe angle (measured in degrees while the MWC is under load) as shown in , whereas weight and RR increase linearly [Citation5,Citation6]. This non-linear relationship underscores the importance of evaluating the prevalence and severity of toe angle and slop that contributes to increased toe angle in MWCs.
Figure 2. RR force versus toe angle for rear wheels.
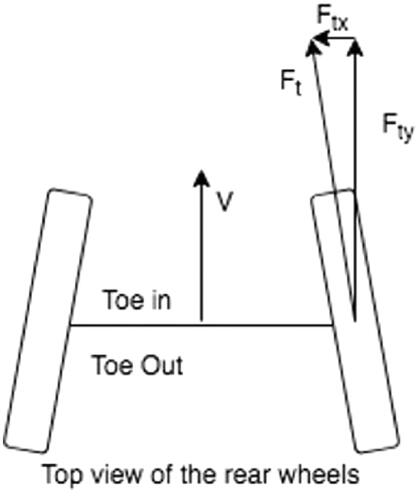
Misalignment of rear wheels includes toe angle, a lack of parallel alignment of the wheels, and slop (maximum toe angle minus minimum toe angle), which is tolerances in the axle, wheel, or hub connection measured when the device is unloaded. Toe angle manifests as either in or out, as illustrated in . Slop and toe angle can combine together, which can significantly increase RR or cancel one another.
Figure 3. Toe angle free body diagram, V is velocity, Ft is the tangential force, Ftx is the tangential component in the x direction, Fty is the tangential component in the y direction.
Based on our literature review, the prevalence and severity of rear wheel misalignment (toe-in/toe-out) has not studied extensively. We identified only one conference abstract on the topic which measured misalignment of 50 wheelchairs in Kenya. The authors reported an average of 0.2 degrees of misalignment, with over 53% of the wheelchairs having more than 0.5 degrees of misalignment and 24% with greater than 1-degree of misalignment [Citation5]. Other published studies reported RR force increases due to misalignment in lab-based tests [Citation5,Citation7,Citation8], but did not confirm whether it was prevalent in the community.
This research study determines the prevalence and severity of toe-in/out misalignment and slop of rear-wheelchair wheels in the community. In order to accomplish this, we aimed to (1) develop a rigorous testing method to measure rear wheel misalignment, (2) measure misalignment of the rear wheels of wheelchairs used by community-dwelling and self-propelling individuals and (3) determine which factors are predictors of toe angle or slop.
Methods
The research study was completed in two stages which include design and fabrication of a testing system (Stage 1) and collecting data on the rear-wheel misalignment of community-dwelling MWUs (Stage 2).
Stage 1 device development
We iteratively designed and developed a measurement system to measure the misalignment of the rear wheels of MWCs in the community. The conceptual design was developed through team discussions, the specifications outlined in were developed. Specifications were determined in order to accommodate as many MWUs as possible, as well as to minimize unnecessary risk during testing.
Table 1. Design specifications.
Stage 2 community data collection
Recruitment
The study was submitted for institutional review board approval (IRB #PRO12080311) and found exempt since no personally identifiable information was being collected and there were minimal risks associated with the measurement procedure. Participants were recruited by the primary author via flyers and web-based postings and approached at adaptive sporting events such as wheelchair basketball practice, wheelchair sports competitions, fundraising events and wheelchair maintenance events. The targeted participants for this research were MWUs who self-propelled their wheelchairs and used them as their primary means of mobility for at least 5 days per week.
Data collection
Descriptive information about the wheelchair and their usage habits were collected including device manufacturer, device model, age of the device, days used per week, hours used per day, tire manufacturer, tire model, tire maximum inflation pressure, tire diameter and wheel type. Tire pressure was measured for the final 50 participants using a digital tire pressure gauge. Misalignment was collected through the following sequence of steps: (list the methods to collect and record the misalignment, including measuring under load, lifting participants off the ground, applying nominal forces inward and outward and measuring at under each load condition. Further details on the collection procedure can be found in Appendix A. Participants were also compensated with a $5 gift card for their time. Study inclusion criteria and data collection methods are summarized in Appendix A.
Data analysis
Because there is no previous literature to reference for an effect size, we used a guideline of 15 participants per predictor. With nine predictors (), a minimum of 135 participants is required. The study participant goal was set to 200 based on the original ten predictors and an overestimation to account for missing data. Additionally, the power analysis for regression with an alpha level of 0.05 and 80% power was calculated and showed that there is a 0.085 effect size with ten predictors and 200 samples. G*Power was used for this calculation [Citation9]. The effect size is considered small to medium for a regression.
In order to conduct the analysis, the was grouped (by the primary author) in a logical approach that was guided by a clinician seating therapist, a rehab engineer and an industry expert based on the results of the study. Groupings were largely based on the diversity of the responses in order to ensure large enough subgroups for statistical analysis. Device make was grouped by manufacturer, and any device make with less than nine responses per manufacturer were grouped as other. The Medicare K code was used to group devices by style for statistical analysis. A large number of custom rigid frame devices or former K0009 and a small number of ultralight devices were seen with K0005 codes. Tire type was broken into four categories including high-pressure pneumatic (689 kPa and over), low-pressure pneumatic (under 689 kPa), solid or airless inserts and a group of unknowns. Tires were also broken down by manufacturer in a similar fashion to device make. Wheel type classified some models as performance due to stronger materials used for construction and enhanced engineering as compared to a standard lite-spoke wheel with additional categories of solid and other.
For statistical analysis, each of the nine predictors from was plotted against toe angle and slop, respectively. A non-parametric data analysis approach was employed due to a positively skewed, non-normal distribution in both toe angle and slop. Nine Kruskal Wallace tests were run using SPSS with each predictor and both toe angle and slop as dependent variables [Citation10].
Results
Measurement device
The research approach to develop a device was followed in accordance with the design specifications outlined in . The details of the development of the measurement device are included in Appendix B.
Recruitment
Two hundred participants were recruited over the course of approximately 2 months, mainly at adaptive sporting events, where sizable gatherings of MWUs-enabled measurement of many devices before and after matches. shows the breakdown of how the participants were recruited. Given the nature of community recruitment, some information was not obtainable based on the MWUs’ knowledge or a lack of labelling on the MWC. The oversampling of participants was to ensure that this would not affect the data analysis.
Table 2. Manual wheelchair community-based study recruitment.
Data
Six wheelchairs manufacturers are represented in the data set () as well as 45 unique models. Manufacturer A comprised almost half of all the devices measured.
Table 3. Manual wheelchair community-based study manufacturers.
The wheelchairs fall into two unique Medicare K codes, and an “other category” which was used for statistical analysis ().
Table 4. Manual wheelchair community-based study K codes.
The age of the wheelchairs spanned from <1 year old, to >4 years old with most of them being in the older category ().
Table 5. Manual wheelchair community-based study age.
shows that 75% of the participants were active users, in their device over 10 h a day and over 5 days a week. Additionally, over 96% of participants identified as self-propelling.
Table 6. Manual wheelchair community-based study use data.
Roughly half of the participants were using a high-pressure tire as shown in . Additionally, two tire manufacturers account for 75% of the tires observed ().
Table 7. Manual wheelchair community-based study tire types.
Table 8. Manual wheelchair community-based study tire manufacturers.
Overall, 61 cm (24 inch) wheels were the most common followed by 63.5 cm (25 inch), as seen in . shows that a large portion of MWUs have performance wheels. Lite-spoke wheels were the second most common wheel type.
Table 9. Manual wheelchair community-based study wheel diameter.
Table 10. Manual wheelchair community-based study wheel type.
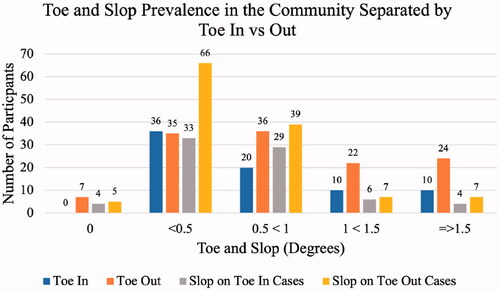
The average amount of toe angle was 9.06 mm or 0.92 degrees with the more common direction being toe-out for 62% of participants. Additionally, slop was an average of 5.98 mm or 0.61 degrees. A break down in the results are shown . Out of the last 50 participants, 29 had pneumatic tires and 21 had solid or airless inserts. The average tire inflation pressure was 40% calculated by the result of the digital tire pressure gauge measurement averaged across both rear-wheels compared to sidewall labelled maximum inflation pressure for the last 50 participants.
Figure 4. Toe angle and slop prevalence in the community.
Statistical analysis
The graphical analysis did not provide detailed insight into the data but did identify outliers. No predictor was shown to be statistically significant (p < 0.05) in relation to toe angle, but two were significant predictors of slop, which included tire manufacturer (; ) and wheel diameter (Chi square = 12.80, p = 0.03, df = 5 and Chi square = 8.94, p = 0.30, df = 3). Pairwise comparisons were conducted post-hoc with a Bonferroni adjustment and found the tire manufacturer D was significantly lower in slop than manufacturer E (p = 0.02). These results should be interpreted cautiously because of the relatively small numbers of wheelchairs from Manufacturers D (8) and E (6).
Figure 5. Tire manufacturer versus slop.
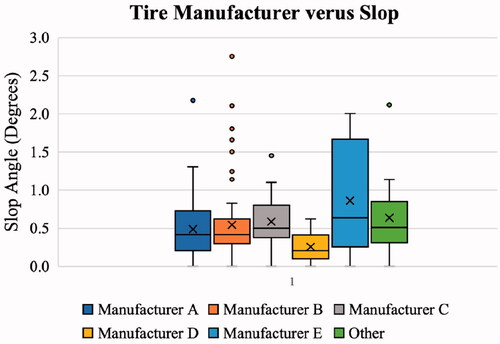
Table 11. Slop across each tire manufacturer.
The pairwise comparisons for wheel diameter show that the 56 cm (22 inch) wheels are significantly higher in slop compared to 61 cm (24 inch) wheels (p = 0.02), with the 61 cm (24 inch) grouping dominating the sample. and show the graphical representation and descriptive statistics from wheel diameter groupings.
Figure 6. Wheel diameter versus slop.
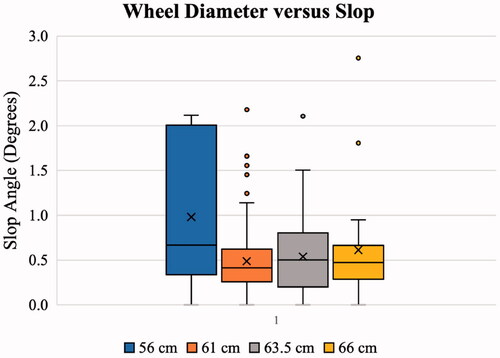
Table 12. Wheel diameter versus slop.
Discussion
This community-based study identified the prevalence and severity of MWC rear wheel misalignment and its relationship to wheelchair factors. We found that misalignment is prevalent, and that 61% (122) of the wheelchairs measured had misalignment while loaded of greater than 0.5 degrees. Misalignment of greater than 0.5 degrees is associated with a significant increase of RR that could increase MWUs risk of UE RSIs. Toe angle provides no benefit to the user when propelling and only adds to RR, therefore increasing the required propulsion force for the MWU to move their wheelchair. It is likely that slop leads to increased toe angle RR in a cumulative manner with toe angle. This is an ever-present issue that would not resolve itself and can only get worse over time due to increased slop or reduced tire pressure. Tire pressure can be easily mitigated with routine checks [Citation11]. Furthermore, this sample represented active users, with the majority using their devices more than 5 days per week for over 10 h per day. Importantly, because these participants are highly active, the increase in RR forces associated with misalignment may disproportionately increase their risk of UE RSI [Citation6].
To convey the impact of toe angle on RR, the loading equation was used to back calculate the perceived weight equivalent added to the rear axle of a device and is shown in . Reduced tire pressure at 40% of maximum is equivalent to putting a 9-kg weight on the MWUs’ lap and having them propel around in that state all the time. While toe angle and slop may not independently lead to a significant increase in RR, when they are combined into a worst-case alignment scenario, the equivalent weight is 21 kg. Additionally, drum-based testing has shown that the factors act in a cumulative manner if more than one factor is present. Therefore, the absolute worst-case scenario is toe angle + slop + tire pressure + camber for an approximation of combined perceived weight equivalent of 33.6 kg (FRR increase of 2.3 N from a standard condition of 2.1 N). That would be a significant addition to most MWUs, and that is the current reality for MWCs in the community.
Table 13. Average results from the community-based study.
An important result of this work is to provide information for rehabilitation engineers and clinicians and to improve education, guidelines and standards for wheelchairs. The novel test rig is the only one that exists and therefore could lead to becoming the gold standard measurement of misalignment in MWCs. Currently, this is the only study to measure the misalignment of MWC wheels in a United States community that we are aware of. End-users, manufacturers, clinicians and service providers need to be aware of these issues, the prevalence of toe angle, slop and tire underinflation in MWCs. Manufacturers need to ensure they are supplying quality MWCs, where axle tubes are properly aligned, and frames are square. Wheels should also be trued from the factory. During the setup and final fitting of device issuance, care should be taken not to induce toe angle into the rear wheels. This can be incited due to a camber tube being rotated forward or backward, a change in seat dump, or a change in caster diameter. End-users and providers need to be vigilant of maintenance issues related to age and use of the device such as worn bearings or axles, wheels out of true and other maintenance issues including underinflated tires. In most cases, it is not recommended to switch to a solid or airless insert because they have a higher RR than severely under inflated pneumatic tire [Citation12].
Limitations
There are a few limitations to note from this study, which include the questionnaire, the novel test rig, the adjustments over the course of data collection, static conditions measurements, results groupings, and that it is a convenience sample. For the results groupings, a team approach was employed to ensure they were grouped in a logical manner, but others may have differing opinions on this approach. This was also a convenience sample of those at adapting sporting events that wanted to participate. While the sample size was relatively large, it may not be representative of a cross-section of the MWU population.
Future work
Accompanying future testing, future work should include development of a standard or threshold of compliance of misalignment. Toe angle measurements could be implemented into durability testing by strengthening MWC standards to include rear-wheel alignment testing. Additionally, toe needs to be measured under dynamic scenarios to have a more comprehensive understanding of how it effects propulsion. Other options to mitigate this issue is to check toe angle and slop over time, which would require the development of a low-cost test jig that can be easily used in clinics or by providers and a common adjustment mechanism for toe angle or slop on MWCs. One area that could be improved would be expanding the tire pressure data collection because it was only captured on 50 participants (25% of the total population). Another comparison that would strengthen the knowledge base is the measurement of propulsion forces when toe angle or slop are introduced to compare to the measured resistive vales. Continuation of this research could help increase the ability to group predictors and be able to find statistically significant predictors. Furthermore, attention to maintenance issues and methods of adjustment need to be developed and implemented. Further study of the prevalence of tire underinflation levels would be valuable to expand the data available. Improvements to the ease of measuring tire pressure and inflating tires for MWUs would also be valuable based on our results. There is also potential future work to understand toe angle and slop prevalence and severity differences in developed versus developing countries, and for other demographic and geographic considerations.
Acknowledgments
The results of this work are due in part to the dedicated work of many people and a very genuine thank you to the many individuals who assisted. A sincere thank you the research team that sacrificed numerous weekends to assist with subject recruitment and data collection. Thank you also to our clinical coordinator, Megan Robertson, for her assistance with IRB submission and survey tool development, and to co-ops, Travis Henderson and Holly Wilson-Jene, who assisted with many aspects of this research, and for administrative assistance from Kimberly Robinson with coordinating and handling many details related to this study. Thank you to all the organizations that allowed us to conduct our research study at many adaptive sporting events and other facilities and programs. Thank you also to participants, who graciously participated by answering questions and allowing us to take measurements of their MWC. It is a sincere hope that this research will benefit these participants and many others in the future. The International Society of Wheelchair Professionals Standards Working Group (ISWP-SWG) has provided significant support from the inception to completion of this research. Their advice, guidance and support are greatly appreciated. Thank you also to the Human Engineering Research Laboratories (HERL), and many individuals at HERL for their input and support, as well as facilities to fabricate and build equipment utilized in this research.
Disclosure statement
No potential conflict of interest was reported by the author(s).
Additional information
Funding
References
- Curtis KA, Drysdale GA, Lanza RD, et al. Shoulder pain in wheelchair users with tetraplegia and paraplegia. Arch Phys Med Rehabil. 1999;80:453–457.
- Boninger ML, Souza AL, Cooper RA, et al. Propulsion patterns and pushrim biomechanics in manual wheelchair propulsion. Arch Phys Med Rehabil. 2002;83:718–723.
- Medicine CFSC. Preservation of upper limb function following spinal cord injury: a clinical practice guideline for health-care professionals. J Spinal Cord Med. 2005;28:434–470.
- Kauzlarich JJ, Thacker JG. Wheelchair tire rolling resistance and fatigue. J Rehabil Res Dev. 1985;22:25–41.
- VanderWiel J, Harris B, Jackson C, et al. Exploring the relationship of rolling resistance and misalignment angle in wheelchair rear wheels. Arlington (VA): RESNA; 2016. p. 12.
- Ott J, Wilson-Jene H, Koontz A, et al. Evaluation of rolling resistance in manual wheelchair wheels and casters using drum-based testing. Disabil Rehabil Assist Technol. 2020.
- Silva L, Dedini F, Corrêa F, et al. Measurement of wheelchair contact force with a low cost bench test. Med Eng Phys. 2016;38:163–170.
- McLaurin CA, Brubaker CE. Biomechanics and the wheelchair. Prosthet Orthot Int. 1991;15:24–37.
- Faul F, Erdfelder E, Buchner A, et al. Statistical power analyses using G*Power 3.1: tests for correlation and regression analyses. Behav Res Methods. 2009;41:1149–1160.
- SPSS. IBM SPSS statistics for Mac, version 24.0. 2018.
- Hernandez MLT. Development, implementation, and dissemination of a wheelchair maintenance training program [dissertation]. University of Pittsburgh; 2015.
- Sawatzky BJ, Kim WO, Denison I. The ergonomics of different tyres and tyre pressure during wheelchair propulsion. Ergonomics. 2004;47:1475–1483.
- Kobo Toolbox. 2019. Available from: https://kobo.humanitarianresponse.info
- Qualtrics Offline Survey App. 2019. Available from: https://www.qualtrics.com
- Banner Engineering Q4X: Laser distance sensor range: 25 TO 300MM (94118). 2020. Available from: https://www.bannerengineering.com/us/en/products/part.94118.html
Appendix A. Study inclusion criteria and data collection methods
The inclusion criteria were identified as being a MWU 18 years old or older with a weight under 136 kg, and the wheelchair width between 35 and 81 cm. The age requirement was set because an IRB would be required for users under 18. A 136 kg user weight was identified because most manual devices (non-bariatric) have a max capacity of 113 or 136 kg. The lifting devices are rated at 500 kg each, providing an adequate factor of safety. The device-width criteria were based on the design of the laser system and its capabilities relative to distance that it can accurately measure. It is able to accommodate any wheelchair that can fit through a standard doorway of 81 cm, and the smallest a device can be is 35 cm wide.
Data collection procedure
MWC device specifications were recorded and input into a Kobo Toolbox form using a tablet and offline data collection capabilities [Citation13]. The first 25 participants were collected with the Kobo form, but the study transitioned to Qualtrics to use their offline survey app [Citation14]. Qualtrics also provided the ability to insert instructions into the collection form and was easier to use for researchers. Training was provided in-person to all researchers who assisted with data collection, and a training manual and video were available. The questionnaire included both device and user information, as well as measuring and recording the diameter of the wheel rim and caster. A detailed list of the information collected about the user’s wheelchair and their activity levels is shown in . Based on our observations that tires were commonly underinflated we began measuring tire-pressure with a handheld digital tire gauge after data collection had begun.
Table A1. Device information to be collected.
The data was collected in two-person teams, where one researcher prompted the user with questions from the tablet, and a second researcher measured the tires, casters, tire pressure, and identified the type of tires and wheels. Due to an error on the tablet, three trials were lost. Researchers continued the trial till 200 participants were recorded. The first researcher, with the tablet, proceeded through the device specifications questions to input all the information obtained. The second researcher guided the wheelchair user to a standard area, where the slope of the floor was measured and recorded to adjust the camber measurements. The measurements were collected in the following order:
The laser device was moved to the axle area of the MWC.
Both lasers were adjusted vertically to the center of the axle.
The system was moved to the front of the rear-wheels and was adjusted so the laser light was visually seen on the edge of each rim, directly adjacent to the tire.
The measurements were recorded for both the left and right side.
The laser device was moved to the backside of the rear-wheels and was again adjusted so the laser light was visually seen on the edge of each rim.
The measurements were recorded for both the left and right side.
The lifting device was then placed under the wheelchair and lifted the user, so the rear tires were approximately one-quarter of an inch off of the ground.
A force of 8.9 N (2 lbf) (from two constant force springs rated at about 4.4 N (1 lbf) each) was applied to the inside of the rear-wheels, as shown in .
The measurements were recorded for both the left and right side.
The applied force was moved to the outside of the wheels.
The measurements were recorded for both the left and right side.
The force springs were removed, and the lifting device was lowered.
Appendix B. Measurement device development
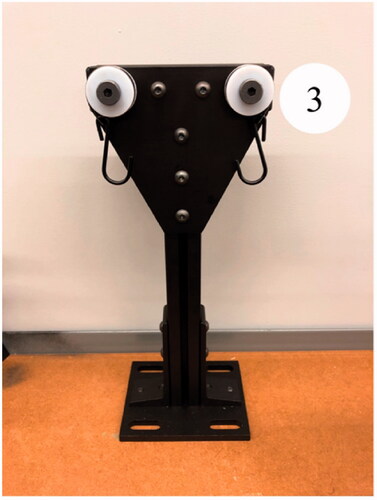
A search was conducted to evaluate methods to measure 1.5 mm reliably to detect misalignment of the rear-wheels. Mechanical measurement devices, such as Vernier calipers, were initially examined but ultimately ruled out because contact with the device could not ensure consistency in the results if slop was present in the system. Ultimately, a pair of model Q4X lasers based on their 300 mm range and 1 mm repeatability [Citation15]. A rigid frame for mounting the laser measuring system, a tensioning mechanism for applying constant force and a lift mechanism for unloading the rear-wheels were developed. For the rigid frame, extruded aluminum was chosen because it is lightweight and can provide torsional rigidity if the proper sizing is used. Furthermore, linear slides accompany the extruded tubing to enable quick adjustments and provide an easy means to mount the lasers with height adjustability. shows the final device for laser measurement.
To be able to apply a constant force to the rear-wheels, the device needs to be lifted. A set of simple motorcycle jacks were employed, and the tops were covered with rubber to prevent any damage to MWCs. Once the MWC was safely lifted, the constant force application was applied with the use of 4.4 N constant force springs mounted on a spacer spool, allowing extension and retraction of the force spring, with a rubber-dipped hook affixed to the end, as shown in . The constant force springs used to apply a nominal force while simulating a toe-in scenario and were able to mount to the same linear slides that the lasers were mounted to.
The tensioning mechanism for simulating a toe-out scenario was the third piece of the system developed. This consisted of a piece of extruded aluminum with the two constant force springs mounted near the top, which provides tension for the slop measurement for a toe-out scenario and can be seen in .
Figure A1. Measurement Device in Operation. Arrow represents applied force from force spring.
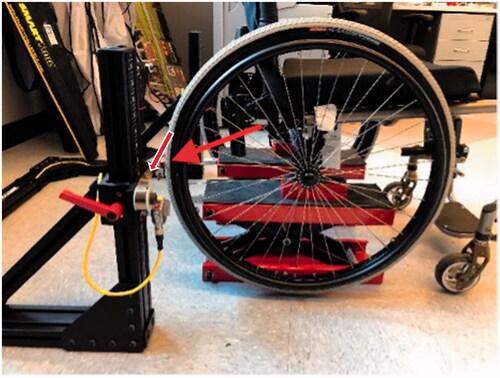
Figure B1. Laser measurement frame. (1) Frame, (2) linear slide, (3) spring with hook, (4) laser.
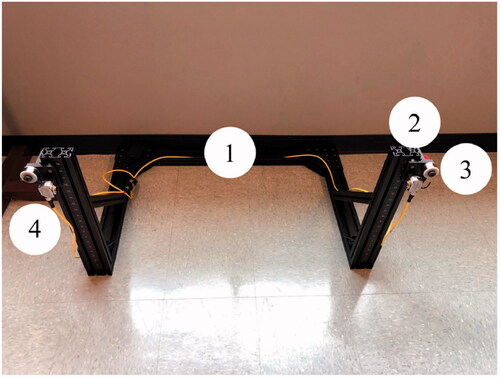
Figure B2. Rear View of Slop Measurements (3) Spring with Hook, (5) Jack.
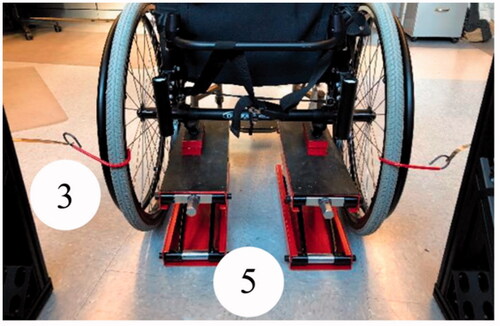
Figure B3. Toe-out Slop Tensioner. (3) Spring with Hook.