
Abstract
Purpose
Global population growth and increasing longevity means that the need for Assistive Technology (AT) will continue to increase. The level of unmet need for AT is greatest in low-income settings. The aim of this study is to identify age-related increase in impairment and to estimate the AT needs.
Materials and Methods
We analysed secondary data from the 2018 Malawi Population and Housing Census (MPHC) based on the Washington Group on Disability Statistics (WG) short-set of questions.
Results
Out of the 1,556,670 persons with one or more functional limitations or disabilities identified in the census, self-reported difficulties in all domains were markedly higher from age 40 and above. The proportion reporting one functional limitation is higher compared to two or more limitations, but at age 78–80 the proportion reporting two or more functional limitations increased above those reporting one functional limitation. Although 60.9% (60.7–61.0) and 63.5% (63.3–63.6) of those who reported difficulty in seeing and hearing were using glasses and hearing aids respectively, the estimated total need for glasses and hearing aids in this group was 98.9% (98.0–99.0) and 98.4% (98.3–98.5) respectively. The unmet need for glasses and hearing aids were therefore 38.1% and 34.9% respectively.
Conclusion
The differential slope of impairment curves against age is a guide to the increasing demand for AT across the life course and across different domains of functioning. Country specific analysis of impairment across age and domains is essential to understand and plan for the growing need for AT globally.
It is important to estimate and plan for impairment across life course to address the age-related increase in impairment and the increasing need for AT with age.
The Zomba curves show the cumulative nature of impairment with age and the need for age and need specific provision of AT across the life course through proactive policy level actions.
The significant high unmet need for glasses and hearing aids attests to similar need for other assistive products and the need for setting specific interventions to address needs of affected persons.
The differential slope of impairment curves against age is a guide to the differing and increasing demand for assistive technology across the life course and across different domains of functioning
IMPLICATIONS FOR REHABILITATION
Introduction
It is estimated that by 2050, about two billion people globally will have need for some type of assistive product (AP) [Citation1]. An assistive product “is any product (including devices, equipment, instruments, and software), either specially designed and produced or generally available, whose primary purpose is to maintain or improve an individual’s functioning and independence and thereby promote their wellbeing”. Assistive technology (AT) is “the development and application of organized knowledge, skills, procedures, and policies relevant to the provision, use, and assessment of Aps” [Citation2].
Globally, only 1 in 10 of individuals that need AT have access to it [Citation1,Citation3]. Several factors such as increasing population, living longer with chronic conditions and increasing longevity means that the need for AT will continue to increase. APs such as wheelchairs, spectacles, hearing aids, prosthetic and orthotic devices are relevant for maintaining function and reducing the impact of impairments associated with disability and ageing [Citation1,Citation3]. These products are not only for persons with disabilities or with functional limitations associated with ageing but may also be relevant for people of all ages to undertake some activities of daily living [Citation4]. According to the World Health Organization (WHO), access to rehabilitation, AT, and inclusive environments can improve functional ability [Citation5] and critical to achieving universal health coverage [Citation6].
The WHO baseline Report for the Decade of Healthy Ageing 2021 − 2030 suggests that about 142 million older persons are unable to meet their daily needs and proposes improving functioning as a pathway to healthy ageing [Citation5]. In order to achieve healthy ageing, a life course approach is important [Citation4,Citation7]. A life course approach to health “provides a holistic view of people’s health and well-being at all ages, and interlinkages with sustainable development” [Citation7]. Also, a life-course approach offers an opportunity to estimate future functional and health needs based on the present health pattern in a specific socio-environmental context [Citation7]. The United Nations Convention on the Rights of Persons with Disabilities (UNCRPD) and the Sustainable development Goals (SDGs) provide a framework for appropriate health policy and planning to meet the needs of people in communities, especially persons with disabilities and other vulnerable population [Citation8,Citation9]. Article 25 of the UNCRPD emphasizes the right of persons with disability to achieve the highest standard of healthcare [Citation9] while Target 3.8 of the SDGs is the achievement of universal health coverage for all, including access to essential quality and affordable health services for all [Citation8]. A life-course approach to the SDGs requires consideration of the need for AT in order to achieve them in an inclusive and equitable manner [Citation10].
Comprehensive and population level health data offers this opportunity to estimate health needs [Citation11–13]. It provides opportunity to use representative and comparable data to estimate future health needs of the population. In the area of AT, studies support this practical approach. For instance, Mactaggart et al. utilized population-based surveys in India and Cameroon to measure the interrelationship between clinical impairments and reported functional limitations [Citation12]. Similarly, Boggs et al. used population-based surveys to estimate AT needs in Cameroon and India [Citation11]. Out of the four identified approaches (single question, self-report, clinical impairment assessment and indirect method) for estimating AT need in population surveys, self-reporting using the Washington Group (WG) on Disability Statistics short set of questions provides a brief and economical means of obtaining needed data [Citation11,Citation14].
The WG set of questions consist of six questions on functioning (vision, hearing, mobility, cognition(memory), self-care and communication) that are used in national censuses and surveys. They were developed by the WG and utilized the WHO International Classification of Functioning, Disability, and Health (ICF) as a framework. In low- and middle-income countries with paucity of metrics to estimate health needs, population-based surveys provide a useful opportunity to understand and estimate the AT needs of persons in communities [Citation11,Citation15]. As AT moves closer to population health and population science ethos, rather than a purely rehabilitative ethos, the need for population-level data is becoming more apparent [Citation3]. Population-level data across the life-course will help us understand shifting demographics that need to be addressed at the level of national AT provision [Citation4,Citation11].
The high unmet need for AT in Malawi has been previously documented [Citation15–18]. Also, the dramatic increase in life expectancy in Malawi in the last 20 years (an increase of almost one year for every year in the last two decades in Malawi) means that there is an accelerating growth in ageing in the country. It is estimated that life expectancy in Malawi will be about 73 years by 2050 [Citation19]. This rate of increase requires urgent and strategic health, social systems and policy changes. According to the WHO, most determinants of healthy ageing can be shaped by policy [Citation5]. The aim of this study is to measure age related increase in impairment and estimate the AT needs in Malawi both now and in the years ahead. This study is important as it provides a template for other countries to adapt for use and also contributes to the overall objectives of the Assistive Product List Implementation Creating Enablement of inclusive SDGs (APPLICABLE) project [Citation16] which seeks to build and support the AT ecosystem in Malawi.
Methods
Data
This study is an analysis of data from the 2018 Malawi Population and Housing Census (MPHC) collected by the National Statistical Office (NSO) in Malawi. The head office of the NSO is in Zomba, Malawi. The 2018 MPHC data was collected to provide population data that will be used for policy formulation, targeting of resources and monitoring and evaluation of the third Malawi Growth and Development Strategy (MGDS III) and the Sustainable Development Goals (SDGs) [Citation20]. Regarding data on disability or functional limitation, this data was collected by the NSO using the WG short set of questions [Citation14]. The information collected included difficulty in seeing, walking or climbing steps, speaking, hearing, self-care, difficulty learning new things or solving problems or remembering. More than a million and half (1,556,670) of the 15,011,343 censured population (aged five years or more) reported to have some difficulty in one or more of the six health domains. Thus 10.4% of people aged 5 years and above reported to have some difficulty, which is widely recognized as the most appropriate measure of disability.
Study variables
The dependent variables in this study include difficulties in seeing, walking or climbing steps, hearing, self-care, speaking, and difficulty in difficulty learning new things or solving problems or remembering. During the 2018 MPHC, the household head was asked to report if any member of the household had difficulties in any of the six health domains. The questions used in the census questionnaire were adapted from the WG to align to the Malawi context.
The first question was “Does name have difficulty seeing?”. The responses to this question were yes or No. If the Head of the Household said Yes, the corresponding question was “Does [name] have difficulty seeing even if wearing glasses?” The responses to this question were: 1 = No-No difficulty; 2 = Yes-Some difficulty; 3 = Yes-A lot of difficulty; 4= Cannot see at all; 5= Never used Glasses
The second question was “Does name have difficulty hearing?”. The responses to this question were yes or No. If the Head of the Household said Yes, the corresponding question was “Does [name] have difficulty hearing even if using hearing aids?” the responses to this question were: 1 = No-No difficulty; 2 = Yes-Some difficulty; 3 = Yes-A lot of difficulty; 4= cannot hear at all; 5 = Never used hearing aid
The third question was “Does [Name] have difficulty walking or climbing steps? The responses were 1 = No-No difficulty; 2 = Yes-Some difficulty; 3 = Yes-A lot of difficulty; 4= cannot walk or climb at all
The fourth question was “Does [Name] have difficulty in speaking? The responses were 1 = No-No difficulty; 2 = Yes-Some difficulty; 3 = Yes-A lot of difficulty; 4= cannot speak at all
The fifth question was “Does [Name] have difficulty learning new things or solving problems or remembering? The responses were 1 = No-No difficulty; 2 = Yes-Some difficulty; 3 = Yes-A lot of difficulty; 4= cannot learn at all.
The sixth question was “Does [Name] have difficulty (with self-care such as) washing all over or dressing? The responses were 1 = No-No difficulty; 2 = Yes-Some difficulty; 3 = Yes-A lot of difficulty; 4 = cannot do at all [Citation20].
This study focuses on how these different functional domains vary with age. Age in the 2018 MPHC was calculated using the question “how old was [name] at his or her last birthday?” Thus, age is based on what was reported by the head of the household. Other demographic characteristics included in the study are sex, level of education, place of residence and household economic status.
Regarding sex, the 2018 MPHC requested the household head to indicate the sex of the household member through this question; “Is [Name] male or female”. Level of education in the census was collected based on this question, “What is the Highest qualification [Name] attained?”
Concerning place of residence, the census enumerators indicated on the census questionnaire whether they collected the information in the urban or rural areas of Malawi. Household economic status was created based on characteristics of the dwelling unit. During the 2018 MPHC, information was collected on characteristics of the dwelling unit. The characteristics included questions on the materials used for the roof, wall and floor. The number of rooms that the dwelling unit had included rooms used for sleeping. Questions asked were also on the main source of drinking water during the wet and dry season, type of toilet facility used, main source of energy for cooking and lighting and disposal of garbage. Responses to each of these questions were analysed using factor analysis. The results from the factor analysis was then used to group households into poorest, poorer, middle, richer and richest households [Citation20].
Regarding use of assistive products, this study only concentrated on use of glasses and hearing aids because these are the only domains where information on use of assistive products was collected.
Regarding use of assistive products such as glasses or hearing aids, the Washington group recommends use of the extended set of questions (Box 1)
Box 1. The Washington Group extended set of questions for seeing and hearing For Seeing:
Question 2: “[Do/Does] [you/he/she] have difficulty seeing, [If VIS_1 = 1: even when wearing [your/his/her] glasses]? Would you say…”
Question 3: “[Do/does] [you/he/she] have difficulty clearly seeing someone’s face across a room [If VIS_1 = 1: even when wearing [your/his/her] glasses]? Would you say…”
Question 4: “[Do/does] [you/he/she] have difficulty clearly seeing the picture on a coin [If VIS_1 = 1: even when wearing [your/his/her] glasses]? Would you say…”
For hearing:
Question 2: “[Do/Does] [you/he/she] have difficulty hearing, [If HEAR_1 = 1: even when using a hearing aid(s)]? Would you say…”
Question 3: “How often [do/does] [you/he/she] use [your/his/her] hearing aid(s)? Would you say…”
Question 4: “[Do/does] [you/he/she] have difficulty hearing what is said in a conversation with one other person in a quiet room [If HEAR_1 = 1: even when using [your/his/her] hearing aid(s)]? Would you say…”
Question 5: “[Do/does] [you/he/she] have difficulty hearing what is said in a conversation with one other person in a noisier room [If HEAR_1 = 1: even when using [your/his/her] hearing aid(s)]? Would you say…”
However, the 2018 MPHC did not include the extended set 3 and 4 for use of seeing difficulty and 3,4,5 for hearing difficulty [Citation20]. Therefore, to estimate the percentage of people using glasses and hearing aids (assistive products), this study used the following questions:
For seeing difficulty:
Question 2: [Do/Does] [you/he/she] have difficulty seeing, [If VIS_1 = 1: even when wearing [your/his/her] glasses]? Would you say…
And for hearing difficulty:
Question 2: [Do/Does] [you/he/she] have difficulty hearing, [If HEAR_1 = 1: even when using a hearing aid(s)]? Would you say…
Analysis
To address the objectives of this study, the 2018 MPHC data was analysed using descriptive statistics. Descriptive statistics included cross tabulations and measures of associations such as chi-squared tests, and two-way line graphs. Cross tabulations were conducted to provide basic information about the population in the dataset whilst measures of associations were conducted to highlight the potential relationships between the functional limitation or disability variables and the age of the household member [Citation21]. Both the cross tabulations and the measures of association were completed using STATA 14.0.
To create the disability variable since disability was measured as a continuum, the Washington Group has recommended four response options that include [Citation22];
“the least restrictive: those with any difficulty at all, in any domain of functioning and at any level of difficulty (minimum is at least one domain has at least some difficulty)”;
“a slightly more conservative measure wherein at least two domains are some difficulty, or at least one domain is a lot of difficulty or cannot do at all”;
“the recommended cut-off: at least one domain is a lot of difficulty or cannot do at all; and
“the most restrictive: at least one domain is cannot do at all” [Citation22].
To address the objective of this paper in exploring the relationship between functional status with age and use of glasses or hearing aids, we used the least restrictive cut-off point or measure of disability. That is to say persons with disability are those who had at least some difficult in any of the six health domains.
Following the exploration of the association between the functional limitation variables and age, we also examined the percentage of people using assistive products particularly those using glasses and hearing aids. The study focussed on use of glasses and hearing aids because these were the only assistive products whose information was collected during the census [Citation20].
Therefore, we examined use of glasses and hearing aids based on, unmet need, total need and coverage of assistive products. To estimate total need, unmet need and use of glasses and hearing aids, this paper has defined total need as follows [Citation11,Citation23];
Total need is the sum of the proportion of the population identified as using (i.e., those who responded that they have none, some, and a lot of difficulty when using glasses or hearing aids) and needing (have never used glasses or hearing aids).
Users of AP (Glasses or hearing aids) was analysed based on the proportion of the household members who responded, “no difficulties”, “yes some difficulties” and “a lot of difficulties”; when asked if they experienced any difficulties in seeing or hearing even when using glasses or hearing aids respectively.
Met need for glasses and hearing aids was assessed as the proportion of the population who have difficulties in seeing or hearing, but who no longer have such difficulties when using glasses or hearing aids; divided by the total number having difficulty seeing or hearing.
Unmet need for glasses or hearing aids was assessed as the proportion of the population who have difficulties in seeing or hearing, but who have responded that they have never used glasses or hearing aids when asked if they experienced any difficulties whilst using glasses or hearing aids.
Coverage was then analysed as the proportion of the population who actually use the assistive products by the total number of people who need the AT, calculated as “use” divided by “total need” [Citation11,Citation23].
Ethics
The study protocol was approved by Maynooth University Research Ethics Committee (SRESC-2019-2378566) and University of Malawi Research Ethics Committee (P.01/20/10).
Results
Background characteristics of the disabled population
In presenting the results, the study starts by presenting the description of the population with one or more functional limitations or disabilities which comprises of 1,556,670 persons. The results in indicate that more than fifty percent of persons with functional limitations in the country are women, a population distribution that is similar to the country’s distribution of women. The table further indicates that a high proportion of the population of people with disabilities are aged between five and thirty-four years. This age distribution provides evidence of the age structure of Malawi, which is a young population with a median age of 17 years. The results further demonstrate that more than half (54.7%) of the population of people with disabilities have primary education, and that close to 22% live in the poorest households.
Table 1. Background characteristics of persons with disabilities in Malawi (2018 MPHC).
Functional limitations among the different age groups
Further to the background characteristics, the study also assessed the relationship between the different domains of health and the age of the household member. Regarding the domains of health, a participant was regarded as having difficulty if the head of the household reported that the household member had some difficulty, a lot of difficulty or cannot do at all, in any of the health domains. Those who reported to have had no difficulty were taken as having no functional limitation.
shows that close to half (49%) of those who reported some functional limitations in the country experience difficulties with seeing. This functional limitation is followed by difficulties in walking (26.9%). Concerning the different age groups, difficulty in seeing is still the main functional limitation across all the age groups. Nonetheless, there are some differences in functioning among the different age groups. For example, children who are aged 5–9 experience more difficulties with self-care (26.5%) compared to those who are aged 80 and above (13.6%). Concerning the test of association between the health domains and age of the household member, the chi-square results indicated that there is a significant association between the age of the household member and their functioning status at the 95% level of significance. This means that the functioning status of an individual is related to ther age.
Table 2. Percentage distribution of functional limitation among the different age groups (2018 MPHC).
Further to the test of association between the six health domains and the age of the household member, we also assessed the trend in functional limitations among the specific ages. The graphical presentation of the results from this study in we have named Zomba curves after the location of study setting and data source. The results presented in demonstrates that the reporting of functional limitations or difficulties increases with an increase in age. This implies that as the population ages, the number of people reporting experiences of some, a lot of difficulties or cannot do at all, in seeing, hearing, speaking, walking or self-care also increases. For example, the results in indicates that there is a small percentage of people who report difficulties in seeing in the younger ages (particularly 5–35); but from the age of 40 the percentage of people reporting seeing difficulties increases. Concerning difficulties speaking, even though the percentages or proportion reporting difficulties are almost zero, the proportion begin to rise as we reach age 65 and above. This demonstrates that difficulties in speaking is a significant functional limitation among the elderly.
Figure 1. Distribution of responses indicating any level of difficulty across six functional domains by age.
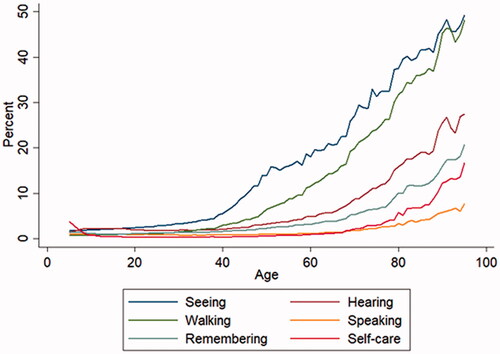
Figure 2. Number of co-occurring functional limitations by age.
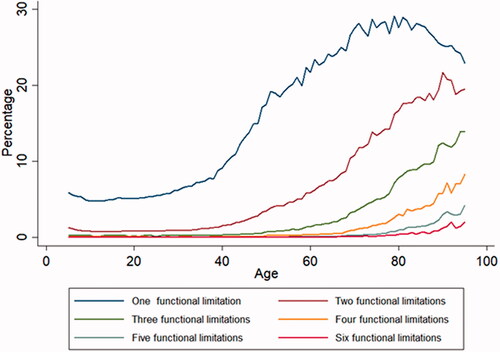
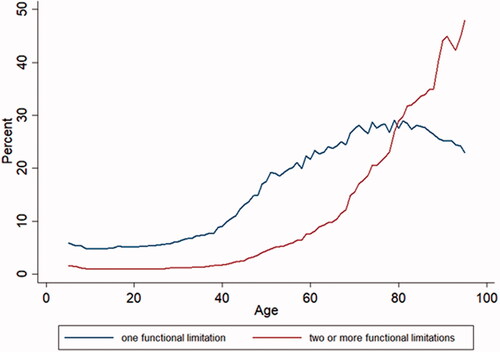
Figure 3. Comparison of one and two or more functional limitations by age.
Concerning the reporting of a single functional limitation or more, below illustrates that the reporting of a single functional limitation increased with the increase in age of the household member. This trend also occurred among those reporting two or more functional limitations Nonetheless, there were some fluctuations in the reporting of functional limitation as the age of the household member increases. For example, at age 60 and 80 there was a slight decline in the reporting of single functional limitations even though the proportion reporting was on the increase. The fluctuations in reporting functional limitations are seen in all the different levels of functional difficulties.
Comparing the reporting of a single functional limitation with two or more limitations, demonstrates that in the younger ages (5–40) the proportion or percentage reporting difficulties in functional limitation is almost constant. The rise in the proportion reporting functional limitation starts to occur from age 40 and above. However, the proportion reporting one functional limitation is higher compared to two or more limitations. Nonetheless, at age 78–80 the proportion reporting two or more functional limitations increases way above those reporting one functional limitation. This result implies that there are high experiences of comorbidities in the country amongst those aged 80 and above.
Uses of glasses and hearing aids among persons with seeing and hearing difficulties
Regarding the use of glasses and hearing aids, met and unmet needs were drawn from the frequencies shown in . presents the frequencies and the percentages of people who reported they had no difficulty, some difficulty, a lot of difficulty, cannot see or hear at all and those who have never used glasses or hearing aids.
Table 3. Percent distribution of persons having trouble in seeing and hearing (2018 MPHC).
Table 4. The proportion of people using glasses and hearing aids in Malawi (2018 MPHC).
Concerning the need for glasses amongst people with seeing difficulties, indicates that 60.9% of the people who reported that they have difficulties seeing were using glasses. This proportion includes those who experience no seeing difficulties when they wear glasses, those who experience some and a lot of seeing difficulties whilst using the glasses. In terms of unmet need, the results demonstrates that there is a significant proportion (38.1%) of the population who have never had access to glasses. Regarding total need, the results in , indicate that there is a high demand for glasses among persons with seeing difficulties. Almost all persons with seeing difficulties would like to have access to glasses. Nevertheless, coverage is only 60.9%. Concerning hearing aids, only 63.5% of persons who reported having hearing difficulties are using hearing aids. Close to 35% of the population have never used hearing aids, and although there is a high demand for hearing aids, coverage of hearing aids in the country is only 64.5%.
Discussion
This study aimed to measure age related increase in impairment and estimate the need for AT in Malawi through the assessment of the proportion reporting difficulties in seeing, hearing, walking speaking, remembering and self-care. The results from the assessment have shown that there are higher proportions of persons reporting difficulties in these health domains as the age of the population increases. This increase in the proportion reporting difficulties in all the health domains is clearly observed from the age of 40 and above. This observed increase in reporting functioning difficulties from age 40 corresponds to what was reported in the Malawi Longitudinal Survey of Families and Health (MLSFH). In this survey conducted in the rural areas of Rumphi, Mchinji and Balaka by Payne and colleagues [Citation24], it was found that the risk of experiencing functional limitations was higher amongst women and men aged 45 years. According to Payne et al. the 45 year old men and women were at high risk of experiencing functional limitations due to poor physical health. In this study, a number of factors such as poor health or lack of social services could have contributed to the functioning difficulties reported by household members; but since these results are from census data, no definite conclusion can be made. Nonetheless, the results found in this study demonstrates the need for AT amongst those aged 40 years and above.
Further to the increased proportion of household members reporting functional limitations at age 40, this study has also shown that there are high proportions of children aged 5–15 reporting difficulties in self-care. Our results are supported by the findings in a population-based study in Uganda that found children aged 2–17 to have had lower developmental trajectories on self-care compared to those of Sweden and Australia. According to Andrews et al. [Citation25] lack of knowledge about where to seek health care, insufficient finances, lack of assistive devices and loss of hope by parents of children with disabilities were factors that contributed to the low self-care abilities among the Ugandan Children with cerebral palsy. In the United States, functional limitations in self-care among children who have been found to be associated with living in a single parent household, a household with poor resources, with a member who smokes as well as the poor health status of the child and parental neglect [Citation26,Citation27]. Regarding Malawi, the poor socio-economic status [Citation28] and the family situations including lack of assistive products among children with disabilities could be the contributing factors to the higher proportion of difficulties in self-care amongst the children aged 5–15 [Citation29].
In addition to the specific health domains, this study has also compared one and two or more co-occurring functional limitations. The Zomba curves in and have demonstrated that the experience of co-occurring functional limitations increases with an increase in age. Thus, older people experience multiple functional limitations compared to young people. further illustrates that the multiple functional limitations surpass the experiences of a single functional limitations particularly after the age of 80. These findings of multiple functional limitations amongst the elderly correspond to research on the health status of older populations in sub-Saharan Africa [Citation30–33]. For example, in Nigeria, Abdulraheem et al. found advanced age (75 and above) to be associated with the risk of functional limitation in standing, walking, sitting, and bending among the elderly rural populations [Citation30]. A population-based study of Cameroon and India also reported an increase in need for AP for persons 60 years and above [Citation11]. In Gambia, older women have also been found to be at increased risk of neck pain and functional limitations in the activities of daily living [Citation32]. According to Aboderin (2010) older populations in the Sub-Saharan region experiences multiple functional limitations because of their vulnerability to ill health such as chronic conditions, and their exclusion from health services [Citation31]. Head-load carrying, a common phenomenon across sub-Saharan Africa has also been found to be associated with functional limitations in Gambia [Citation32]. Concerning Malawi, the poor health status of the elderly and lack of both social and economic resources including access to assistive technology contribute to the increase in multiple functional limitations among the elderly [Citation28,Citation29,Citation33]. It is pertinent to note that although a lot of people live longer without difficulty or impairment, there is need for planning services in future to cater for the AT needs of the elderly.
The WG offered us an opportunity to estimate the use, unmet need, total need and coverage of glasses and hearing aids in the study population. The high unmet need for glasses and hearing aids were 38.1% and 34.9% meaning that over one third of the population in need of these devices do not have them. This unmet need has huge implications for their quality of life, education, employment, social integration, and experience of health [Citation15]. Previous studies have highlighted the role of AT for the realization of the SDGs and Universal Health coverage [Citation6,Citation10] and these findings in Malawi although restricted to two groups of AT provides information on the unmet need for other categories of products and the implications for those who need them.
This study provides an opportunity to leverage available data to explore the experience of impairment across life course and the associated need for AT for affected individuals. Despite these significant findings, the use of APs remains estimates as the data relied on self-reported experience of impairment which may differ from actual experience of impairment or need for AT. The use of self-report compared to clinical assessment of disability or AT need is fraught with risk of underestimation and overestimations. However, Boggs et al. reported the advantages of self-reported estimates in providing a rapid and cost friendly option especially in low resource settings [Citation11].
Conclusion
Data on AT across the life course provides opportunity for population-level planning. The use and need for AT is important for allowing people to effectively engage in their activities of daily living, with the greatest degree of independence possible. The estimation of AT needs using the Malawi census data is an innovative and cost-effective option to provide useful estimates of the AT need for the growing population. In resource poor settings such as Malawi, this form of research is pivotal for understating AT need and instructive for policy purposes. In undertaking this project, the APPLICABLE project helps to address the lack of data on AT which is relevant for developing an AT policy and ecosystem that will support the increasing need for AT for persons with disabilities, the aged and indeed all individuals in society.
Author contributions
IDE and MM conceptualized the paper with contributions from MZJ, EMS, JK and AM. MZJ analysed the data with contribution from IDE, MM and PC. IDE wrote the initial draft which was reviewed and revised by all the authors. All authors read and approved the final version of the manuscript.
Acknowledgements
The authors are grateful to the members of APPLICABLE Project Action Research Group.
Disclosure statement
No potential conflict of interest was reported by the authors.
Data sharing
The datasets used in the current study are available from the corresponding author on reasonable request.
Additional information
Funding
References
- World Health Organization. Priority assistive products list (APL). Geneva: WHO, 2016; 2016.
- Khasnabis C, Mirza Z, MacLachlan M. Opening the GATE to inclusion for people with disabilities. The Lancet. 2015;386(10010):2229–2230.
- World Health Organization. Global perspectives on assistive technology: proceedings of the GReAT Consultation 2019, World Health Organization, Geneva, Switzerland, 22–23 August 2019. Volume 1. 2019.
- Khasnabis C, Holloway C, MacLachlan M. The digital and assistive technologies for ageing initiative: learning from the GATE initiative. Lancet Healthy Longev. 2020;1(3):e94–e5.
- World Health Organization. Decade of healthy ageing: baseline report. 2020.
- Layton N, Bell D, Borg J, et al. Assistive technology as a pillar of universal health coverage: qualitative analysis of stakeholder responses to the world health assembly resolution on assistive technology. Disabil Rehabil Assist Technol. 2020;15(7):825–831.
- World Health Organization. The implications for training of embracing: a life course approach to health. Geneva: World Health Organization; 2000.
- Sustainable Development Goals [Internet]. 2020; [cited May 2021]. Available from: http://www.undp.org/content/undp/en/home/sustainable-development-goals.html.
- Convention on the Rights of Persons with Disabilities (CRPD) [Internet]. 2006; [cited May 2021]. Available from: https://www.un.org/development/desa/disabilities/convention-on-the-rights-of-persons-with-disabilities.html.
- Tebbutt E, Brodmann R, Borg J, et al. Assistive products and the sustainable development goals (SDGs). Global Health. 2016;12(1):79.
- Boggs D, Kuper H, Mactaggart I, et al. Estimating assistive technology need through population-based surveys: an analysis of data from Cameroon and India. Global Perspect Assist Technol. 2019;2019:52.
- Mactaggart I, Kuper H, Murthy G, et al. Measuring disability in population based surveys: the interrelationship between clinical impairments and reported functional limitations in Cameroon and India. PLoS One. 2016;11(10):e0164470.
- Michel J-P, Leonardi M, Martin M, et al. WHO’s report for the decade of healthy ageing 2021–30 sets the stage for globally comparable data on healthy ageing. Lancet Healthy Longev. 2021;2(3):e121–e2.
- Washington Group on Disability Statistics. Question Sets 2021. [cited 2021]; Available from: https://www.washingtongroup-disability.com/question-sets/.
- Ebuenyi ID, Kafumba J, Smith EM, et al. Empirical research and available data on assistive technology for persons with disabilities in Malawi: a review. Assistive Technol. 2021;2021:1–13.
- Ebuenyi ID, Smith EM, Kafumba J, et al. Implementation of the assistive product list (APL) in Malawi through development of appropriate policy and systems: an action research protocol. BMJ Open. 2020;10(11):e040281.
- Jamali-Phiri M, Ebuenyi ID, Smith EM, et al. Socio-Demographic factors influencing the use of assistive technology among children with disabilities in Malawi. Int J Environ Res Public Health. 2021;18(6):3062.
- Smith EM, Ebuenyi ID, Kafumba J, et al. An overview of assistive technology products and services provided in Malawi. Disabil Rehabil Assist Technol. 2020;2020:1–5.
- Macrotrends. Malawi Life Expectancy 1950–2021; [cited 2021]. Available from: https://www.macrotrends.net/countries/MWI/malawi/life-expectancy.
- Governement of Malawi. Malawi population and housing census main report. Zomba: National Statistical Office. 2019.
- Peatman JG. Descriptive and sampling statistics. 1947.
- Washington Group on Disability Statistics. Creating Disability Severity Indicators Using the WG Short Set on Functioning (WG-SS) 2021.
- Danemayer J, Boggs D, Polack S, et al. Measuring assistive technology supply and demand: a scoping review. Assistive Technol. 2021;33(sup1):S35–S49.
- Payne CF, Mkandawire J, Kohler H-P. Disability transitions and health expectancies among adults 45 years and older in Malawi: a cohort-based model. PLoS Med. 2013;10(5):e1001435.
- Andrews C, Kakooza‐Mwesige A, Almeida R, et al. Impairments, functional limitations, and access to services and education for children with cerebral palsy in Uganda: a population-based study. Dev Med Child Neurol. 2020;62(4):454–462.
- Hogan DP, Rogers ML, Msall ME. Functional limitations and key indicators of well-being in children with disability. Arch Pediatr Adolesc Med. 2000;154(10):1042–1048.
- Vandivere S. Unsupervised time: Family and child factors associated with self-care. 2003.
- Munthali AC. A situation analysis of persons with disabilities in Malawi. 2011.
- Eide AH, Munthali A. Living conditions among persons with disabilities in Malawi. A national, representative survey 2017.
- Abdulraheem I, Oladipo A, Amodu M. Prevalence and correlates of physical disability and functional limitation among elderly rural population in Nigeria. J Aging Res. 2011;2011:369894.
- Aboderin I. Understanding and advancing the health of older populations in Sub-Saharan Africa: policy perspectives and evidence needs. Public Health Rev. 2010;32(2):357–376.
- Hiestand-Saho M, Sidibeh P, Ernst MJ. Pain and functional limitation among rural female gambian head-load carriers a cross-sectional study. Eur J Physiother. 2022;24(2):79–76.
- Stuck AE, Tenthani L, Egger M. Assessing population aging and disability in Sub-Saharan africa: lessons from Malawi? PLoS Med. 2013;10(5):e1001441.