Abstract
Purpose
Explicitly monitoring the need, use and satisfaction of assistive product (AP) provision is essential to support population health and healthy longevity in ageing/aged countries, like Korea. We present findings from the 2017 Korea National Disability Survey (NDS) on AP access and compare them to international averages, introducing Korea’s data into the wider coherence of global AP research.
Materials and methods
Using data from Korea’s 2017 NDS, surveying 91,405 individuals, we extracted and calculated AP access indicators, including needing, having, using and being satisfied with 76 unique APs, by functional difficulty and product type. We compared satisfaction and unmet need between the National Health Insurance System (NHIS) and alternative provision services.
Results
Prosthetics and orthotics had high rates of under-met need, and lower satisfaction rates, from 46.9% to 80.9%. Mobility APs overall had higher rates of under-met need. There was either low (<5%) or no reported need for most digital/technical APs. Among main products, those provided through the NHIS had lower unmet need (26.4%) than through alternative providers (63.1%), though satisfaction rates were similar (p < .001).
Conclusions
The Korean survey findings align with global averages calculated in the Global Report on Assistive Technology. Low reported needs for certain APs may reflect low awareness about how these products could benefit users, emphasizing the importance of data collection at each stage of the AP provision process. Recommendations to expand access to APs are given for people, personnel, provision, products, and policy.
IMPLICATIONS FOR REHABILITATION
Access to assistive products (APs) is an essential part of physical and occupational therapy services and rehabilitation. Monitoring population-level data on disability and AP access can inform policymakers about a key aspect of population health and healthy ageing, and demonstrate the need to expand access by including APs and associated services in primary/universal healthcare packages.
Stratifying findings about AP access by type of functional difficulty and further by specific device helps identify the populations for whom needs are not being met. These domain-level and device-level indicators inform efforts to support specific groups within the population of people with disabilities, which has implications for how rehabilitation services are provisioned, targeted and made more accessible.
Introduction
Korea is a rapidly ageing country, with its population over 65 years old increasing from 5% in 1990 to 17% in 2021 [Citation1]. Comparatively, the global population over 65 has increased from 6% in 1990 to 9% in 2019 [Citation2]. As populations age and functional difficulties become more prevalent, the importance of assistive technology (AT) provision becomes more pronounced [Citation3–5]. AT is inclusively defined by the World Health Organization (WHO) as “an umbrella term covering the systems and services related to the delivery of assistive products and services [Citation6],” which covers basic products used each day [Citation7] to innovative digital technologies [Citation8]. AT promotes individuals’ well-being by maintaining or improving individual functioning and independence, yet 90% of those who need it globally do not have access [Citation6]. Disparities in access to AT within a population can indicate inequities in healthy aging trajectories that will widen as the overall population ages, if clusters of limited access are not identified and addressed [Citation9–13]. Explicitly monitoring the need, use, and satisfaction of assistive product (AP) and service provision is therefore essential to support population health and healthy longevity [Citation14–17]. This secondary analysis presents findings from the 2017 Korea National Disability Survey (NDS), specifically on AP access in the country.
Cohesive health service data are critical to planning for ageing populations globally [Citation18], yet nuanced datasets focused on AP access at the population-level remain sparse across the sector [Citation7]. Often, data are unavailable outside the countries in which they are collected due to language/communication barriers between researchers and publication venues. Further, fundamental variation in key definitions, individual assessment methods, data collection strategies and patterns of reporting complicate harmonising the data that are available. illustrates this challenge by providing key definitions relevant to the data utilised and discussed in an international context in this paper.
Table 1. Key definitions of assistive technology.
Approaches to assess individual need, evaluate interventions, and report data regarding APs vary substantially, complicating efforts to understand global and national trends. Researchers have used centralised health record systems [Citation24,Citation25], censuses and demographic household surveys with AP-specific modules [Citation26,Citation27], or dedicated cross-sectional surveys [Citation7,Citation28,Citation29] to explore national need and access to APs. Korea administers the NDS every three to five years (since 1980) by drawing from the National Disability Registration System. While disability registers (both general and for specific conditions/pathologies) exist globally [Citation27], we were unable to identify any published research using data from these sources to understand AP access in a population, both in targeted database searches or existing reviews [Citation7,Citation30,Citation31].
This paper’s exploration of data from Korea’s 2017 NDS demonstrates how bottlenecks in AP access can be indicated through data collection at a national level that allows disaggregation by AP indicator and product type. We discuss implications of these findings and situate Korean AP indicators among those reported in the Global Report on Assistive Technology (GReAT) [Citation9], presenting a nuanced interpretation and introduction of an under-explored source of AP data into the wider coherence of global AP research.
Methods
Data source
Complete details on the survey methodology are provided elsewhere [Citation23]. In brief, households in 17 cities and provinces across South Korea were taken as the target population, and 250 survey areas nationwide were extracted through stratification and random sampling, including small to large cities and rural villages as sample survey areas. Across these areas, the number of target households was 44,161, and 36,200 (81.9%) were surveyed. This included 91,405 household members, with all ages eligible for inclusion, of whom 6549 had disabilities. For these individuals, a survey team (130 persons in total) conducted a household visit interview survey based on a structured questionnaire. The survey took 2–3 hours per person, and the face-to-face in-depth survey was conducted through Computer Assisted Personal Interviewing (CAPI). The survey period was from 2 September 2017 to 30 October 2017. After the survey was completed, first and second verification was conducted, and post-phone verification was conducted for 602 people who had insufficient survey results. The survey results were analysed by researchers of the Institute for Health and Social Affairs using the SPSS statistical package [Citation32].
The survey results are divided into the characteristics and status of individual disability classifications, and the general characteristics covering all disabilities. Disability is divided into severe and mild, and classified into 15 types: physical disability, disability of brain lesion, visual disability, hearing disability, speech disability, intellectual disorder, mental disorder, autistic disorder, kidney dysfunction, cardiac dysfunction, respiratory dysfunction, hepatic dysfunction, facial disfigurement, intestinal/urinary dysfunction and epilepsy. Epidemiological data concerning these official disability categories set by the government are openly accessible [Citation23].
Out of a total of 64 pages of the interview questionnaire used to survey people with disabilities, four pages (12 questions) are related to APs. For the purposes of this case study, specific APs are defined in terms of the ISO9999 standards [Citation22], with which the Korean National Survey corresponds. First, a list of 76 unique APs is presented and individuals are asked if they need, possess or use any of them. Where applicable, participants are asked about the reason for not purchasing an AP when it is needed, the reason for not using it even though they have it, and the financial support and purchase route for the AP. If respondents used multiple products, they were asked to identify one as their “main” product. For these main products, additional data on satisfaction were collected. Satisfaction rate is calculated as the number of respondents reporting they are somewhat or very satisfied with their main product divided by all individuals listing that AP as their main product.
Analysis
AP indicators (needing, having, and using APs) were calculated from our data, which we accessed as summary statistics stratified by AP and disability type. With the disaggregation of these outcomes in the survey, we were able to further calculate (1) unmet need, as the difference between needing and having an AP and (2) under-met need, as the difference between having and using an AP [Citation7]. We present these results by AP and disability domain, accompanied by absolute values, as indicator definitions/interpretations often vary across the AP sector.
Respondents were asked additional questions about their self-reported main AP. These included satisfaction and source/provider. We tested the association between two AP indicators (needing and having APs) and AP providers. In Korea, most APs are provided by seven public benefit systems. The researcher matched the 76 APs included in the disability survey with public benefit systems and indicated the APs provided for each of the seven systems. The National Health Insurance Systems (NHIS) are for all citizens, providing any of 28 APs. However, other public benefit programs have eligibility criteria for AP provision, and fewer APs are included. Public benefit systems entirely or partially covering APs in Korea include:
The NHIS, which covers almost everyone in Korea who registered to the NHIS, similar to the National Health Service in the U.K. Powered wheelchairs, hearing aids and orthotic and prosthetic products classified as medical products are provided in the NHIS. The NHIS and the Ministry of Health and Welfare (MHW) offer the same APs, but there is a special program that lowers the deductible for low-income people with disabilities.
The MHW, which provides APs such as adaptive clothing and walking sticks for blind for low-income individuals living in the community.
Long-term care (LTC) insurance for the elderly, which provides bathroom aids and walking aids.
The Ministry of Science & Information and Communication Technology (MSI), which provides APs such as braille computers to reduce information access gaps.
The Ministry of Employment and Labor (MEL), which provides APs for those injured by industrial accidents.
The Korea Employment Agency for Persons with Disabilities (KEAD), which provides APs to promote and maintain disability workers’ employment status.
The Ministry of Patriots and Veterans Affairs (MPVA), which provides APs such as orthotic and prosthetic products for veterans.
We conducted a two-sided t-test to evaluate any difference in satisfaction or unmet need between NHIS provision (i.e., universally funded/covered APs, of which n = 28) and alternative sources combined (i.e., limited/not payable through the public benefit systems, of which n = 33 APs), in SPSS21.31 [Citation33]. This analysis considered main APs, for which satisfaction data were collected, and defined “satisfaction” as answering either somewhat or completely satisfied.
Role of the funding source
The funding sources had no role in study design, data collection, data analysis, data interpretation, writing of the report, or the decision to submit the paper for publication.
Results
For 2017, the number of people with disability in Korea is estimated 2,668,411, or 5.4% of the total population (51.36 million). The number of people registered to the disability system in government is 2,511,051, demonstrating an estimated registration rate of 94.1%. Among the registered population, the types of disabilities, the proportion of persons with physical disabilities (48.4%) is the most prevalent and the proportion of the elderly (>65) with disabilities is 46.6%. Overall, 36.8% reported severe disability and 61.4% reported mild disability. presents our findings by product and domain for the most needed APs (>50,000 respondents reporting need). Unmet and under-met needs for these products are highlighted in . Results for all products (regardless of the number reporting need), are available in and Appendix Figure A1.
Figure 1. Unmet and under-meet needs among the most-needed assistive products.
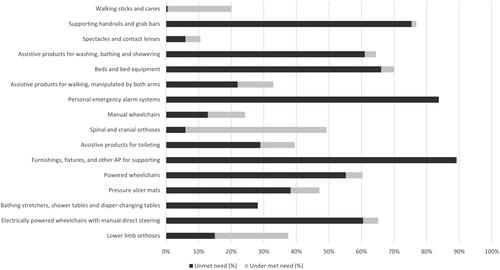
Table 2. Indicators for most-needed APs.
Prosthetics and orthotics have the highest rates of under-met need, or individuals having but not using the AP. Limb prostheses/orthoses also had lower satisfaction rates, ranging from 46.9% to 80.9%. Mobility APs overall have higher rates of under-met need.
There is either low (<5%) or no reported need for some digital/technical APs, specifically daisy player, touch monitor, special keyboards and mice, and alarm systems. There is also no reported need for recreational APs.
There is also high unmet need for APs as reported by individuals with any disability (i.e., individuals registered with one type of functional difficulty may report needing APs typically associated with a different functional domain). Specifically, the highest unmet need corresponds to housing modification (89.2%), alarm systems (83.7%) and grip bars (75.4%).
For five priority APs generally representing five different functional domains, upper limb prosthetics have the lowest satisfaction rate (50.0%), followed by hearing aids (66.8%), lower limb prosthetics (80.9%), manual wheelchairs (84.7%), glasses/contact lenses (93.5%) and standard network telephones (100%).
Each AP with a satisfaction rate of 100% has <20 users listing it as their main product, of which 17 (17/34, 50%) are digital/technical APs/features.
Among main products, our test for association identified comparatively high unmet need for products provided by an alternative source (MHW, LTC, MSI, MEL, KEAD and MPVA combined) (63.1%) and low unmet need for those provided by the NHIS (26.4%) (p < .001). Satisfaction rates are similar between these categories, at 84.2% for those provided by the NHIS, and 89.4% for those provided by MHW, LTC, MSI, MEL, KEAD and MPVA.
Discussion
This study presents AP access findings from the 2017 Korea NDS. By calculating unmet and under-met need for products, our analysis has revealed variable access to APs in Korea. We now compare these findings to those of the GReAT [Citation9] and discuss their broader implications. Median values of respondents (aged 2 and above) in the GReAT reporting at least some difficulty are 20.9% for vision, 12.1% for mobility, 6.4% for cognition, 4.8% for hearing, 4.1% for self-care and 2.4% for communication. These functioning categories correspond closely to those utilized in the Korean dataset, with some further disaggregation and detail. Out of the entire population of people registered, 10.2% are for vision, 60% for mobility/brain lesion, 8.5% for intellectual disability/autism, 10.9% for hearing and 0.8% for speech. Korea’s divergence from several of these global averages demonstrates how people may identify differently with disability, regardless of level of functioning difficulty. This variation has significant implications for the representativeness of different methods of data collection. For example, individuals with levels of seeing difficulty that can be supported by glasses alone may not consider/register themselves as disabled, which would limit the extent to which a disability registry captures all levels of visual impairment in a population. The GReAT estimates the prevalence of need for APs (including glasses) at 31.3% globally, based on self-reported survey data (uncertainty limits: 25.7–36.9%). For 60 years and older, this increases to 68.7% (63.2–74.2%), demonstrating the significant role of AP access at older ages [Citation9]. These averages also tended to increase in countries with higher human development index scores. GReAT identifies the most needed products as glasses, then hearing aids among the highest, along with a range of mobility-supporting products, including canes and crutches; chairs for shower, bath and toilet, and different types of wheelchairs, orthoses and prostheses. Though prevalences of disabilities vary, the Korea dataset demonstrates an extremely similar run of most frequently needed products, including glasses and mobility aids, specifically including all mentioned above. Among these most frequently needed products, unmet need ranged from 0.5% (walking sticks and canes) to 83.7% (personal emergency alarm systems).
The GReAT also found the most common barriers to accessing APs among individuals with unmet need are high costs, low availability and lack of support. Further, the majority of AP users obtained their products from private sector, paid for by themselves or with support from family and friends. The Korea survey asked AP users about satisfaction with main products, and it was found that users experienced high satisfaction (84.2–89.4%), regardless of how they obtained their APs. However, users obtaining their APs from methods outside the publicly funded system experienced significantly higher unmet needs for products. Though the NHIS only covers APs that are registered as medical products, most people in Korea utilize the NHIS and these products are more available to all. However, many non-medical products constitute APs, such as those for self-care, communication, computer access, housing modification and recreation. Korea currently lacks strong policies protecting access to these types of APs, which are needed to for other provision systems to secure a more inclusive product list for all people with disabilities [Citation17].
Data collection that distinguishes having an AP, using an AP, and satisfaction with an AP highlights product-level problems that limit effective coverage, as opposed to supply-side or service-delivery bottlenecks [Citation7]. For example, calculating under-met need demonstrates how often individuals who already have an AP may be unable to use it effectively. High under-met need for mobility APs, in particular prosthetics and orthotics, may reflect issues with these specific products experienced by individuals with mobility impairments; there may be design features limiting the product’s usability, longevity and versatility, or individual factors like functional decline among users may quickly make some APs irrelevant. Geographic variations in under-met need for the same product may also indicate environmental or infrastructure-level barriers to effective use [Citation34]. Importantly, a follow-up study among this user group could identify common problems that are preventing needs from being met and limiting users’ satisfaction [Citation35]. This research should then be made available to designers to improve usability of these APs, as this information pathway provides an opportunity to continuously improve APs at the design stage by routinely collecting in-depth user feedback and satisfaction data.
Interventions to expand access to APs must be evidence-based and can address any stage of the product adoption process, which is illustrated in . This figure proposes that initial AP adoption is successful only when the user is satisfied with their product (though updates like repairs may be needed in future). Alternatively, this figure also proposes that a user can make an informed decision that they would not benefit from an AP and therefore are not in need of it, but this decision is only possible where users are aware of the AP and its attributes.
Figure 2. AP Adoption process.
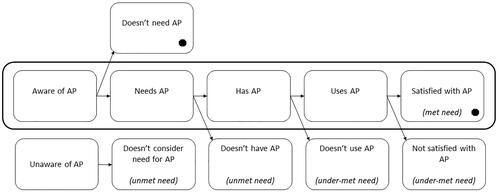
The Korea NDS provides data on needing, having, and using all included APs, with the addition of satisfaction for main products. But without data on awareness, it is not possible to learn how it may impact self-reported need. Low reported need for technical and leisure APs may reflect low awareness about how these products could benefit users. As satisfaction data are also missing for secondary products, some under-met need and dissatisfaction are likely not being captured. This may be especially relevant for individuals with multiple functional difficulties who regularly use multiple products. It is also important to recognise the utility of APs across multiple functional domains. Asking individuals with any type(s) of disability about their need for any APs helps to capture need that may be overlooked if e.g., only individuals with hearing difficulty are surveyed about need for audio subtitling.
Our study presents a transparent analysis from the largest routine data collection effort including APs in Korea. Our descriptions are considerate of varying international definitions and standards to maintain relevance and comparability. However, data from Korea’s 2017 NDS have several limitations. As discussed, without data collected on awareness, there is potential under-reporting of need as respondents may be unfamiliar with how certain APs could benefit them (e.g., leisure APs). The data are also based on a national registry; disability registration is often entrenched in stigma and many individuals who may be in need do not register. Those not registered were not considered in this dataset. Finally, 2020 NDS data were not used in this exploration due to data discrepancies that likely resulted from a lack of in-person assessments due to COVID-19.
Recommendations
We present our recommendations as relevant to the “5 P’s” developed by the WHO’s Global Cooperation on Assistive Technology (GATE) [Citation36]:
People: Individual AP users should be encouraged and enabled to provide feedback at all points during the AP provision process. This may be during clinical visits or through online sites and services that provide information on APs.
Personnel: Awareness about AP supports users throughout the AP adoption process. Healthcare providers need to know what APs are available in the market and how it can be procured and funded for the user. Their work can be supported by improved access to relevant information that is comprehensive and updated. Inclusive training on AP assessment and provision can help avoid unmet and under-met need, and subsequent AP abandonment. Providers can also encourage and support users providing feedback through dedicated channels.
Procurement: An inclusive AP service delivery system is essential. In some settings like Korea, the medical sector has strengthened service delivery for certain products like wheelchairs and prosthetics, yet APs for daily living are insufficiently covered. Only 21 products in the disability survey are provided as a right for people with disabilities through the NHIS. There are not enough products provided for daily living to fully support the functioning of people with disabilities, such as braille writers, augmentative and alternative communication products, and housing modification. Provision services can be made more accessible to more individuals, including older adults and others with limited capacity to navigate health services that are increasingly provided through a digitally transforming health system.
Products: User feedback on APs is extremely valuable to identify product shortcomings across different populations. Korea’s NDS allows disaggregation between “having” and product and “using” a product, identifying a group who do not find their APs to be useful. This level of disaggregation, at minimum, should be reflected in all regular AP data collection and made available to designers and producers, who can use these data to identify user groups for further in-depth research and improve AP usability.
Policy: Healthcare providers should be trained to support the AP adoption process as a requirement. Policies for disability inclusion in healthcare need to consider APs a fundamental component of primary care access to ensure it is provisioned for as countries move towards achieving universal health care. Coverage of products useful for daily living among older adults, as well as products where low awareness may lead to underreported need (e.g., AP for leisure or cognitive functional difficulty), must be included in this provisioning.
Conclusions
Assistive technology is critical to supporting people with disabilities, and its role increases as populations age. Our analysis demonstrates how Korea’s NDS plays a key role in collecting data that indicate access to APs. Further research can be done to examine trends, identify clusters of disproportionate need, and connect key learnings around AP provision to the global sector.
Disclosure statement
No potential conflict of interest was reported by the author(s).
Data availability statement
All data utilized in this case study are available, either publicly or by request, through national statistics office websites of the Korean government.
Additional information
Funding
References
- Population ages 65 and above (% of total population). Data; 2022 [Internet] [cited 2022 Sep 22]. Available from: https://data.worldbank.org/indicator/SP.POP.65UP.TO.ZS
- World population ageing highlights. New York: United Nations; 2020 [Internet]. Available from: https://www.un.org/en/development/desa/population/publications/pdf/ageing/WorldPopulationAgeing2019-Highlights.pdf
- Khasnabis C, Holloway C, MacLachlan M. The digital and assistive technologies for ageing initiative: learning from the GATE initiative. Lancet Healthy Longev. 2020;1(3):e94–e95. doi: 10.1016/S2666-7568(20)30049-0.
- Rudnicka E, Napierała P, Podfigurna A, et al. The World Health Organization (WHO) approach to healthy ageing. Maturitas. 2020;139:6–11. doi: 10.1016/j.maturitas.2020.05.018.
- Michel J-P. Transitions from health to disease in older populations. Lancet Healthy Longev. 2022;3(2):e79–e80. doi: 10.1016/S2666-7568(22)00011-3.
- World Health Organization. Assistive technology. WHO fact sheet on assistive technology; 2018 [Internet] [cited 2022 Apr 11]. Available from: https://www.who.int/news-room/fact-sheets/detail/assistive-technology
- Danemayer J, Boggs D, Ramos VD, et al. Estimating need and coverage for five priority assistive products: a systematic review of global population-based research. BMJ Glob Health. 2022;7(1):e007662. doi: 10.1136/bmjgh-2021-007662.
- Loveys K, Prina M, Axford C, et al. Artificial intelligence for older people receiving long-term care: a systematic review of acceptability and effectiveness studies. Lancet Healthy Longev. 2022;3(4):e286–e297. doi: 10.1016/S2666-7568(22)00034-4.
- World Health Organization. United Nations Children’s Fund. Global Report on Assistive Technology. Geneva, Switzerland; 2022 [Internet] [cited 2022 May 30]. Available from: https://www.who.int/publications-detail-redirect/9789240049451
- Agree EM, Freedman VA. A quality-of-life scale for assistive technology: results of a pilot study of aging and technology. Phys Ther. 2011;91(12):1780–1788. doi: 10.2522/ptj.20100375.
- Freedman VA, Kasper JD, Spillman BC. Successful aging through successful accommodation with assistive products. J Gerontol B Psychol Sci Soc Sci. 2017;72(2):300–309.
- Freedman VA, Kasper JD, Spillman BC, et al. Behavioral adaptation and late-life disability: a new spectrum for assessing public health impacts. Am J Public Health. 2014;104(2):e88–e94. doi: 10.2105/AJPH.2013.301687.
- McSweeney-Feld MH. Assistive technology and older adults in disasters: implications for emergency management. Disaster Med Public Health Prep. 2017;11(1):135–139. doi: 10.1017/dmp.2016.160.
- Frochen S, Mehdizadeh S. Functional status and adaptation: measuring activities of daily living and product use in the national health and aging trends study. J Aging Health. 2018;30(7):1136–1155. doi: 10.1177/0898264317707299.
- Gomez F, Zunzunegui MV, Alvarado B, et al. Cohort profile: the International Mobility in Aging Study (IMIAS). Int J Epidemiol. 2018;47:1393–1393.
- Pousada Garcia T, Scherer M, Jimenez E, et al. Improving assistive technology services through outcome measures and global knowledge sharing in order to make the best match of person and technology global perspectives on assistive technology: proceedings of the GReAT Consultation 2019. World Health Organization; 2019. p. 52–78 [Internet]. Available from: https://apps.who.int/iris/bitstream/handle/10665/330371/9789241516853-eng.pdf
- Smith EM, Battistella LR, Contepomi S, et al. Measuring met and unmet assistive technology needs at the national level: comparing national database collection tools across eight case countries. In: Layton N, Borg J, editors. Global perspectives on assistive technology: proceedings of the GReAT consultation. World Health Organization; 2019. p. 24–35 [Internet]. Available from: https://apps.who.int/iris/bitstream/handle/10665/330371/9789241516853-eng.pdf?sequence=1&isAllowed=y
- Decade of healthy ageing (2021–2030); 2022 [Internet] [cited 2022 Apr 8]. Available from: https://www.who.int/initiatives/decade-of-healthy-ageing
- Cook AM, Polgar JM, Encarnacao P. Assistive technologies: principles and practice. 5th ed. Elsevier Health Sciences; 2019 [Internet]. Available from: https://www.elsevier.com/books/assistive-technologies/cook/978-0-323-52338-7
- Assistive technology: definition and safe use. GOV.UK; 2022 [Internet] [cited 2022 Oct 13]. Available from: https://www.gov.uk/government/publications/assistive-technology-definition-and-safe-use/assistive-technology-definition-and-safe-use
- The Korean Law Information Center. Enforcement decree of the act on the support for assistive devices for persons with disabilities, older persons, etc. and promotion of use thereof; 2022 [Internet]. Available from: https://www.law.go.kr/engLsSc.do?menuId=1&subMenuId=21&tabMenuId=117&query=%EC%9E%A5%EC%95%A0%EC%9D%B8%EB%B3%B4%EC%A1%B0%EA%B8%B0%EA%B8%B0#
- ISO 9999. ISO; 2016 [Internet] [cited 2022 May 30]. Available from: https://www.iso.org/cms/render/live/en/sites/isoorg/contents/data/standard/06/05/60547.html
- Kim S. Findings and implications of disability survey 2017. Korean Institute for Health and Social Affairs; 2018 [Internet] [cited 2022 May 30]. Available from: https://repository.kihasa.re.kr/handle/201002/30509
- Rios A, Miguel Cruz A, Guarín MR, et al. What factors are associated with the provision of assistive technologies: the Bogotá D.C. case. Disabil Rehabil Assist Technol. 2014;9(5):432–444. doi: 10.3109/17483107.2014.936053.
- Groah SL, Ljungberg I, Lichy A, et al. Disparities in wheelchair procurement by payer among people with spinal cord injury. PM R. 2014;6(5):412–417. doi: 10.1016/j.pmrj.2013.11.004.
- Berardi A, Smith EM, Miller WC. Assistive technology use and unmet need in Canada. Disabil Rehabil Assist Technol. 2021;16(8):851–856. doi: 10.1080/17483107.2020.1741703.
- Review of datasets and their disability questions: method and results. Disability data initiative; 2022 [Internet] [cited 2022 May 18]. Available from: https://disabilitydata.ace.fordham.edu/reports/disability-data-initiative-2021-report/review-of-datasets-and-their-disability-questions-method-and-results/
- Rapid Assistive Technology Assessment tool (rATA); 2022 [Internet] [cited 2022 May 18]. Available from: https://www.who.int/publications-detail-redirect/WHO-MHP-HPS-ATM-2021.1
- Boggs D, Kuper H, Mactaggart I, et al. Estimating assistive technology need through population-based surveys: an analysis of data from Cameroon and India. In: Layton N, Borg J, editors. Global perspectives on assistive technology: proceedings of the GReAT consultation. World Health Organization; 2019. p. 52–78 [Internet]. Available from: https://apps.who.int/iris/bitstream/handle/10665/330371/9789241516853-eng.pdf
- World Health Organisation. Prevalence of coverage of assistive technology in the WHO European Region: a scoping review; 2021. Available from: http://apps.who.int/bookorders
- Matter R, Harniss M, Oderud T, et al. Assistive technology in resource-limited environments: a scoping review. Disabil Rehabil Assist Technol. 2017;12(2):105–114. doi: 10.1080/17483107.2016.1188170.
- IBM SPSS Statistics for Windows. Armonk (NY): IBM Corp.; 2017 [Internet]. Available from: https://www.ibm.com/uk-en/products/spss-statistics
- IBM SPSS Statistics for Windows. Armonk (NY): IBM Corp.; 2021.
- ATscale, AT2030. Product narrative: wheelchairs; 2019 [Internet] [cited 2020 May 19]. Available from: https://atscale2030.org/product-narratives
- Verza R, Carvalho M, Battaglia M, et al. An interdisciplinary approach to evaluating the need for assistive technology reduces equipment abandonment. Mult Scler. 2006;12(1):88–93. doi: 10.1191/1352458506ms1233oa.
- Global Cooperation on Assistive Technology (GATE); 2022 [Internet] [cited 2022 Oct 13]. Available from: https://www.who.int/news-room/feature-stories/detail/global-cooperation-on-assistive-technology-(gate)
Appendix 1
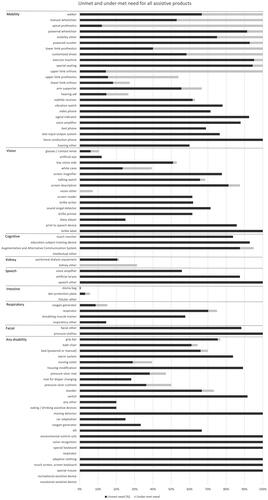
provides key AT indicators for all assistive products included in the national disability survey.
Figure A1. Unmet and under-meet need for all assistive products similar to , this horizontal histogram shows the proportion of need that is unmet or under-met for all included assistive products in the National Disability Survey, of which there are 77.