Abstract
This paper provides an historical overview of both the evolution of the economic performance of the developing world and the evolution of economic thought on development policy. The twentieth century was broadly characterized by divergence between high-income countries and the developing world, with only a limited number (less than 10% of the economies in the world) managing to progress out of lower or middle-income status to high-income status. The last decade witnessed a sharp reversal from a pattern of divergence to convergence – particularly for a set of large middle-income countries. The latter phenomenon was also driven by increasing economic ties among developing countries and, on the intellectual scale, increased knowledge generation and sharing among the developing countries. Re-thinking development policy implies confronting these realities: twentieth century economic divergence, the experience of the handful of success stories, and the recent rise of the multi-polar growth world. This paper provides descriptive data and a literature survey to document these trends.
1. Introduction
The industrial revolution marked a dramatic turning point in the economic progress of nations. Technological innovation created new tools that created the potential for a dramatic increase in productivity and living standards. During the nineteenth century, a number of technological leaders and early adapters leapt ahead of the rest of the world, while others lagged behind.
One might have expected that the twentieth century would have been a period in which technology spread across the world – allowing countries to catch up with advanced economies. This might have been achieved through trade and capital flows based upon continued progress in transportation and communication technology. In fact, the predominant neo-classical paradigm in economic thinking suggested that this would be the case.
Instead, the twentieth century was an unfortunate period of continued and accelerated divergence in living standards. In part, this may have been due to an interruption in trade and capital flows during the World Wars and the inter-war Great Depression that marked the first half of the twentieth century. Protectionism also persisted in many countries following the Second World War. It was only with the Uruguay Round of negotiations in the 1980s, leading to the eventual establishment of the WTO in 1995, that a clear institutionalized path towards trade opening was established. Meanwhile, technological progress in communications and transport – but especially communications – facilitated the acceleration of global trade and capital flows in the last quarter of the twentieth century.
On the other hand, there was a small group of exceptional cases of ‘catch-up.’ In addition, since the turn of the century, there has been reinvigorated growth in the developing world, especially in a number of large developing countries, such as Brazil, China, India, Indonesia, and the Russian Federation. There are numerous other countries that are taking advantage of growing trade and financial links – both with developed and developing countries – to accelerate economic growth. In brief, the global economy has entered a period of multi-polar growth with large developing countries leading the way as the new and most dynamic growth poles.
The next section provides a history of twentieth century divergence. We then provide an anatomy of the rise of the multi-polar growth world. This is followed by a critique of the history of development thinking and the need for a democratic approach to economic enquiry for development.
2 The challenge of economic development: historical antecedents and twentieth century divergence
Before the industrial revolution, there was little growth in the world economy and the income gap between countries was extremely small. For example, even in 1820, the between-country income differences represented less than 15% of income equality across people in the world, whereas the between-country share rose to well over half of global inequality by 1950,Footnote 1 and the richest country’s per capita income was only just less than four times higher than the poorest, and the richest countries’ per capita income is an astonishing 127 times higher than the poorest now (Maddison 2011). The industrial revolution led to the Great Divergence: world growth was driven by a few Western industrialized countries before the Second World War, and similarly after the Second World War – with the exception of Japan, which joined the group of advanced industrialized nations.
Maddison (Citation1982) divides the last 1500 years into four economic epochs: agrarianism, advancing agrarianism, merchant capitalism, and capitalism. The capitalism period started at the time of the industrial revolution. The new technology created the potential for new techniques of production that required organizational structures based on capitalist economic relations. It also represented the start of a period of unprecedented growth for the world economy (Table ).
Table 1. Growth rates in four economic epochs, according to Maddison (Citation1982).
Prior to the industrial revolution, the global economic landscape was dramatically different. Economies were largely based on agriculture and scientific progress was largely divorced from technological innovation in production (Lin Citation1995). Agricultural productivity was also similar across nations, and as a result, the largest poles of economic production were in fact the largest population centers. China and India together contributed about half of world GDP during the seventeenth and eighteenth centuries (Figure ).
Figure 1 China and India Shares of World GDP, Pre-Industrial Revolution, percent. Source: Author’s elaboration based on data from Maddison (2010).
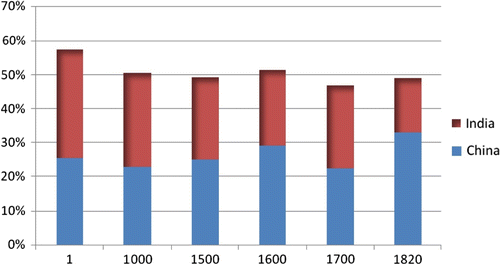
It should be noted that the calculation of the contribution to growth over these centuries is somewhat misleading, given that annual growth rates were minimal, as displayed in Table . China and India dominated merely based on the size of their populations, and economic production was largely driven by the need to produce enough food for the masses to survive and for the small elite to preserve their higher standards of living.
2.1 The industrial revolution and the great divergence
All of this changed with the industrial revolution. Scientific progress began to be applied to the means of production as machines were developed that both increased productivity in firms, but also dramatically reduced transportation costs. This created the possibility for the countries that developed those technologies, or those that adapted the technologies first, to grow much faster than less technologically advanced countries.
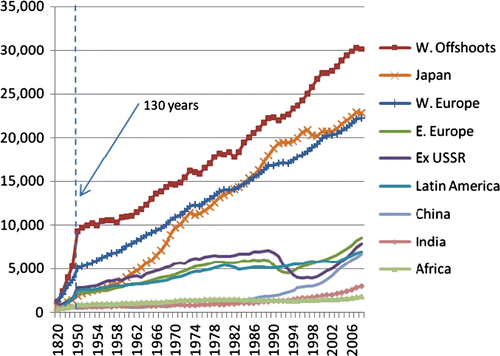
The result of this process was that (at least prior to the year 2000) the global economy was dominated by the few industrialized economies that existed in the world, and most of these few economies had become industrialized either as leaders or earlier followers of the nineteenth century industrial revolution. Lin (Citation1995) argues that the transition from innovation based on the experiences of artisan/farmers in the pre-industrial revolution period to innovation based on controlled experiments guided by science after the industrial revolution was the key factor. Societal incentives in pre-modern China did not favor the move toward the human capital accumulation needed for the new system of innovation. Historical data (Figure ) dramatically reveal the divergent pattern of growth across country groupings. In the late nineteenth century, the Western European countries and their colonial ‘offshoots’ began to experience an historic take-off in incomes per capita. This was later matched by Japan in the middle of the twentieth century. The world economy was driven by several large Western European countries (Germany, France, Italy, the United Kingdom) and Anglophone ‘offshoots’ (Australia, New Zealand, the United States, and Canada), plus Japan. Many other countries, including the former Soviet Union, were able to rise to middle-income status and experience levels of average economic welfare that far surpassed prior centuries; however, these standards of living still lagged badly behind the leading countries. In brief, the global economy was dominated by the so-called ‘G7’.
Figure 2 Development since the industrial revolution. (Per capita GDP measured in 1990 Geary-Khamis PPP adjusted dollars.) Source: Author’s elaboration based on data from Maddison (2010).
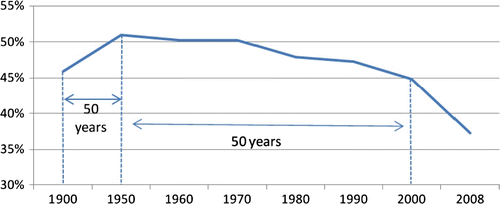
One can see the significance of these few large economies both in terms of their shares of global economic output and in terms of their contribution to economic growth. During the twentieth century, the G7 maintained a large and fairly stable share of world gross domestic product (Figure ) that started and ended the century at about 45%. There was a slight rise to 51% during the first half the century that was reversed during the second half of the century.
2.2 Low and middle income country growth ‘traps’
In principle, one would expect, and certainly hope, that the poorer countries in the world can catch up with the richer countries in the world. Unfortunately, few countries have experienced ‘convergence’ on a sustained basis. In fact, one famous paper that discusses the performance during the twentieth century is entitled: ‘Divergence, big time’ (Pritchett, Citation1997).
One approach to measuring relative progress is to look at per capita GDP relative to the United States, which has been the symbol of advanced industrialized countries after the Second World War. Figure shows that the shares of countries in each ratio range have been fairly stable, with some growth in the percentage of countries in the upper MIC range (say, roughly 0.3–0.7), but really not much expansion of the share of countries that are at 0.7 of the US level of per capita GDP. At the bottom end, the share at 0.1 or less of US levels remains stuck near 40%. Persistently, over 80% of the countries in the world have GDP per capita levels that are half or less than half of the level in the United States.
Figure 4 Distribution of countries by (relative) income classification, 1900–2008, percent. Source: Authors’ calculations based on Maddison (2010) data.
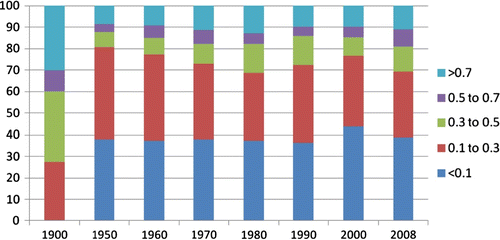
There is also some ‘churning’ where countries not only converge up the ladder, but also diverge down the ladder. This is the case of some former colonies in Africa: many have gone from being lower MICs at independence to LICs in 1980. Since then, some have climbed back up to MIC status. There are also countries at the HIC end of the distribution that have fallen back to MIC status, by this measure.
The net result is that, during the twentieth century, very few countries managed to progress from low income status to middle income status and then to high income status. Part of this history was explained in the previous sections, and hopefully, the recent rise of a number of large MICs marks the beginning of a better century for developing country convergence. That said, Table summarizes how only a handful of developing countries have succeeded in reaching high levels of prosperity, and many of them are in Western Europe. The few developing economy success stories – with the exception of a few small oil rich countriesFootnote 2 – are generally located in East Asia and achieved rapid industrialization by following comparative advantage export dynamism, helped by the facilitating role of the state.Footnote 3
Table 2. Rare cases of catch-up. (Economies with a greater than 0.10 increase in relative GDP per capita with respect to the United States.)
To make matters worse, more than a dozen countries suffered a greater than 0.10 decline in relative GDP per capita over the same period. Table displays the list. Many of these countries are middle-income countries that failed to keep pace with the 2% GDP per capita growth of the United States over this period. In addition, several oil-producing countries failed to diversify their economic base and, as a result, have experienced large declines in their relative income per capita.
Table 3. Divergence ‘leaders’. (Countries suffering a 0.10 or greater decrease in relative GDP per capita with respect to the United States.)
3 The rapid growth of a few large economies and the rise of the new growth poles
While there was progress in development during the twentieth century, the G7 countries still dominated the global economy in terms of size, contribution to economic growth and living standards. This dominance began to decline dramatically during the first decade of the twenty-first century – in particular, due to the fast growth of large dynamic emerging economies – the so-called ‘BRICs’ (Brazil, Russia, India and China). As a result, the G7 share of global GDP declined rapidly from 45 to 37% in just 8 years (Figure ). This is an unprecedented and historic shift. After a remarkable degree of G7 dominance for an entire century, one decade of extraordinary growth has caused a dramatic shift in the balance of economic power.
The BRICs and other emerging economies also have increased their share of trade, capital flows and innovation. A growing trend within these dimensions is ‘south-south’ globalization as economic interactions between emerging markets have increased at an even faster pace than they have between high-income countries and developing countries. As growth poles emerge in the developing world, one way that the more rapid growth could be sustained is through increased ‘south-south’ globalization.
To understand the patterns of south-south globalization, one can start by examining the evolution of the large fast-growing BRICs. In the trade dimension, after decades of stagnation in the developing country share of world exports, this share began to increase sharply at the turn of the century, and it now stands at about 30%. We see, however, that much of this recent evolution was driven by the increasing share from BRIC countries (Figure ). The BRIC share more than doubled from 2000 to 2009. A large part of the story has to do with increasing trade between developing countries – a trend that actually dates back a couple of decades (Figure ) – as south-south bilateral and regional trade agreements proliferated and as supply chains integrated across the developing world. The share of developing country imports that originate in other developing countries is now nearly double the share of the 1960s. The old global division of labor characterized by developing countries (the ‘south’) exporting primary products to the high income countries (the ‘north’) to produce manufacturing goods has become much more complex, with increasing south-south trade in primary products (Figure ). Some key developing economies (e.g., China, Figure ) are now specializing in the export of manufacture (Abraham and Van Hove, 2011). All these phenomena are related: the same Chinese manufactures embody a combination of primary imports from developing countries, as well as intermediate inputs from emerging Asia, in addition to Japan, Taiwan, China, and Korea. This is a natural consequence of trade integration both within the developing world and between developing and high-income countries.
Figure 5 (a)–(d) Trade and the multi-polar growth world. Source: Authors’ elaboration based on data from World Development Indicators (2011) for (a) and (b) and World Integrated Trade Solution (WITS) (2001) for (c) and (d).
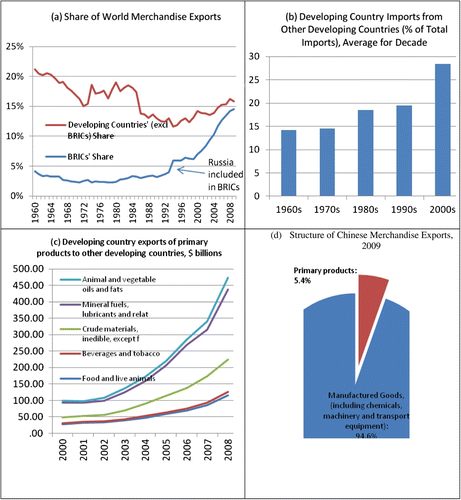
Drilling down in more detail into evolving patterns of trade, one can see that most of the export growth in dynamic emerging markets is not primarily driven by increasing exports to the traditional economic powers. Instead, increasing integration across emerging markets is the driving factor. For example, developing countries in Latin America and the Caribbean (LAC) have rapidly increased their exports to developing countries in East Asia – most notably China (Figure ). LAC imports from emerging Asia, and especially China, have increased even faster (Figure ). To some extent, there may be some re-importing of primary exports that have then been processed into manufactures in Asia. This is a phenomenon that is discussed in more detail below.
Figure 6 (a)–(f) Changing trade patterns in developing countries – LAC and Brazil focus. Source: Author’s calculations based on WITS (2001) database.
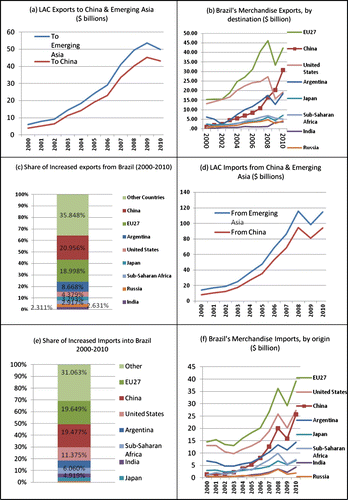
Focusing on Brazil – the largest economy in Latin America – one can see rapid export growth to a wide variety of destinations over the last decade (Figure ). Most of that growth was not driven by traditional growth poles such as Europe, the United States and Japan. These countries (EU27, US, Japan) absorbed only about a quarter of the increase in Brazil’s exports during the first decade of the century. Europe still had an important contribution (nearly 20%); however, China’s contribution was larger (Figure ). Growth in exports to the United States contributed a mere 4.4% to total export growth, and exports to a vast array of countries around the world comprised over a third of the increase in exports. On the side of imports, we see a similar pattern.
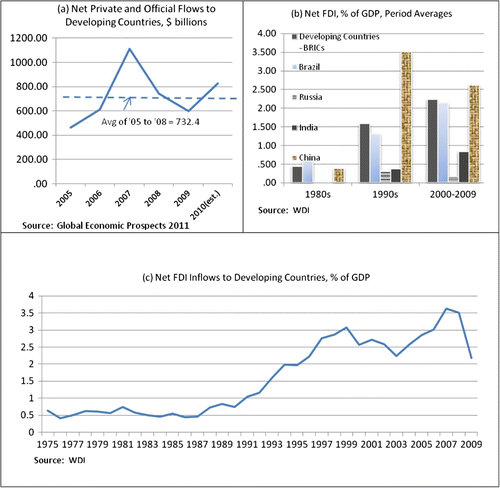
Capital flows have been an important factor in the changing multi-polar landscape. Developing countries were receiving record levels of FDI and other capital flows prior to the global financial crisis. Naturally, there was a decline in these flows following the boom; however, flows have continued to be in line with the average of the 3 to 4 years preceding the crisis (Figures and 7(b)). In addition, starting since the mid-1990s there has been a general shift up in annual FDI flows as a share of developing countries’ GDPs (Figure ). There is also a rise in south-south investment flows, even though the largest flows remain among the high-income countries. Recently published data from the IMF are difficult to analyze systematically due to many missing data points; however, there are specific cases where the data reveal the surprisingly large influence of south-south flows. For example, Hong Kong SAR, China is the tenth largest source of outward direct investment positionsFootnote 4 globally, and South Africa’s direct investment position in China (mainland) is slightly larger than that of traditional economic power France.Footnote 5
Figure 7 (a)–(c) Capital flows to developing countries. Source: Authors’ elaboration based on data from Global Economic Prospects (2011) for (a) and World Development Indicators (2011) for (b) and (c).
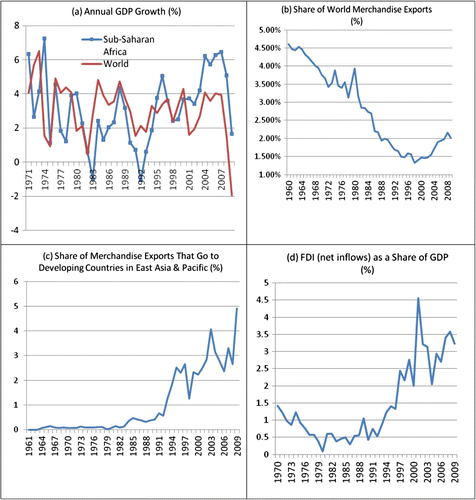
While large emerging markets grab the headlines of multi-polar growth, smaller and poorer economies have also experienced important changes in their position in the global economy. For example, in terms of accelerating growth and expanding trade and capital flows, the Sub-Saharan Africa region has also participated in the recent multi-polar growth decade. GDP growth in the region as a whole has accelerated sharply. There were 11 countries in the region – among 29 countries in the world – that averaged economic growth of 6.5% or more prior to the global financial crisis.Footnote 6 Overall, the region’s aggregate GDP has grown faster than the world economy, its export share of total world exports has increased, its share of exports going to fast growing emerging Asia destinations has increased, and FDI has been higher than most developing countries (as a share of GDP) (Figures –8(d)). As the earlier figures on Brazil showed (Figures and 6(f)), Sub-Saharan Africa has increased its trade links with that country. In brief, Sub-Saharan Africa has become a beneficiary and contributor to the new multi-polar global economy – even if on a smaller scale than other developing regions.
Figure 8 (a)–(d) Sub-Saharan Africa in the new multi-polar growth world. Source: Elaborated by the authors based on data from the World Development Indicators (2011).
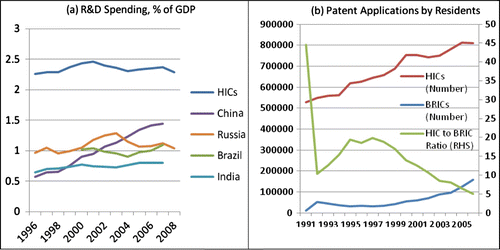
Technology is also part of the story. From both theory and practice, we expect developing countries to lag the high income countries in technology, since the latter are at the technological frontier in most products that they produce. That said, one would expect the more dynamic middle-income countries to begin to move up the technological ladder as they move up the per capita income ladder. In addition, there are sectors in middle income countries that are reaching (or have already reached) the technological frontier. As a result, one would expect these countries to begin to invest more in research and development and begin to produce more homegrown technological innovation. While the data may not be the most reliable, the Figures and 9(b) show that there has been some catch-up in total R&D spending and in the number of patent applications in the new BRIC growth poles. Particularly noteworthy is that China has more than doubled its total R&D spending as a share of GDP. While patent applications lag the high income countries, the ratio has fallen substantially from over 40 HIC patent applications for every BRIC resident application to only about 5 HIC applications for every BRIC application.
Figure 9 (a) and (b) R&D and patent applications. Source: Elaborated by the authors based on data from the World Development Indicators (2011).
The rise of the new emerging market growth poles is extremely welcome; however, it would be a mistake to fall into complacent triumphalism. The remaining challenges facing the new growth poles, specifically, and the developing countries, generally, are substantial. As noted in the previous section, very few countries have succeeded in progressing from low-income status to middle-income status and on to high-income status. This discussion leads to the new challenges facing the new middle-income growth poles themselves. In some cases – for example, China – growing income inequality poses a challenge for policy makers to adjust the economic structure in a way that spreads the benefits of growth more broadly – with a special eye to lagging incomes in rural areas (Dincer and Wang, 2011). In addition, the environmental consequences of rapid growth in the new growth poles pose a risk for the sustainability of current growth patterns. Environmental problems have multiplied in all the BRIC countries. In addition, as income levels rise, so do wages, generally speaking. In a globalized economy, this implies that the new growth poles will need to continuously upgrade their industrial structures to either find new product niches or improve productivity in existing product lines. All of these challenges create the scope for improved national development policies to overcome these challenges and secure continued development progress.
4 Rethinking economic development
The stylized facts elaborated in the preceding section require a response from the economics community to provide policy guidance. Why was there so little convergence in the twentieth century? What was special about the few countries that ‘escaped’ middle income status? What is behind the rise of the multi-polar growth and the BRICS? Can it be sustained? Can their success be replicated in the laggard countries?
The challenges faced by countries vary substantially across levels of development. Unfortunately, development economics has not always provided useful policy guidance in the past, and may be unable to do so in the future as well. As we will see below, often broad policy prescriptions were formulated to cure the problems of developing countries as a group, and often these prescriptions used the rich countries as a reference point. Waves of economic thought either focused on isolating developing countries from the perceived inequity in the global economic system or on blindly imitating and opening economies to the developed world. These one-size-fits-all policy prescriptions failed to examine sufficiently the structural bottlenecks, as well as the structural advantages that an individual economy might offer, given its existing endowment and current status of its institutions (Clifton and Díaz-Fuentes, 2011). There was often only limited recognition of how economies require different policies at different stages of development, as we will explore in more detail below. As a result, many mistaken policy prescriptions were offered.
Part of this checkered past may be due to a correlation between economic prominence and influence in the market place for economic ideas. To some extent, there may be a natural tendency in human nature to try to imitate success. The dominance of the few industrial powers that emerged from the industrial revolution was based on their advanced manufacturing industries. Many developing countries’ economies, however, were still based on natural resource intensive sectors for export revenue, and these were seen as ‘backward’ rather than advanced sectors. Therefore, after the Second World War, not only the socialist camp (which was influenced by Marxism and the Soviet Union’s Stalinist model) but also ‘western’ developing thinking (represented by the ‘structuralist’ school) advised the developing countries to use the state’s power to overcome market constraints by directly mobilizing resources to develop the advanced countries’ industries. The results of this approach were disappointing.
A major motivation for the structuralist school of thought was the so-called Prebisch-Singer hypothesis.Footnote 7 Starting with the empirical observation of a long-term decline in commodity prices relative to industrial goods, the hypothesis suggested that the global trading system was essentially ‘rigged’ against developing countries in favor the advanced countries. Productivity gains in the traditional agricultural sector would result in price declines for those commodities that would translate to gains for advanced country consumers. Meanwhile, productivity gains in industry would accrue increased profit for entrepreneurs.
More generally, structuralism rejected the notion that the invisible hand of the free market could guide the process of development. There was a rejection of classical and neoclassical views that factor accumulation would occur naturally, and that resources would shift naturally to their highest return activities, responding to market prices with frictionless movement across sectors. The term ‘structuralism’ itself comes from the notion that structural rigidities are present in most economies, and in particular in countries at low levels of development. It argues that these rigidities inhibit the structural transformation necessary for economic growth and development (see Table for a description of this chronology). These rigidities would also cause distortions in factor prices, creating unclear signals about a country’s comparative advantage. As noted in Chenery (Citation1975), “A common theme … is the failure of the equilibrating mechanisms of the price system to produce steady growth or a desirable distribution of income.” There was already the empirical observation that industrialization was at the core of progress in advanced economies; however, structuralists believed that structural rigidities in developing countries would prevent this process of industrialization, and ‘self-sustained’ growth could not become a reality without more interventionist government policies.
Table 4. Brief chronology of development economics thinking.
Structuralists promoted the view that developing countries needed to copy, to some extent, the industrial structure of the high income countries. In providing both protection and investment incentives for these new industries, little attention was paid to whether the sectors that developed were compatible with the developing country’s comparative advantage, since (as noted above) it was assumed that factor markets were in disequilibrium and that factor prices were distorted. Since the latter part of the industrial revolution and into the twentieth century, the advanced economies had accumulated substantial amounts of capital. In addition, new goods were developed – for example, the automobile – that involved increasingly high capital intensity for production. As ‘structuralism’ emerged, many of the advanced industries that developing countries wanted to imitate were highly capital intensive. Meanwhile, the developing countries’ endowments were characterized by high levels of labor – particularly unskilled labor – and in some cases, abundance of natural resources – land, minerals and oil. As a result there would be a violation of countries’ comparative advantage in imitating advanced countries’ industries. In addition, there was a challenge in financing the large capital investments for capital intensive industries, and a number of developing countries eventually relied on foreign capital in this regard.
As noted above, if factor prices were distorted, then subsidies or direct price manipulation could be justified, according to many adherents of the structuralist framework. For example, in capital markets, interest rates were often held artificially low, which in theory should have helped finance capital intensive industries; however, the policy often led to the phenomenon of ‘financial repression’Footnote 8 which simply lowered saving mobilization and stunted financial sector development. In many countries, trade restrictions on imports were accompanied by real exchange rate overvaluation. This overvaluation along with trade distortions often led to a degree of ‘taxation’ of the traditional agricultural sector.Footnote 9
Many industries in developing countries did not manage to take off despite the many government efforts to support them. Since these sectors did not follow the countries’ comparative advantage, continued support from government was necessary for their survival. On their own, they simply could not compete in the global economy. In addition, in the 1970s, many developing countries used increased access to foreign borrowing as a means of financing the expensive distortions and investment required for the import substitution industrialization model.
The failures of the structuralist approach led to the ‘neoliberal’ Washington Consensus (see Williamson, Citation2004, 1990). The original ten areas of the Washington Consensus were: (i) fiscal discipline; (ii) reordering public expenditure priorities; (iii) tax reform (broad base with moderate rates); (iv) liberalizing interest rates; (v) competitive (not overvalued) exchange rates; (vi) trade liberalization; (vii) liberalization of inward foreign direct investment; (viii) privatization; (ix) deregulation; and (x) property rights (for the informal sector). In many ways, the Washington Consensus was a reaction to the complex web of distortions that had to be created to try to support competitive advantage defying import substitution.
In end, the Washington Consensus advised the developing countries to adopt the ‘idealized’ advanced countries’ institutions – namely, implementing the privatization, liberalization and stabilization reforms to build institutions for well-functioning free markets – without paying attention to the following facts. First of all, the various distortions in the developing countries might have been second-best arrangements endogenous to the structuralist development strategy itself, removing those distortions does not necessarily result in a welfare improvement and a return to the first-best situation; and secondly, appropriate institutions may differ depending on the level of development in a particular country, the first-best institution for the advanced countries is not necessarily the first-best for developing countries. In brief, the focus shifted from trying to copy industries to trying to copy the idealized market institutions of the high-income countries. The results of the policies presented as alternatives to the failed old structuralism were at best controversial (see Easterly Citation2001, Citation2005; Stiglitz and Ellerman, Citation2001; World Bank Citation2005). The Washington Consensus quickly came to be perceived as “a set of neoliberal policies that have been imposed on hapless countries by the Washington-based international financial institutions and have led them to crisis and misery” (Williamson Citation2002).
Later, development thinking would incorporate other trends from the broader economics profession, and in particular, growth theory. A focus on human capital dates back to the 1970s (see Table ); however, new growth theory highlighted the role of ‘endogenous’ innovation that leads to sustained economic growth in the most advanced economies. Frustrated by the persistence of poverty and the new thinking, bilateral donors and the international development community shifted their focus to humanitarian projects for supporting the improvement of human capital, including education and health in developing countries. The poor service delivery in those humanitarian projects called for the attention on country specificity in the project design and implementation. New techniques were developed – such as randomized control trials and other forms of impact evaluation – in order to understand better what works at the micro level of service delivery and policy reform. As part of a more pragmatic approach, some economists spent more time trying to understand the structure of domestic economies and domestic institutions in order to deepen their understanding of why some countries succeeded, while others failed.
The countries that successfully accelerated their growth and closed the gap with developed countries did not follow the approaches proposed by the dominant development thinking of that time. Japan and the East Asian ‘tigers’ followed export-oriented growth strategies instead of the old structuralist import substitution model that was popular during the 1950s and 1960s. The strategy led to much faster export growth. For example, since 1960, Latin American and Caribbean exports grew at an average of 5.4% per year, while they grew by 17.8, 10.5 and 8.6% in Korea, Thailand and Malaysia, respectively. China’s export growth has averaged about 13% since 1979.Footnote 10
Similarly, China, Vietnam and Mauritius followed the dual-track approach for gradually moving toward a more market-based economy – sometimes referred to as an ‘Asian approach’ (Rana and Hamid Citation1995; Chang and Noland Citation1995).Footnote 11 This contrasts with the sharp economic contractions experienced in Eastern European countries following the ‘shock therapy’ approach that had become popular in the economics profession in the early 1990s.Footnote 12
China is a prime example. Instead of wholesale privatization of state-owned enterprises, the government continued its ownership of many enterprises and gave them preferential access to subsidized credit. Simultaneously, in many sectors, the government also allowed private enterprises – including joint ventures – to enter into competition. This approach was once asserted to be the worst possible transition strategy – one that would invite rent seeking and corruption and result in unavoidable economic collapse (Sachs et al. Citation2000). However, instead of collapsing, China has been the most dynamic economy in the world over the past three decades. Gradually, the Chinese economy has moved close to becoming a fully fledged market economy (Naughton Citation1995) while simultaneously achieving the Pareto improving result of ‘reform without losers’ (Lin et al. Citation1996; Lau et al. Citation2000; Lin Citation2012a).
What the Washington Consensus ignored, however, was that in countries that adopted a CAD strategy there existed a multitude of non-viable enterprises that had emerged over the years. Without government protection and subsidies, those enterprises were unable to survive in an open and competitive market. Had there been only a limited number of such non-viable enterprises, the output value and employment of those enterprises would have been small, and ‘shock therapy’ to eliminate all government interventions at once could have been applied successfully. With the abolition of government protection and subsidies, these non-viable enterprises could become bankrupt, but this effect would be overcome by the previously suppressed labor-intensive industries that would thrive following reforms. The newly created employment opportunities in these industries, under these circumstances, can surpass the losses from the bankruptcy of non-viable firms. In theory, the economy can grow dynamically soon after implementing the shock therapy, with at most a small initial loss of output and employment – another hypothetical version of ‘reform without tears.’
On the other hand, if the number of non-viable firms is too large, the output value and employment of those firms will make up too large a share of the national economy and shock therapy may be self-defeating. Economic chaos may ensue due to large-scale bankruptcies and dramatic increases in unemployment. The resulting chaos can force the hand of government into sustaining the non-viable enterprises – often resorting to ever increasing protection and subsidies for these firms – either explicitly or implicitly – and often in a more disguised way. In some cases, even if the firms are privatized, soft-budget constraint problems will continue. The subsidies to the non-viable firms post-privatization could even increase due to the private owners’ even greater incentives to lobby for subsidies and protection (Lin and Li Citation2008). In effect, this is what happened in Russia and many other countries in Eastern Europe and the former Soviet Union (Pleskovic Citation1994, Lavigne Citation1995, Brada Citation1996, Frydman et al. Citation1996, Stark Citation1996, World Bank Citation2002). In the end, the economy can find itself in the unfortunate situation of shock without therapy (Kolodko Citation2000).
In brief, the experience of a number of countries that have pursued gradualist reform strategies shows that this approach is often far superior to shock therapy. The pragmatic, two-track approach avoided some of the pitfalls of the shock-therapy that was often prescribed following the downfall of the Soviet Union.Footnote 13
In addition, successful transition requires the creation of new industries. The distortion removal agenda of the Washington Consensus neglected to include any positive policies to facilitate the entry of firms into these new sectors. A successful development strategy that will facilitate the structural change for successful transition can be based upon the principles outlined in the New Structural Economics (NSE) and its policy implementation via the Growth Identification and Facilitation Framework.Footnote 14 The NSE highlights that a country’s economic structure is endogenous to its endowment structure; however, the government needs to play a facilitating role and this role needs to be structured according to clearly defined principles.
First, for an economy to be competitive in both the domestic and international market, it should follow its comparative advantage, as determined by its endowment structure. In the early stages of development, sectors in which the economy has comparative advantage will be labor or resource intensive. Examples include light manufacturing, smallholder agriculture, fishing and mining. Only a few activities, such as mining are likely to be capital intensive in this early stage. In the later stages of development, the competitive sector will become increasingly capital intensive, as capital accumulates, thus changing the country’s endowment structure. In the industrial upgrading toward more capital intensive production, infrastructure needs to be improved to reduce the firms’ transaction costs, and there is a clear role for government to play in this regard.
Secondly, if a country follows the above principle, its factor endowment upgrading will be fast (due to large profits from the competitiveness of the economy and a high return to investment), and its industrial structure should be upgraded accordingly. The upgrading involves information creation (for example, in which new industries to invest), coordination needs – improvement in ‘hard’ (e.g., transport) and ‘soft’ (institutional) infrastructure – and externalities (‘first movers’ to followers). All of these aspects involve coordination, externalities or public (semi-public) goods that the market will not automatically resolve on its own. The government needs to play a facilitating role to help the private sector overcome these issues in order to achieve dynamic growth.
A practical approach for the government to operationalize the NSE is laid out in the six steps of the Growth Identification and Facilitation Framework.Footnote 15 In summary, the six steps are: (i) identify the list of tradable goods and services that have been produced for about 20 years in dynamically growing countries with similar endowment structures and a per capita income that is about 100% higher than their own; (ii) among the industries in that list, the government may give priority to those in which some domestic private firms have already entered spontaneously, and try to identify the obstacles that are preventing these firms from upgrading the quality of their products or the barriers that limit entry to those industries by other private firms; (iii) some of those industries in the list may be completely new to domestic firms, and the government could adopt specific measures to encourage firms in the higher-income countries identified in the first step to invest in these industries; (iv) governments should pay close attention to successful self-discoveries by private enterprises and provide support to scale up those industries; (v) in developing countries with poor infrastructure and an unfriendly business environment, the government can invest in industrial parks or export processing zones and make the necessary improvements to attract domestic private firms and/or foreign firms that may be willing to invest in the targeted industries; and (vi) the government may also provide limited incentives to domestic pioneer firms or foreign investors that work within the list of industries identified in step (i) in order to compensate for the non-rival, public knowledge created by their investments.
4.1 The need to democratize development economics
Why is now the time to democratize development economics? Continuous technological innovation and structural change is inherent in modern economic growth in both developed and developing countries; however, the policy challenges for achieving growth differ between developed and developing countries. The difference is derived from the fact that industries in the developed countries are generally on the global technological frontier, while industries in developing countries are within the global frontier. The former requires indigenous innovation in technology to push the frontier outward. For the developing countries, the challenge is to develop their economies according to their comparative advantages (as discussed in the previous section), and to tap into the latecomer advantage of adopting already existing technology. There are different policy challenges for indigenous innovation versus efficient adoption – as a result, the policy framework should not be identical. Middle-income countries generally possess industries that represent a mix of frontier technology and less advanced technology.
The economic theories that originate in developed countries attempt to explain and promote the growth in the developed countries; as such, they may not be relevant to developing countries because of the differences in the challenges and opportunities discussed above. Meanwhile, successful developing countries have generated many useful lessons for how to achieve dynamic growth. Their experiences will be more relevant for other developing countries than the experiences of the developed countries because of the similarity of their opportunities and challenges.
Most economic theories are produced by economists in developed countries with the intention to explain economic phenomena in developed countries or by economists who use developed countries as reference to explain phenomena in developing countries (such as structuralism and the Washington Consensus). As noted in Lin (Citation2012b), many economic and social constraints to development differ across countries and/or across time.
The validity of a theory hinges on the conformity of the theory’s explicit and implicit conditions for its causality to work. As noted in Lin (Citation2012b), economic theory must have a coherent internal logic, but also be subject to the test of consistency with empirical data.
Most developing countries that followed the dominant development theories to design development policies failed to achieve the goal of narrowing the income gap with developed countries. Most of those that achieved the catching up did not follow the dominant development theories. These basic stylized facts, in and of themselves, should be ample rationale for rethinking economic development on a more democratic basis – one that builds on developing countries’ own ideas and experience. China, with its remarkable economic success of recent decades is a case in point. Lin (Citation2012b) argues that Chinese economists have a natural comparative advantage in understanding China’s own unique development experience.
The theories and experiences that are generated from developing countries will be more relevant for other developing countries, due to the similarity in their opportunities and constraints. There are many areas where policy innovation has come from the developing world itself. In terms of macroeconomic stabilization, Chile has developed a cyclically adjusted fiscal rule that is a global model – for rich and poor countries alike. Africa could learn from Brazil’s successful models for expanding agricultural production in regions with similar climatic and soil conditions. Innovative social policies in Brazil and Mexico – conditional cash transfers – have been adapted and adopted in numerous other developing countries and even rich countries (e.g., local programs in New York City). Experiments with export processing zones in Mauritius and other countries have helped us understand how best to design these interventions. East Asian economies, including Japan, Korea, China, Singapore, Indonesia and others, provide many useful experiences of developing from backward agrarian economies to modern industrialized economies through the state’s facilitation in a market-based mechanism. The research and publications from economists working in developing countries have, and will continue to, greatly enrich development economics.
The increase in the trade, financial flow, and the research capacity in developing countries will contribute to the exchange of ‘south-south’ experiences. With the rising of the multi-polar world, the research capacity in the developing world has improved. It can be expected that more research and theories will be produced by economists in developing countries with the intention to explain the phenomena in developing countries. This research will enrich development economics and make development economics more relevant and effective as a policy framework for developing countries.
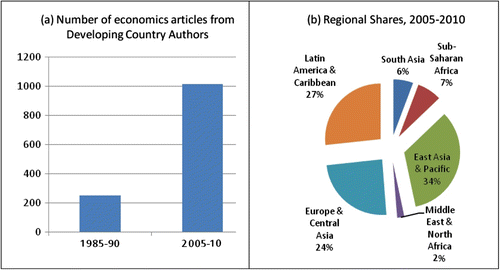
Figure provides data on the growth of economics articles by authors from developing countries, by region of origin. This figure shows a sharp growth in quantity; however, the growth is concentrated in only three regions of the developing world.
Figure 10 (a) and (b) Increase in economics research by developing country authors. Source: Authors’ elaboration based on data from Adam Wagstaff’s contribution to the Let’s Talk Development blog of the World Bank. Posted January 14, 2011 under the title ‘The (gradual) democratization of development economics’. The authors would like to thank Mr. Wagstaff for sharing this data.
As a result, the thinking that may have direct relevance for developing countries’ development is likely to come increasingly from the developing countries themselves. As such, a key phrase that would dominate the agenda is to “democratize development economics.”Footnote 16
5 Concluding remarks
As documented above, the global economy has evolved from a period of dramatic divergence in income per capita to an incipient convergence. Not only are developing countries playing a larger role in global economic growth, the economic relations between developing countries have increased dramatically. The developing countries are contributing more to development knowledge – both through home-grown academic research and through the practical experience gained from successful policies and programs. This new reality raises a challenge for development economists to be more inclusive and open in their approach to understanding the development process. It is only then that we are likely to fully understand why divergence occurred in the 20th century, why some countries escaped this fate, and how to promote, consolidate and expand the continued convergence process that has now begun.
The views presented here are the authors’ and do not necessarily represent the views of the World Bank.
Notes
1. See Bourguignon and Morrisson (Citation2002) for a calculation of global inequality since the start of the industrial revolution and a decomposition between within-country and between-country inequality. The figures referred to here are from Theil Index and Mean Logarithmic Difference measures. The between country share is larger for the ‘standard deviation of logarithm’ method; however, the same trend is followed: a lower share of between-country differences that then grows dramatically in the twentieth century. See Table of Bourguignon and Morrisson for more details.
2. This is the case for Equatorial Guinea, Trinidad and Tobago and Oman.
3. See Lin (Citation2012c).
4. Data from IMF’s Coordinated Direct Investment Survey (CDIS), Table 5-o.
5. See IMF, CDIS, Table 6.1o. The direct investment position of South Africa is $13.7 billion, while it is $11.6 billion for France.
6. This is based on a simple average GDP growth rate over the 2000–2008 period using data from the World Development Indicators.
7. The seminal papers are Prebisch (Citation1950) and Singer (Citation1950). For a more recent survey of the issues, see Bruton (Citation1998). There are also recent studies of the empirical observation of declining relative primary commodity prices, as in Harvey et al. (Citation2010).
8. See Fry (Citation1980, Citation1997) for a discussion of financial repression and later financial liberalization. Lin (Citation2009) and Lin et al. (Citation2009) provide a theory of optimal financial structure as a function of a country’s stage of development.
9. Krueger et al. (Citation1992) developed a methodology to quantify the degree of taxation and applied it to a variety of developing countries in a five volume compendium.
10. Data are from World Development Indicators, simple average growth rates.
11. See Lin (Citation2009).
12. See, for example, Sachs (Citation1993).
13. This discussion of the two track reforms draws on Lin (Citation2009).
14. See Lin (Citation2012c).
15. See Lin (Citation2012c).
16. See World Bank President Robert Zoellick’s speech, ‘Democratizing Development Economics,’ delivered at Georgetown University on September 29, 2010.
References
- Abraham, F., and Van Hove, J. Chinese competition in OECD markets: impact on the export position and export strategy of OECD countries, Journal of Economic Policy Reform, 14 (2) 151–170.
- Acemoglu , Daron . 2003 . Labor- and capital-augmenting technical change . Journal of European Economic Association , 1 : 1 – 37 .
- Aghion , P. and Howitt , P. 1992 . A model of growth through creative destruction . Econometrica , 60 ( 2 ) : 323 – 351 .
- Aghion , P. and Tirole , J. 1994 . The management of innovation . The Quarterly Journal of Economics , 109 ( 4 ) : 1185 – 1209 .
- Bannerjee , A.V. and Duflo , E. 2001 . Poor economics: a radical rethinking of the way to fight global poverty , New York : PublicAffairs (Perseus) .
- Bourguignon , F. and Morrisson , C. 2002 . Inequality among world citizens . American Economic Review , 92 ( 4 ) : 727 – 744 .
- Brada , J.C. 1996 . Privatization is transition, or is it? . Journal of Economic Perspectives , 10 ( 2 ) : 67 – 86 .
- Bruton , H.J. 1998 . A reconsideration of import substitution . Journal of Economic Literature , 36 : 903 – 936 .
- Chang , H.J. and Noland , P. 1995 . “ Europe versus Asia: contrasting path to the reform of centrally planned systems of political economy ” . In The transformation of the communist economies , Edited by: Chang , H.J. and Nolan , P. 3 – 45 . London : Macmillan Press .
- Chenery , H.B. 1975 . The structuralist approach to development policy . American Economic Review , 65 ( 2 ) : 310 – 316 .
- Clifton , J. and Díaz-Fuentes . 2011 . The OECD and Phases in the International Political Economy, 1961–2011 . Review of International Political Economy , 18 ( 5 ) : 552 – 569 .
- Dincer , O.C. and Wang , F. 2011 . Ethnic diversity and economic growth in China . Journal of Economic Policy Reform , 14 ( 1 ) : 1 – 10 .
- Easterly , W. 2001 . The lost decades: explaining developing countries’ stagnation in spite of policy reform 1980–1998 . Journal of Economic Growth , 6 ( 2 ) : 135 – 157 .
- Easterly , W. 2005 . What did structural adjustment adjust? The association of policies and growth with repeated IMF and World Bank adjustment loans . Journal of Development Economics , 76 : 1 – 22 .
- Fry , M. 1980 . Saving, investment, growth and the cost of financial repression . World Development , 8 ( 4 ) : 317 – 327 .
- Fry , M. 1997 . In favour of financial liberalisation . The Economic Journal , 107 : 754 – 770 .
- Frydman , R.C.W.G. and Rapaczynski , A. , eds. 1996 . Corporate governance in central Europe and Russia, Volume 2: insiders and the state , Budapest : Central European University Press .
- Harvey , D.I. , Kellard , N.M. , Madsen , J.B. and Wohar , M.E. 2010 . The Prebisch-Singer hypothesis: four centuries of evidence . The Review of Economics and Statistics , 92 ( 2 ) : 367 – 377 .
- Hausmann , R. , Rodrik , D. and Velasco , A. 2005 . Growth diagnostics , Cambridge , MA : John F. Kennedy School of Government, Harvard University .
- Jones , C.I. 1995 . R&D-based models of economic growth . Journal of Political Economy , 103 : 759 – 784 .
- Kolodko , G.W. 2000 . From shock to therapy: the political economy of post-socialist transformation , Helsinki , , Finland : UNU/W IDER Studies in Development Economics .
- Krueger , A.O. 1974 . The political economy of rent-seeking society . American Economic Review , 64 ( 3 ) : 291 – 303 .
- Krueger , A.O. , Schiff , M. and Valdés , A. 1992 . The political economy of agricultural pricing policy, five volume World Bank comparative study , Baltimore , MD : Johns Hopkins University Press .
- Lau , L.J. , Qian , Y. and Roland , G. 2000 . Reform without losers: an interpretation of China’s dual-track approach to transition . Journal of Political Economy , 108 ( 1 ) : 120 – 143 .
- Lavigne , M. 1995 . The economics of transition: from socialist economy to market economy , New York : St Martin’s Press .
- Lin , J.Y. 1995 . The needham puzzle: why the industrial revolution did not originate in China? . Economic Development and Cultural Change , 41 : 269 – 292 .
- Lin, J.Y., 2009. Economic development and transition: thought, strategy and viability (Marshall Lectures). Cambridge University Press.
- Lin , J.Y. 2011 . New structural economics: a framework for rethinking economic development . World Bank Research Observer , 26 ( 2 ) : 193 – 221 .
- Lin , J.Y. 2012a . Demystifying the Chinese economy , Cambridge : Cambridge University Press .
- Lin , J.Y. 2012b . Benti and Changwu: dialogues on methodology in economics , New York : Cengage. Original Chinese version published by Peking University Press .
- Lin , J.Y. 2012c . New structural economics , Washington , DC : World Bank .
- Lin , J.Y. and Li , Z. 2008 . Policy burden, privatization and soft budget constraint . Journal of Comparative Economics , 36 : 90 – 102 .
- Lin , J.Y. , Cai , F. and Li , Z. 1996 . The lessons of China’s transition to a market economy . Cato Journal , 16 ( 2 ) : 201 – 231 .
- Lin, J.Y., Sun, X., and Jiang, Y., 2009. Toward a theory of optimal financial structure. World Bank Policy Research Working Paper Number WPS 5038.
- Maddison, A., 1982. Phases of capitalist development. Oxford University Press.
- Maddison, 2010. “Historical Statistics for the World Economy: 1–2009 AD,” Updated database of that originally published in The World Economy: Historical Statistics, OECD Development Centre, Paris 2003. Available at Groningen Growth and Development Centre, www.ggdc.net”.
- Naughton , B. 1995 . Growing out of plan: Chinese economic reform 1978–1993 , Cambridge : Cambridge University Press .
- North , D. 1981 . Structure and change in economic history , New York : W.W. Norton .
- North , D. 1990 . Institutions, institutional change and economic performance , Cambridge : Cambridge University Press .
- Pleskovic, B., 1994. Financial polices in socialist countries in transition. World Bank Policy Research Working Paper No. 1242. Washington, DC: World Bank.
- Prebisch , R. 1950 . The economic development of Latin America and its principle problems , New York : United Nations .
- Pritchett , L. 1997 . Divergence, big time . Journal of Economic Perspectives , 11 ( 3 ) : 3 – 17 .
- Rana, P. and Hamid, N., 1995. From centrally planned to market economies: the Asian approach. Volumes 1–3. Hong Kong, Oxford, New York: Oxford University Press.
- Romer, P.M., 1990. Endogenous technological change. Journal of Political Economy, 98.
- Sachs , J. 1993 . Poland’s jump to a market economy , Cambridge , MA : MIT Press .
- Sachs , J.D. , Woo , W.T. and Yang , X. 2000 . Economic reforms and constitutional transition . Annals of Economics and Finance , 1 : 435 – 491 .
- Singer, H.W., 1950. The distribution of gains between investing and borrowing countries. American Economic Review (Papers and Proceedings), 40, 473–485.
- Stark, D., 1996. Networks of assets, chains of debt: recombinant property in Hungary. In: R. Frydman, C.W. Gary and A. Rapaczynski, eds. Corporate fovernance in Central Europe and Russia. Volume 2: insiders and the state. Budapest: Central European University Press.
- Stiglitz , J.E. and Ellerman , D. 2001 . Not poles apart: ‘Whither reform?’ and ‘Whence reform?’ . Journal of Economic Policy Reform , 4 : 4
- Williamson, J., 1990. What Washington means by policy reform, Chapter 2 in J. Williamson ed., Latin American adjustment: how much has happened. Washington, DC: (Petersen) Institute for International Economics.
- Williamson, J., 2002. Did the Washington Consensus fail? Peterson Institute for International Economics. http://www.petersoninstitute.org/ publications/papers/paper.cfm?ResearchID=488.
- Williamson, J., 2004. A short history of the Washington Consensus. Paper commissioned by Fundación CIDOB for a conference ‘From the Washington Consensus towards a new Global Governance,’ Barcelona, September 24–25, 2004.
- World Bank . 2002 . Transition, the first ten years: analysis and lessons for Eastern Europe and the former Soviet Union , Washington , DC : World Bank .
- World Bank . 2005 . Economic growth in the 1990s: learning from a decade of reform , Washington , DC : World Bank .
