
 ?Mathematical formulae have been encoded as MathML and are displayed in this HTML version using MathJax in order to improve their display. Uncheck the box to turn MathJax off. This feature requires Javascript. Click on a formula to zoom.
ABSTRACT
Given the increased frequency of extreme rainfall events, pre-disaster countermeasures against landslides triggered by heavy rainfall are important to enhance disaster resilience. This study presents a methodology for economic risk assessment of structures affected by rainfall-induced landslides using machine learning (ML). Random Forest and LightGBM algorithms were applied to develop ML-based landslide prediction models considering the spatial distributions of landslide conditioning and triggering factors. The rainfall index was calculated considering the temporal variation in rainfall and was used as a feature associated with rainfall intensity. The rainfall hazard curve, representing the relationship between the rainfall index and its annual exceedance probability, was statistically estimated using a generalised extreme value distribution. Rainfall-induced landslide susceptibility was assessed using an ML-based landslide prediction model and rainfall hazard curve. Finally, the risk curve associated with the economic loss from structures damaged by rainfall-induced landslides was estimated based on landslide susceptibility and structure distribution maps. In this study, LightGBM showed better prediction performance for evaluating rainfall-induced landslide susceptibility than Random Forest. An illustrative example is presented to demonstrate that the proposed methodology can be used to develop an appropriate risk-based disaster mitigation strategy.
1. Introduction
Rainfall-induced landslides are one of the most dominant hazards to communities in the mountainous areas of Japan because of high precipitation and severe topography (Yoshimatsu and Abe Citation2006). Unprecedented heavy rainfall occurred over a wide area of Japan between 28 June and 8 July 2018. This rainfall event, which is officially referred to as the Heavy Rain Event of July 2018 (Japan Meteorological Agency (JMA) Citation2018), not only caused severe damage to structures and infrastructure, but also resulted in significant loss of life (Tsuguti et al. Citation2019). Typhoon Hagibis struck Japan in October 2019, resulting in serious property damage, deterioration of the living environment, and economic loss due to floods and landslides (Wang et al. Citation2023). Landslides triggered by rainfall can cause significant delays in the post-disaster recovery processes. Considering the long-term trend of the increase in the intensity and frequency of rainfall events (Sun et al. Citation2023), countermeasures against heavy rainfall and associated landslides are critical for minimising the negative social impacts and enhancing the disaster resilience of communities in potentially affected areas.
The time and location of landslides due to rainfall can be predicted using process-based models based on slope stability analysis, considering various physical and mechanical properties (Kim et al. Citation2021). The JMA has provided a real-time rainfall-induced landslide hazard map estimated based on the soil water index calculated using a three-layer tank model with fixed parameters throughout Japan (Matsuyama, Saito, and Zemtsov Citation2021). However, it is difficult to apply these models over a wide area since a large dataset with detailed information on hydrological, lithological and soil characteristics is required to consider the local variation in landslide conditioning factors, such as topography and vegetation (Guzzetti et al. Citation2007). Data-driven approaches based on machine learning (ML) have been studied to develop landslide prediction models applicable to large and complex areas (Huang and Zhao Citation2018; Kainthura and Sharma Citation2022; Mondal and Mandal Citation2018; Ng et al. Citation2021; Taalab, Cheng, and Zhang Citation2018). The spatial distributions of various landslide conditioning and triggering factors can be correlated with landslide susceptibility using ML algorithms, considering the complex nonlinear problems of landslide occurrence. These ML-based landslide prediction models are expected to support decision-making in landslide disaster management over wide areas.
A hazard curve representing the relationship between hazard intensity and occurrence probability should be considered when evaluating the safety of structures against future disasters (Ishibashi et al. Citation2021a). In the field of earthquake engineering, probabilistic seismic hazard analysis has been performed with the development of ground motion prediction models for future earthquakes considering aleatory and epistemic uncertainties, which represent the natural randomness in the physical system and lack of knowledge in the model due to limited data, respectively (Bommer Citation2022). Statistical approaches based on historical data are generally used to estimate rainfall hazards since the occurrence time, location, and intensity of rainfall events depend on complex relationships among various meteorological factors. Moreover, solid technologies for evaluating the uncertainties associated with meteorological factors during extreme rainfall events have not been developed. Several methodologies have been studied on landslide susceptibility mapping based on the occurrence probability of extreme rainfall events estimated using statistical approaches (Kawagoe, Kazama, and Sarukkalige Citation2010; Lee et al. Citation2021; Mallick et al. Citation2021). In these previous studies, rainfall intensity measures obtained without considering the temporal variation in rainfall (i.e. both long- and short-term rainfall) before landslide occurrence were used in the prediction models. In general, deep-seated landslides occur because of long-term rainfall, whereas shallow landslides and debris flows are triggered by short-term heavy rainfall (Abraham et al. Citation2020). Liu and Wang (Citation2022; Citation2023) investigated a critical rainfall pattern curve representing the threshold for slope stability and quantified the effects of rainfall intensity and duration on the annual occurrence probability of rainfall-induced landslides at a specific slope. It is important to develop methodologies for landslide susceptibility assessment that incorporate rainfall hazard analysis, considering the effects of temporal variation in rainfall on landslide occurrence.
Risk is a performance indicator of the social impacts of future disasters. Fu et al. (Citation2020) proposed a methodology for the landslide risk assessment of property damage in areas with landslide data and damage records. Alqadhi et al. (Citation2022) used ML to assess a distribution map of ecosystem services affected by rainfall-induced landslides with various return periods. Although methodologies for quantifying the impacts of landslides have been investigated, very few studies have been conducted on landslide risk assessment considering rainfall hazards, particularly for estimating the risk curve representing the relationship between the consequence of landslides and its exceedance probability. The risk curve supports both long- and short-term decision-making regarding disaster countermeasures (Ishibashi et al. Citation2021b). Frameworks for estimating the risk of landslides triggered by rainfall based on hazard analysis should be established to improve disaster management systems in landslide-prone areas.
This study presents a framework for the risk assessment of structures damaged by rainfall-induced landslides using ML. The rainfall index, calculated considering the effects of both long- and short-term rainfall on landslide occurrence, was used as a rainfall intensity measure. The performances of landslide prediction models developed using the Random Forest and LightGBM algorithms were compared to determine the optimal ML algorithm for landslide susceptibility assessment. Rainfall-induced landslide susceptibility was assessed using the ML-based prediction model and the rainfall hazard curve estimated based on a statistical approach. The risk curve associated with the economic loss from structures affected by rainfall-induced landslides was then estimated by combining the landslide susceptibility map and the spatial distribution of structures. In an illustrative example, the economic risk of structures damaged by rainfall-induced landslides in an area of Japan was analysed to discuss efficient disaster management.
2. Procedure for risk assessment of economic loss from structures affected by rainfall-induced landslides
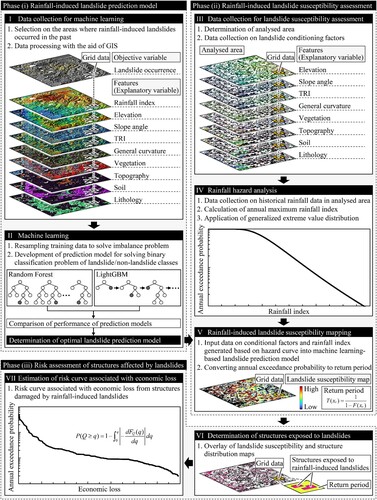
shows the procedure for estimating the economic risk of structures damaged by rainfall-induced landslides. The proposed framework consists of three phases: (i) development of a rainfall-induced landslide prediction model using ML, (ii) landslide susceptibility assessment, and (iii) risk assessment of structures affected by rainfall-induced landslides. In phase (i), the Random Forest and LightGBM algorithms are applied to develop the landslide prediction models. The optimal prediction model is determined by comparing the prediction performance. In phase (ii), landslide susceptibility in the analysed area is assessed using the ML-based landslide prediction model and the hazard curve obtained using a statistical method. Finally, in phase (iii), the risk curve associated with the economic loss from structures damaged by rainfall-induced landslides is estimated by combining landslide susceptibility and structure distribution maps.
Figure 1. Procedure for estimating economic risk of structures damaged by rainfall-induced landslides.
2.1. Development of landslide prediction model using machine learning
2.1.1. Data collection for machine learning
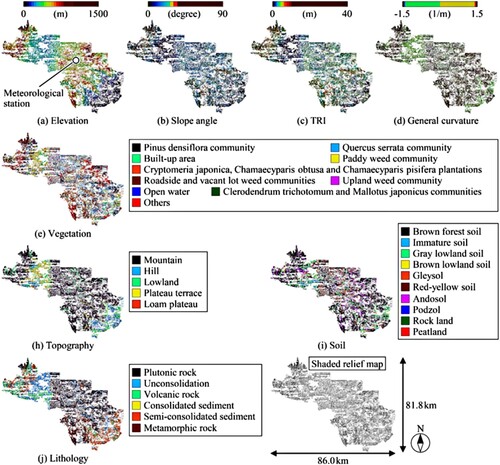
The areas affected by the Heavy Rain Event of July 2018 and Typhoon Hagibis in Japan were selected as data collection areas. The ML dataset was created by combining the data obtained from these areas to ensure the applicability of the landslide prediction models to various areas with different landslide conditioning factors. The locations of the data collection areas are shown in , which also presents the location of the area used to assess the economic risk of structures affected by rainfall-induced landslides as the illustrative example described in Section 3. The distribution maps of the ML dataset in the areas affected by the Heavy Rain Event of July 2018 and Typhoon Hagibis are shown in and , respectively. The spatial distribution data of landslide location, rainfall index, elevation, slope angle, terrain ruggedness index (TRI) (Riley, DeGloria, and Elliot Citation1999), general curvature, vegetation, topography, soil and lithology were collected and used as features (i.e. explanatory variables) in ML. The Geospatial Information Authority of Japan (GSI) (Citation2018; Citation2019) provided data on landslide distributions identified from aerial photographs taken after the Heavy Rain Event of July 2018 and Typhoon Hagibis. The data collection areas were divided into 10 × 10 m grid cells using a geographic information system (GIS). A grid resolution of 10 m is sufficient to capture local topographic characteristics and can reduce the uncertainties associated with geological conditions in each grid cell to insignificant levels (Kim et al. Citation2021; Tofani et al. Citation2017).
Figure 2. Locations of data collection areas.
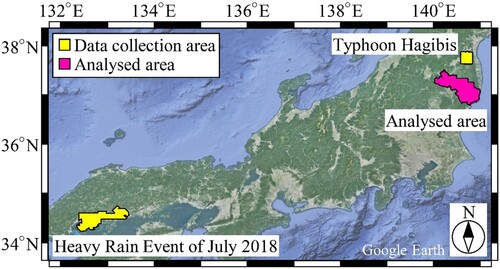
Figure 3. Distribution maps of machine learning dataset in the area affected by the Heavy Rain Event of July 2018.
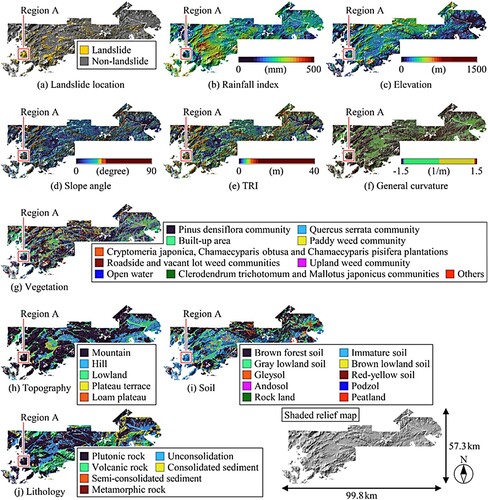
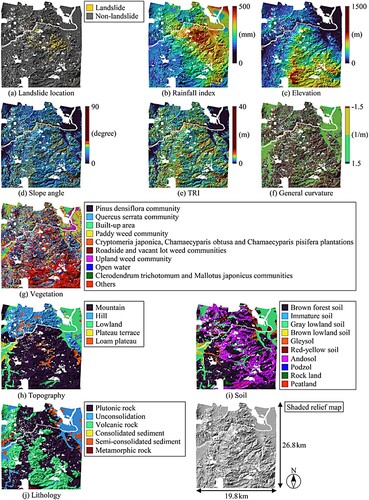
Figure 4. Distribution maps of machine learning dataset in the area affected by Typhoon Hagibis.
Landslide occurrence depends on temporal variation in rainfall. In this study, considering the effects of both long- and short-term rainfall, the rainfall index proposed by Nakai et al. (Citation2006) was used as a feature to represent the rainfall intensity. The rainfall index has a good correlation with the occurrence of rainfall-induced landslides (Moriwaki et al. Citation2019). The rainfall index R’ is calculated as follows:
(1)
(1)
(2)
(2) where Rw is the long-term effective rainfall with a half-time value period of 72 h, rw is the short-term effective rainfall with a half-time value period of 1.5 h, R1 and r1 are the reference values for long- and short-term effective rainfall, respectively, a is the weighting factor, and Rfw0 is the Rfw calculated when Rw = rw = 0. The half-time value periods of the long- and short-term effective rainfall represent the regional characteristics of the surface and subsurface rainfall-runoff processes, respectively. Takahashi et al. (Citation2000) studied on the relationship among landslide occurrences, regional differences and half-time value period of effective rainfall, and revealed that the long-term effective rainfall with a half-time value period of 72 h is appropriate for the granite area, which is widely distributed in the data collection areas for ML, as described below. In addition, Terada and Nakaya (Citation2001) reported that short-term effective rainfall with a half-time value period of 1.5 h can be applied regardless of regional characteristics. R1, r1 and a were set to 600, 200 mm and 3, respectively. The rainfall index calculated with these values of R1, r1, a and half-time value periods is correlated with landslide occurrences triggered by rainfall in Japan (Moriwaki et al. Citation2019).
The rainfall index distributions in the data collection areas, shown in (b) and (b), were computed based on the rainfall data observed by the eXtended RAdar Information Network (XRAIN) using X- and C-band multi-parameter radars provided by the Ministry of Land, Infrastructure and Transport (MLIT) (Citation2010). Distribution maps of elevation, slope angle, TRI, and general curvature were obtained based on the digital elevation model with a 10 m resolution provided by GSI (Citation2016). A 1/25,000 vegetation map based on field investigations and aerial photographs provided by the CitationBiodiversity Center of Japan was processed using GIS. Distribution maps of the topography, soil and lithology were developed based on the 1/200,000 national land survey provided by the CitationMLIT. Decomposed granite soil (i.e. Masado), which is formed by weathered granite belonging to plutonic rock and can significantly lose strength when submerged, is widely distributed in the two data collection areas (Irasawa et al. Citation2020; Miura and O-hara Citation1979). Finally, 109,703 landslide and 19,696,111 non-landslide grid data points were obtained to develop ML-based landslide prediction models. As shown in Region A of , although the rainfall index was relatively low, many landslides occurred because of a combination of landslide-prone conditions, such as a large slope angle and plutonic rock, which are recognised as major factors in rainfall-induced landslides (Kaihara et al. Citation2022). The occurrence of rainfall-induced landslides depends on complex interactions between various conditioning and triggering factors.
2.1.2. Machine learning algorithm
The ML approach is suitable for handling large datasets and identifying complex landslide phenomena hidden in the data (Tehrani et al. Citation2022). In this study, models for solving the binary classification problem of landslide/non-landslide classes were developed using the Random Forest and LightGBM algorithms. Both ML algorithms can be used not only to develop robust classifiers but also to evaluate feature importance scores representing the contributions of each explanatory variable to the model prediction (Boutahir et al. Citation2022; Moorthy et al. Citation2020). The optimal ML algorithm for landslide susceptibility assessment was determined by comparing the classification performances of the prediction models.
2.1.2.1. Random forest
Random Forest is a bagging method based on decision trees (Breiman Citation2001). The final prediction result is determined by the voting results of multiple decision trees built using the bootstrap sampling method (Efron Citation1979).
In this study, the CART algorithm, using the Gini index as the attribute selection measure, was applied to construct a decision tree (Breiman et al. Citation1984). The Gini index is defined as follows:
(3)
(3) where Gini(v) is the Gini index at node v, C is the number of classes ( = 2), and p(j|v) is the probability that the training sample belongs to class j at node v.
The node with the highest information gain was selected for further splitting when constructing the decision tree. The information gain is calculated as follows:
(4)
(4) where IG(v) is the information gain at node v, vL and vR are the left and right child nodes of node v, respectively, and pL and pR are the probabilities that the training sample belongs to vL and vR, respectively.
2.1.2.2. LightGBM
LightGBM is a tree-based learning algorithm proposed by Ke et al. (Citation2017) that uses the gradient boosting decision trees (GBDT) algorithm (Friedman Citation2001). Histogram-based algorithm and leaf-wise growth strategy are applied to increase the training speed and reduce memory consumption in LightGBM (Liang et al. Citation2020).
For the given dataset with n samples and m features , where
and
are randomly selected from the training dataset in GBDT, the prediction result
for the i-th training sample xi is expressed as follows:
(5)
(5) where K is the number of decision trees and fk is a function of the k-th decision tree. The number of features (m) was nine in this study (i.e. rainfall index, elevation, slope angle, TRI, general curvature, vegetation, topography, soil and lithology), as shown in and .
The training goal of the GBDT model is to minimise objective function L, expressed as follows:
(6)
(6) where
is the loss function representing the difference between the prediction result
and target yi, and Ω(fk) is the regularisation term that penalises the complexity of the model. In this study, lasso (L1) and ridge (L2) penalty terms were used to avoid overfitting and improve the accuracy of the model (Wang et al. Citation2021).
The objective function L(t) at the t-th iteration is minimised by adding a new tree ft(xi). L(t) is expressed using Equations (Equation5(5)
(5) ) and (Equation6
(6)
(6) ), as follows:
(7)
(7) where
is the prediction result for xi at the t-1-th iteration.
In this study, Logarithmic Loss (logloss) was used as the loss function (Zhang and Gong Citation2020). logloss is calculated as follows:
(8)
(8) where N is the number of samples, Ii,j is the binary variable, which has a value of 1 when yi is equal to j and a value of 0 otherwise, and pi,j is the probability that
is equal to j.
2.1.3. Resampling imbalanced dataset
The dataset used for ML in this study is imbalanced data, where the amount of non-landslide data is significantly greater than that of landslide data. A classifier developed without considering the class imbalance problem can be overwhelmed by the major class and ignores the minor class (Ofek et al. Citation2017). In this study, the synthetic minority oversampling technique (SMOTE) proposed by Chawla et al. (Citation2002) and random undersampling (RUS) were used to balance the numbers of landslide and non-landslide samples. Synthetic minority class samples (i.e. landslide data) can be generated by SMOTE based on the neighbours randomly selected from the k-nearest neighbours of the minority class, depending on the amount of oversampling required. The value of feature j in the new sample generated by SMOTE xnew(j) is expressed as follows:
(9)
(9) where xi(j) is the value of feature j in the sample randomly selected from the minority class samples, xz(j) is the value of feature j in the sample randomly selected from the minority class k-nearest neighbours of xi, and λ is a uniform random number in the range [0, 1].
Excessive resampling can cause performance deterioration of the model owing to overfitting, loss of important information, and misinterpretation of the data (Shahabadi et al. Citation2021). The accuracy of the prediction model depends on the number of training data points after resampling (Hahne et al. Citation2014). In this study, the optimal number of resampled training data and the ML algorithm for developing a rainfall-induced landslide prediction model were investigated based on performance metrics.
2.1.4. Performance metrics
The performance of the prediction models developed using the Random Forest and LightGBM algorithms was evaluated using accuracy, precision, recall, F-measure and area under the receiver operating characteristic (ROC) curve (AUC) as performance metrics. Accuracy, precision, recall and F-measure are defined as follows:
(10)
(10)
(11)
(11)
(12)
(12)
(13)
(13) where TP, TN, FP and FN are the numbers of positive samples correctly predicted as positive, negative samples correctly predicted as negative, negative samples incorrectly predicted as positive, and positive samples incorrectly predicted as negative (i.e. true positive, true negative, false positive, and false negative), respectively. In this study, positive and negative samples represent landslide and non-landslide data, respectively.
The ROC curve is defined as a plot of the false-positive rate (FPR) and true-positive rate (TPR) {FPR(c), TPR(c)}, where . FPR is defined as follows:
(14)
(14) TPR is the same as recall defined in EquationEquation (12
(12)
(12) ). The AUC is calculated as follows:
(15)
(15) In this study, the hold-out method was used to calculate the performance metrics. The dataset was randomly divided into 70% for training and 30% for classifier testing. The training data were resampled to equalise the landslide and non-landslide data using SMOTE and RUS, before applying the ML algorithm. This process was repeated three times to reduce the effects of data selection bias on prediction performance. Subsequently, the means of accuracy, precision, recall, F-measure and AUC were calculated for various numbers of resampled training data, and compared to determine the appropriate number of training data after resampling and the optimal ML algorithm.
2.1.5. Determination of optimal prediction model
The performance metrics obtained without resampling are presented in . There were insignificant differences in the performances of the prediction models developed using Random Forest and LightGBM algorithms. The accuracy was remarkably high, while the recall and AUC were as low as approximately 0.13 and 0.56, respectively. Prediction models developed without considering the class imbalance problem can be biased towards the major class (i.e. the non-landslide class) and have poor classification performance for the minor class (i.e. the landslide class). shows the relationship between the performance metrics and number of resampled training data. Regardless of the ML algorithms, the recall and AUC were dramatically improved by resampling, whereas the precision decreased because of the significant increase in FP. This result demonstrates that the models developed using resampled training data can roughly predict landslide locations, although non-landslide class data can be misclassified as landslide class. It is acceptable that rainfall-induced landslide susceptibility would be overestimated when considering disaster management. The application of resampling techniques is valid for the datasets used in this study, considering that the prediction model is used to determine regions with high rainfall-induced landslide susceptibility.
Figure 5. Relationship between performance metrics and the number of resampled training data: (a) Random Forest and (b) LightGBM.
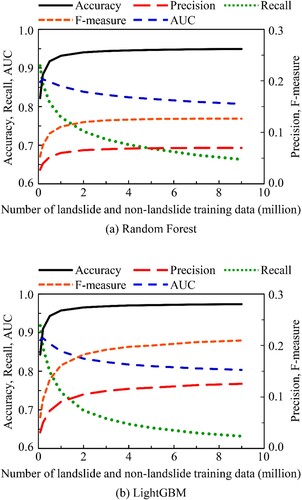
Table 1. Performance metrics obtained without resampling.
As shown in , each performance metric converges to a constant value with an increase in the number of resampled training data. In the illustrative example described below, the prediction model developed using the training data resampled to 4,000,000 landslide and non-landslide class data was applied considering the performance metrics and computational cost. The LightGBM prediction model exhibited an equivalent AUC and higher accuracy and F-measure than the Random Forest prediction model; thus, it was determined to be the optimal ML algorithm. lists the hyperparameter values for Random Forest and LightGBM algorithms used in this study. The hyperparameters were determined by parameter tuning based on the performance of prediction models developed using resampled training data with 4,000,000 samples for landslide and non-landslide classes.
Table 2. Hyperparameter values for Random Forest and LightGBM algorithms.
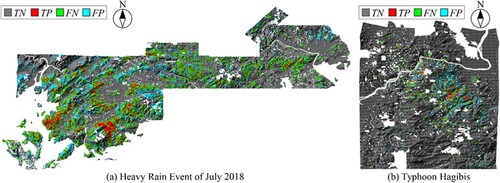
The spatial distribution of the results obtained using the LightGBM prediction model in the data collection areas is shown in . The FN that represents the landslide grids incorrectly predicted as non-landslide is distributed around the TP, which represents the correctly predicted landslide grids. The regions with densely populated FP, representing the non-landslide grids that are incorrectly predicted as landslides, are mainly distributed in mountainous areas with plutonic rock, as shown in and , where the landslide susceptibility is overestimated. These results demonstrate that the prediction model can avoid overestimation of landslide safety and can be used to determine regions susceptible to landslides triggered by rainfall.
Figure 6. Spatial distribution of results obtained using LightGBM prediction model in data collection areas: (a) Heavy Rain Event of July 2018 and (b) Typhoon Hagibis.
2.1.6. Feature importance
Feature importance is an indicator of the extent to which each feature contributes to model prediction. The feature importance score is calculated as follows:
(16)
(16) where FIn(j) is the normalised feature importance score of feature j, Nj is the set of nodes in which feature j is used as the splitting criterion, Gain(v,j) is the information gain, and nv is the number of training data points in node v that belong to Nj.
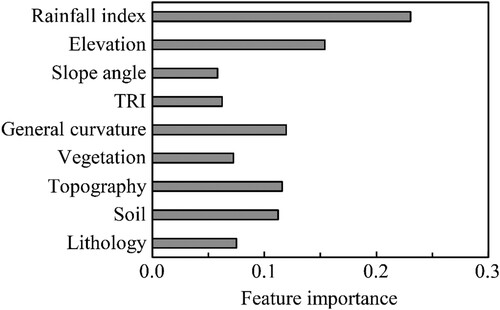
shows the feature importance scores of the LightGBM prediction model. The feature importance can be used to select an appropriate set of features to improve the performance of the prediction model. In this study, feature selection was not performed, and all nine features were used in ML since features with a significantly low feature importance score were not identified.
Figure 7. Feature importance scores of LightGBM prediction model.
2.2. Rainfall-induced landslide susceptibility assessment
Landslide susceptibility can be assessed by combining the ML-based prediction model with the rainfall hazard curve. In this study, a generalised extreme value (GEV) distribution was applied to estimate the hazard curve associated with the annual maximum rainfall index. The GEV approach has been widely used to model extreme rainfall event values (Paola et al. Citation2018). The GEV distribution was applied to fit the annual maximum rainfall index calculated for each year of the observation period using Equations (Equation1(1)
(1) ) and (Equation2
(2)
(2) ) based on historical rainfall data. The GEV cumulative distribution function is expressed as follows:
(17)
(17) where xr is the rainfall index, F(xr) is the GEV cumulative distribution function, and γ, μ and θ are the shape, location and scale parameters, respectively. The return period associated with the rainfall index xr, T(xr), is calculated as follows:
(18)
(18) The denominator in EquationEquation (18
(18)
(18) ), 1 − F(xr), represents the annual exceedance probability associated with xr (i.e. the rainfall hazard curve). The values of the rainfall indices with various return periods were generated using Equations (Equation17
(17)
(17) ) and (Equation18
(18)
(18) ), and input into the LightGBM prediction model for rainfall-induced landslide susceptibility mapping.
2.3. Risk assessment of economic loss from structures damaged by landslides
The structures affected by rainfall-induced landslides can be determined by overlaying the landslide susceptibility and structure distribution maps in GIS. Landslides can cause damage to structures and associated economic losses (Hashimoto et al. Citation2020). The economic loss caused by a structure damaged by a landslide can be calculated based on Ishibashi et al. (Citation2021b) as follows:
(19)
(19) where subscript s and ds are the structure number in the analysed area and the damage state of the structure, respectively, Qs is the economic loss from the structure affected by rainfall-induced landslides, Pds is the failure probability that the damage state of the structure becomes ds due to landslides, wds is the damage ratio for the damage state, α is the monetary value per unit area of a structure (=186.1 thousand JPY/m2 based on MLIT (Citation2023)), and As is the building area of the structure. The damage states of individual structures are classified into four levels based on the disaster damage certification criteria provided by the Cabinet Office, Government of Japan (Citation2020): slight, moderate, extensive and complete. Katano et al. (Citation2020) statistically organised the characteristics of structure damages due to past landslides triggered by rainfall in Japan. Based on Katano et al. (Citation2020), Pds for the slight, moderate, extensive and complete damage states were set to 0.347, 0.224, 0.106 and 0.324, respectively. The damage ratio was used to estimate the economic loss from individual structures considering the extent of damage. wds for the slight, moderate, extensive and complete damage states were determined to be 0.1, 0.3, 0.75 and 1.0, respectively, in accordance with the definition of the disaster damage certification criteria (Cabinet Office, Government of Japan Citation2020) and the report on structural damage after natural disasters (Rogers et al. Citation2015).
The total economic loss caused by all damaged structures in the analysed area Q is calculated as follows:
(20)
(20) where Ns is the total number of structures affected by rainfall-induced landslides in the analysed area.
The risk curve associated with the economic loss from structures damaged by rainfall-induced landslides is estimated as follows:
(21)
(21) where P(Q ≥ q) is the probability that Q exceeds q, and FQ(q) is the cumulative probability distribution of the economic loss from the structures damaged by rainfall-induced landslides.
3. Illustrative example
3.1. Analysed area
The risk of economic loss from structures affected by rainfall-induced landslides in the area located in Fukushima Prefecture, as shown in , was analysed using the proposed methodology. The analysed area included two major cities (Koriyama and Iwaki Cities). Risk assessments in cities and surrounding mountainous areas can contribute to determining effective landslide mitigation countermeasures and enhancing disaster resilience.
shows the distribution maps of the dataset for risk assessment in the analysed area. The analysed area was divided into grid cells with a resolution of 10 m using GIS. As with the areas used to collect the ML dataset, the decomposed granite soil belonging to the plutonic rock is widely distributed in the analysed area, which can be vulnerable to landslides triggered by rainfall (Award Citation1988). The applicability of the LightGBM prediction model to the analysed area is ensured since the landslide conditioning factors, such as topography, soil and lithology, are similar for the data collection areas shown in and .
Figure 8. Distribution maps of dataset for risk assessment in the analysed area.
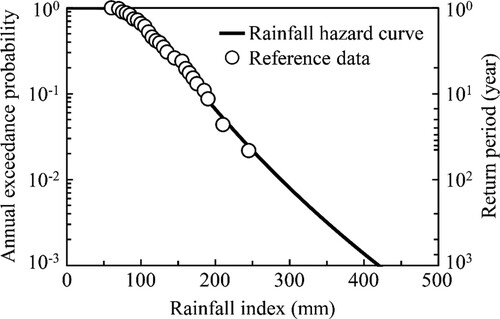
3.2. Rainfall hazard analysis
Rainfall hazard analysis was performed using historical rainfall data obtained from 1976 to 2021 at the meteorological station presented in (a). shows the hazard curve associated with the rainfall index estimated using Equations (Equation17(17)
(17) ) and (Equation18
(18)
(18) ). Takasao, Takara, and Shimizu (Citation1986) proposed the Standard Least-Squares Criterion (SLSC), which is an indicator of fit across probability density functions and used as a standard goodness-of-fit criterion in practice in Japan (Takara Citation2021). Lower SLSC values indicate better fits to the data, and SLSC=0.04 is generally considered a threshold for well-fitted models (Tanaka and Takara Citation1999). The SLSC value of the GEV distribution shown in was calculated to be 0.029, indicating a good fit with the rainfall index. In this illustrative example, the rainfall hazard curve presented in was applied to the entire analysed area considering the distribution of meteorological stations. XRAIN, which is a real-time and spatially dense rainfall observation system in Japan, has been in operation for approximately ten years. Continuous data collection from a rainfall observation system with a high spatiotemporal resolution can contribute to rainfall hazard analysis at each grid location.
Figure 9. Hazard curve associated with rainfall index.
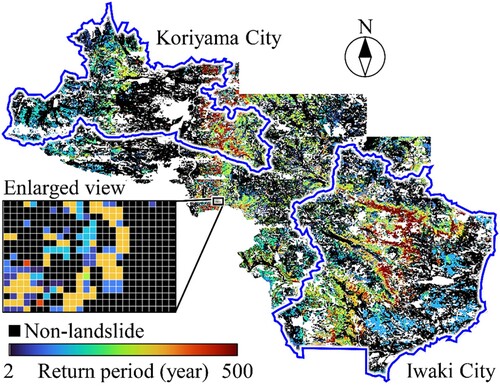
3.3. Landslide susceptibility mapping
Landslide susceptibility was assessed by inputting the data on the landslide conditioning factors and the rainfall index values estimated based on the hazard curve into the LightGBM prediction model. shows the landslide susceptibility map based on the return period associated with the rainfall index and the locations of Koriyama and Iwaki Cities. Rainfall indices with return periods between 2 and 500 years were used to assess landslide susceptibility in the analysed area.
Figure 10. Landslide susceptibility map based on return period associated with rainfall index.
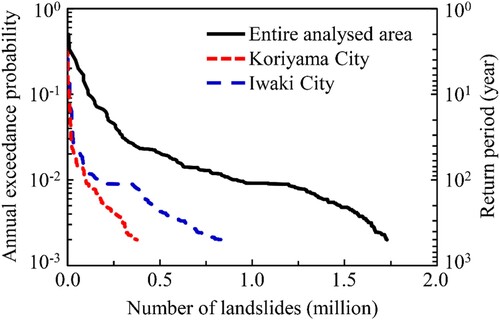
shows the relationship between the annual exceedance probability and the number of landslides in the entire analysed area as well as in Koriyama and Iwaki Cities. The number of landslides can dramatically increase when the annual exceedance probability of the rainfall index is less than approximately 0.01 (i.e. when the return period is greater than 100 years). Iwaki City has a larger number of landslides than Koriyama City, regardless of the annual exceedance probability. Since low landslide susceptibility areas, such as lowland and built-up areas, are widely distributed in the Koriyama and Iwaki Cities, the number of landslides in these cities is not significantly large compared to that in the entire analysed area.
Figure 11. Relationship between annual exceedance probability and number of landslides.
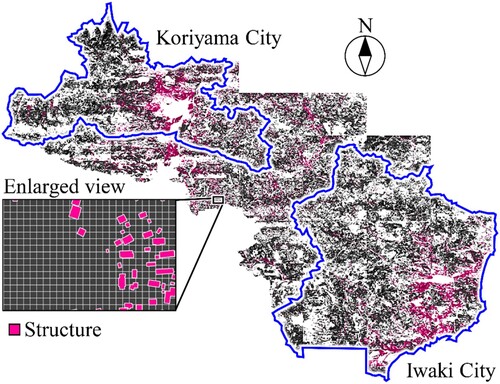
3.4. Results of risk assessment
The layers, including the grid data with landslide susceptibility and structure locations, were overlaid in the GIS to identify the structures exposed to rainfall-induced landslides. The structure distribution map of the analysed area is shown in . Structures can be damaged not only by landslides occurring in the grid where the structure is located but also by nearby landslides. Structures potentially affected by landslide mass movements should be considered in economic risk assessment using Equations (Equation19(19)
(19) ) and (Equation20
(20)
(20) ). In this illustrative example, a 50 m buffer zone around each structure was used when determining the structures exposed to landslides by combining landslide susceptibility and structure distribution maps in GIS (Kamp et al. Citation2008).
Figure 12. Structure distribution map of the analysed area.
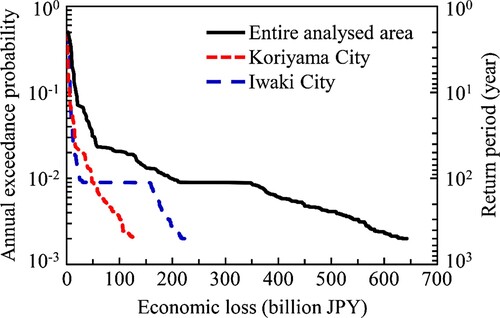
shows the risk curve associated with economic loss from structures damaged by rainfall-induced landslides. The economic risk can increase particularly when the annual exceedance probability is less than 0.01 since many structures would be affected by landslides triggered by rainfall. It is important to implement disaster mitigation countermeasures in the analysed area, considering the severe and extensive damage to structures with a low annual exceedance probability. In addition, Koriyama City has a higher risk than Iwaki City when the annual exceedance probability of economic loss ranges between 0.01 and 0.06 (i.e. the return period is between 15 and 100 years), although the number of landslides in Iwaki City is greater than that in Koriyama City in this range of annual exceedance probability, as shown in . This result demonstrates that not only the landslide susceptibility but also the risk of economic loss from damaged structures needs to be considered to improve landslide disaster management. Countermeasures against rainfall-induced landslides in Koriyama City should be prioritised to efficiently mitigate the risk with a high annual exceedance probability, and countermeasures should be taken in Iwaki City to prepare for high-magnitude and low-frequency rainfall events. The risk curve is useful for developing an appropriate disaster mitigation strategy to reduce negative impacts on communities in areas potentially affected by rainfall-induced landslides.
Figure 13. Risk curve associated with economic loss from structures damaged by rainfall-induced landslides.
4. Conclusions
A framework for estimating the risk of economic loss from structures damaged by rainfall-induced landslides is proposed. The risk was assessed based on a landslide prediction model developed using ML, the rainfall hazard curve estimated by the GEV distribution using historical rainfall data, the spatial distribution of structures, and the monetary value of individual structures damaged by landslides. As an illustrative example, the risk curve representing the relationship between the economic loss from the structures affected by rainfall-induced landslides and its annual exceedance probability in an area located in Fukushima Prefecture of Japan was estimated. The following conclusions are drawn:
The grid data with a resolution of 10 m obtained in the areas affected by the Heavy Rain Event of July 2018 and Typhoon Hagibis were used for ML. The rainfall index was used as a feature associated with rainfall intensity, considering the effects of both long- and short-term rainfall on landslide occurrences.
Resampling techniques based on SMOTE and RUS were applied to improve the performance of ML-based landslide prediction models considering the class imbalance problem of the dataset. Random Forest and LightGBM algorithms were used to develop models for solving the binary classification problem of landslide/non-landslide classes. LightGBM was determined to be the optimal ML algorithm based on the performance metrics. Regions with high rainfall-induced landslide susceptibility can be determined using the LightGBM prediction model.
GEV distribution was used to estimate the hazard curve associated with the annual maximum rainfall index. Landslide susceptibility was assessed by inputting the values of the rainfall indices with various return periods generated based on the hazard curve and the data on landslide conditioning factors obtained in the analysed area into the ML-based prediction model.
The number of structures exposed to landslides was calculated by overlaying the landslide susceptibility and structure distribution maps in GIS. The risk of economic loss from structures damaged by rainfall-induced landslides in the area located in Fukushima Prefecture of Japan was estimated based on the number of damaged structures and the monetary value of individual structures. The economic loss from structures affected by landslides triggered by rainfall would be huge in the analysed area, especially when the annual exceedance probability is less than 0.01 (i.e. a return period of greater than 100 years). Even though the expected number of landslides is low, the risk can be higher because of the spatial distributions of landslides and structures, depending on the annual exceedance probability. The proposed methodology can contribute to decision-making on countermeasures against rainfall-induced landslides and the development of appropriate disaster mitigation strategies for enhancing resilience.
Data availability statement
Data that support the findings of this study are available from the corresponding author upon reasonable request.
Disclosure statement
No potential conflict of interest was reported by the author(s).
Additional information
Funding
References
- Abraham, M. T., N. Satyam, S. Kushal, A. Rosi, B. Pradhan, and S. Segoni. 2020. “Rainfall Threshold Estimation and Landslide Forecasting for Kalimpong, India Using SIGMA Model.” Water 12 (4): 1195. https://doi.org/10.3390/w12041195.
- Alqadhi, S., J. Mallick, S. Talukdar, M. Ahmed, R. A. Khan, S. K. Sarkar, and A. Rahman. 2022. “Assessing the Effect of Future Landslide on Ecosystem Services in Aqabat Al-Sulbat Region, Saudi Arabia.” Natural Hazards 113: 641–671. https://doi.org/10.1007/s11069-022-05318-7.
- Award, U. 1988. “Land Reclamation Project at Miharu-Nanbu Area in Fukushima Prefecture.” Journal of Irrigation Engineering and Rural Planning 13: 63–66.
- Biodiversity Center of Japan. 1/25,000 vegetation survey. Accessed 8 April 2022. http://gis.biodic.go.jp/webgis/sc-025.html?kind=vg67.
- Bommer, J. J. 2022. “Earthquake Hazard and Risk Analysis for Natural and Induced Seismicity: Towards Objective Assessments in the Face of Uncertainty.” Bulletin of Earthquake Engineering 20: 2825–3069. https://doi.org/10.1007/s10518-022-01357-4.
- Boutahir, M. K., Y. Farhaoui, M. Azrour, I. Zeroual, and A. El Allaoui. 2022. “Effect of Feature Selection on the Prediction of Direct Normal Irradiance.” Big Data Mining and Analytics 5 (4): 309–317. https://doi.org/10.26599/BDMA.2022.9020003.
- Breiman, L. 2001. “Random Forests.” Machine Learning 45 (1): 5–32. https://doi.org/10.1023/A:1010933404324.
- Breiman, L., J. H. Friedman, R. A. Olshen, and C. J. Stone. 1984. Classification and Regression Trees. Wadsworth: Chapman & Hall/CRC.
- Cabinet Office, Government of Japan. 2020. Operational Guidelines for Damage Certification Criteria for Dwellings after Natural Disasters. Accessed 31 August 2023. https://www.bousai.go.jp/taisaku/pdf/r203shishin_all.pdf [In Japanese].
- Chawla, N. V., K. W. Bowyer, L. O. Hall, and W. P. Kegelmeyer. 2002. “SMOTE: Synthetic Minority Over-Sampling Technique.” Journal of Artificial Intelligence Research 16: 321–357. https://doi.org/10.1613/jair.953.
- Efron, B. 1979. “Bootstrap Methods: Another Look at the Jack-Knife.” The Annals of Statistics 7 (1): 1–26. https://doi.org/10.1214/aos/1176344552.
- Friedman, J. H. 2001. “Greedy Function Approximation: A Gradient Boosting Machine.” The Annals of Statistics 29 (5): 1189–1232. https://doi.org/10.1214/aos/1013203451.
- Fu, S., L. Chen, T. Woldai, K. Yin, L. Gui, D. Li, J. Du, C. Zhou, Y. Xu, and Z. Lian. 2020. “Landslide Hazard Probability and Risk Assessment at the Community Level: A Case of Western Hubei, China.” Natural Hazards and Earth System Sciences 20: 581–601. https://doi.org/10.5194/nhess-20-581-2020.
- GSI (Geospatial Information Authority of Japan). 2016. Digital Elevation Model (Basic Geospatial Information). Accessed 8 April 2022. https://fgd.gsi.go.jp/download/menu.php [In Japanese].
- GSI (Geospatial Information Authority of Japan). 2018. Information on the Heavy Rain Event of July 2018. Accessed 8 April 2022. https://www.gsi.go.jp/BOUSAI/H30.taihuu7gou.html [In Japanese].
- GSI (Geospatial Information Authority of Japan). 2019. Information on Typhoon Hagibis. Accessed 8 April 2022. https://www.gsi.go.jp/BOUSAI/R1.taihuu19gou.html [In Japanese].
- Guzzetti, F., S. Peruccacci, M. Rossi, and C. P. Stark. 2007. “Rainfall Thresholds for the Initiation of Landslides in Central and Southern Europe.” Meteorology and Atmospheric Physics 98: 239–267. https://doi.org/10.1007/s00703-007-0262-7.
- Hahne, J. M., F. Bießmann, N. Jiang, H. Rehbaum, D. Farina, F. C. Meinecke, K.-R. Müller, and L. C. Parra. 2014. “Linear and Nonlinear Regression Techniques for Simultaneous and Proportional Myoelectric Control.” IEEE Transactions on Neural Systems and Rehabilitation Engineering 22 (2): 269–279. https://doi.org/10.1109/TNSRE.2014.2305520.
- Hashimoto, R., T. Tsuchida, T. Moriwaki, and S. Kano. 2020. “Hiroshima Prefecture geo-Disasters due to Western Japan Torrential Rainfall in July 2018.” Soils and Foundations 60 (1): 283–299. https://doi.org/10.1016/j.sandf.2019.11.010.
- Huang, Y., and L. Zhao. 2018. “Review on Landslide Susceptibility Mapping Using Support Vector Machines.” Catena 165: 520–529. https://doi.org/10.1016/j.catena.2018.03.003.
- Irasawa, M., T. Koi, C. Y. Tsou, N. Kato, S. Matsuo, M. Arai, M. Kaibori, et al. 2020. “October 2019 Sediment Disaster in the Tohoku Region Owing to Typhoon No. 19 (Tyhpoon Hagibis).” International Journal of Erosion Control Engineering 13 (2): 48–55. https://doi.org/10.13101/ijece.13.48.
- Ishibashi, H., M. Akiyama, D. M. Frangopol, S. Koshimura, T. Kojima, and K. Nanami. 2021a. “Framework for Estimating the Risk and Resilience of Road Networks with Bridges and Embankments Under Both Seismic and Tsunami Hazards.” Structure and Infrastructure Engineering 17 (4): 494–514. https://doi.org/10.1080/15732479.2020.1843503.
- Ishibashi, H., M. Akiyama, T. Kojima, K. Aoki, S. Koshimura, and D. M. Frangopol. 2021b. “Risk Estimation of the Disaster Waste Generated by Both Ground Motion and Tsunami due to the Anticipated Nankai Trough Earthquake.” Earthquake Engineering & Structural Dynamics 50 (8): 2134–2155. https://doi.org/10.1002/eqe.3440.
- Japan Meteorological Agency. 2018. Primary Factors Behind the Heavy Rain Event of July 2018 and the Subsequent Heatwave in Japan from Mid-July Onward. Accessed 29 December 2022. https://www.jma.go.jp/jma/press/1808/10c/h30goukouon20180810.pdf [In Japanese].
- Kaihara, S., N. Tadakuma, H. Saito, and H. Nakaya. 2022. “Influence of Below-Threshold Rainfall on Landslide Occurrence Based on Japanese Cases.” Natural Hazards 115: 2307–2332. https://doi.org/10.1007/s11069-022-05639-7.
- Kainthura, P., and N. Sharma. 2022. “Machine Learning Driven Landslide Susceptibility Prediction for the Uttarkashi Region of Uttarakhand in India.” Georisk: Assessment and Management of Risk for Engineered Systems and Geohazards 16 (3): 570–583. https://doi.org/10.1080/17499518.2021.1957484.
- Kamp, U., B. J. Growley, G. A. Khattak, and L. A. Owen. 2008. “GIS-based Landslide Susceptibility Mapping for the 2005 Kashmir Earthquake Region.” Geomorphology 101 (4): 631–642. https://doi.org/10.1016/j.geomorph.2008.03.003.
- Katano, Y., I. Akamatsu, S. Tamura, and T. Tanaka. 2020. “Study on Characteristics of Building Damages Caused by Sediment Disaster and Flood Disaster of the Heavy Rain Event of July 2018 - Analysis Using Disaster Victim Certificate Data of Mihara City in Hiroshima Prefecture.” Journal of the City Planning Institute of Japan 55 (3): 851–857. In Japanese. https://doi.org/10.11361/journalcpij.55.851.
- Kawagoe, S., S. Kazama, and P. R. Sarukkalige. 2010. “Probabilistic Modelling of Rainfall Induced Landslide Hazard Assessment.” Hydrology and Earth System Sciences 14: 1047–1061. https://doi.org/10.5194/hess-14-1047-2010.
- Ke, G., Q. Meng, T. Finely, T. Wang, W. Chen, W. Ma, Q. Ye, and T. Y. Liu. 2017. “LightGBM: A Highly Efficient Gradient Boosting Decision Tree.” Proceedings of the 31st International Conference on Neural Information Processing Systems, Long Beach, CA, USA, 4–9 December 2017: 3146–3154.
- Kim, H., J. H. Lee, H. J. Park, and J. H. Heo. 2021. “Assessment of Temporal Probability for Rainfall-Induced Landslides Based on Nonstationary Extreme Value Analysis.” Engineering Geology 294 (5): 106372. https://doi.org/10.1016/j.enggeo.2021.106372.
- Lee, J. H., H. Kim, H. J. Park, and J. H. Heo. 2021. “Temporal Prediction Modeling for Rainfall-Induced Shallow Landslide Hazards Using Extreme Value Distribution.” Landslides 18: 321–338. https://doi.org/10.1007/s10346-020-01502-7.
- Liang, W., S. Luo, G. Zhao, and H. Wu. 2020. “Predicting Hard Rock Pillar Stability Using GBDT, XGBoost, and LightGBM Algorithms.” Mathematics 8 (5): 765. https://doi.org/10.3390/math8050765.
- Liu, X., and Y. Wang. 2022. “Quantifying Annual Occurrence Probability of Rainfall-Induced Landslide at a Specific Slope.” Computers and Geotechnics 149: 104877. https://doi.org/10.1016/j.compgeo.2022.104877.
- Liu, X., and Y. Wang. 2023. “Analytical Solutions for Annual Probability of Slope Failure Induced by Rainfall at a Specific Slope Using Bivariate Distribution of Rainfall Intensity and Duration.” Engineering Geology 313: 106969. https://doi.org/10.1016/j.enggeo.2022.106969.
- Mallick, J., S. Alqadhi, S. Talukdar, M. AlSubih, M. Ahmed, R. A. Khan, N. B. Kahla, and S. M. Abutayeh. 2021. “Risk Assessment of Resources Exposed to Rainfall Induced Landslide with the Development of GIS and RS Based Ensemble Metaheuristic Machine Learning Algorithms.” Sustainability 13 (2): 457. https://doi.org/10.3390/su13020457.
- Matsuyama, H., H. Saito, and V. Zemtsov. 2021. “Application of Soil Water Index to Landslide Prediction in Snowy Regions: Sensitivity Analysis in Japan and Preliminary Results from Tomsk, Russia.” Progress in Earth and Planetary Science 8: 17. https://doi.org/10.1186/s40645-021-00408-9.
- Miura, N., and S. O-hara. 1979. “Particle-crushing of a Decomposed Granite Soil Under Shear Stresses.” Soils and Foundations 19 (3): 1–14. https://doi.org/10.3208/sandf1972.19.3_1.
- MLIT (Ministry of Land, Infrastructure and Transport). 1/200,000 National Land Survey. https://nlftp.mlit.go.jp/kokjo/inspect/landclassification/download.html.
- MLIT (Ministry of Land, Infrastructure and Transport). 2010. eXtended RAdar Information Network (XRAIN). Accessed 8 April 2022. http://apps.diasjp.net/xband/protected/cx.html [In Japanese].
- MLIT (Ministry of Land, Infrastructure and Transport). 2023. Flood Control and Economic Research Manual. Accessed 31 August 2023. https://www.mlit.go.jp/river/basic_info/seisaku_hyouka/gaiyou/hyouka/pdf/shisan_r5.pdf [In Japanese].
- Mondal, S., and S. Mandal. 2018. “RS & GIS-Based Landslide Susceptibility Mapping of the Balason River Basin, Darjeeling Himalaya, Using Logistic Regression (LR) Model.” Georisk: Assessment and Management of Risk for Engineered Systems and Geohazards 12 (1): 29–44. https://doi.org/10.1080/17499518.2017.1347949.
- Moorthy, S. M. K., K. Calders, M. B. Vicari, and H. Verbeeck. 2020. “Improved Supervised Learning-Based Approach for Leaf and Wood Classification from LiDAR Point Clouds of Forests.” IEEE Transactions on Geoscience and Remote Sensing 58 (5): 3057–3070. https://doi.org/10.1109/TGRS.2019.2947198.
- Moriwaki, T., T. Tsuchida, R. Hashimoto, S. Nakai, S. Kano, and M. Kaibori. 2019. “Characteristics of Landslide Disaster in Hiroshima Prefecture due to Torrential Rains on July, 2018 (Comparison with 6.29, 1999 and 8.20, 2014 Landslide Disasters).” Journal of Japan Society of Civil Engineers, Ser. B1 (Hydraulic Engineering) 75 (1): 244–259. [In Japanese].
- Nakai, S., Y. Sasaki, M. Kaibori, and T. Moriwaki. 2006. “Rainfall Index for Warning and Evacuation Against Sediment-Related Disaster: Reexamination of Rainfall Index Rf, and Proposal of R’.” Soils and Foundations 46 (4): 465–475. https://doi.org/10.3208/sandf.46.465.
- Ng, C. W. W., B. Yang, Z. Q. Liu, J. S. H. Kwan, and L. Chen. 2021. “Spatiotemporal Modelling of Rainfall-Induced Landslides Using Machine Learning.” Landslides 18: 2499–2514. https://doi.org/10.1007/s10346-021-01662-0.
- Ofek, N., L. Rokach, R. Stern, and A. Shabtai. 2017. “Fast-CBUS: A Fast Clustering-Based Undersampling Method for Addressing the Class Imbalance Problem.” Neurocomputing 243 (21): 88–102. https://doi.org/10.1016/j.neucom.2017.03.011.
- Paola, F. D., M. Giugni, F. Pugliese, A. Annis, and F. Nardi. 2018. “GEV Parameter Estimation and Stationary vs. non-Stationary Analysis of Extreme Rainfall in African Test Cities.” Hydrology 5 (2): 28. https://doi.org/10.3390/hydrology5020028.
- Riley, S. J., S. D. DeGloria, and R. Elliot. 1999. “A Terrain Ruggedness Index That Quantifies Topographic Heterogeneity.” Intermountain Journal of Sciences 5 (1–4): 23–27.
- Rogers, N., S. van Ballegooy, K. Williams, and L. Johnson. 2015. “Considering Post-Disaster Damage to Residential Building Construction -Is our Modern Building Construction Resilient?” Proceedings of the 6th International Conference on Earthquake Geotechnical Engineering, Christchurch, New Zealand, 1–4 November 2015.
- Shahabadi, M. S. E., H. Tabrizchi, M. K. Rafsanjani, B. B. Gupta, and F. Palmieri. 2021. “A Combination of Clustering-Based Under-Sampling with Ensemble Methods for Solving Imbalanced Class Problem in Intelligent Systems.” Technological Forecasting and Social Change 169: 120796. https://doi.org/10.1016/j.techfore.2021.120796.
- Sun, Y., C. Liu, M. Zhao, L. Liu, S. Liang, Y. Wang, and Y. Chen. 2023. “Influence of Extreme Rainfall Events on Soil Carbon Release in the Loess Hilly Region, China.” Catena 220 Part A: 106652.
- Taalab, K., T. Cheng, and Y. Zhang. 2018. “Mapping Landslide Susceptibility and Types Using Random Forest.” Big Earth Data 2 (2): 159–178. https://doi.org/10.1080/20964471.2018.1472392.
- Takahashi, T., M. Matsuoka, K. Senoo, Y. Araki, K. Furukawa, and T. Mizuyama. 2000. “Study on the Debris Flow Forecast Model in Hazardous Torrent.” Journal of Erosion Control Engineering 53 (1): 35–46. In Japanese.
- Takara, K. 2021. “History and Perspectives of Hydrologic Frequency Analysis in Japan.” In Pioneering Works on Extreme Value Theory, edited by N. Hoshino, S. Mano, and T. Shimura, 113–134. Singapore: Springer.
- Takasao, T., K. Takara, and A. Shimizu. 1986. “Basic Statistical Analysis of Hydrological Data in Lake Biwa Basin.” Annuals of Disaster Prevention Research Institute, Kyoto University 29 (B-2): 157–171. In Japanese.
- Tanaka, S., and K. Takara. 1999. “Goodness-of-Fit and Stability Assessment in Flood Frequency Analysis.” Proceedings of Hydraulic Engineering 43: 127–132. In Japanese. https://doi.org/10.2208/prohe.43.127.
- Tehrani, F. S., M. Calvello, Z. Liu, L. Zhang, and S. Lacasse. 2022. “Machine Learning and Landslide Studies: Recent Advances and Applications.” Natural Hazards 114: 1197–1245. https://doi.org/10.1007/s11069-022-05423-7.
- Terada, H., and H. Nakaya. 2001. “Operating Methods of Critical Rainfall for Warning and Evacuation from Sediment-Related Disaster.” Technical Note of National Institute for Land and Infrastructure Management 5: 1–58. (In Japanese)
- Tofani, V., G. Bicocchi, G. Rossi, S. Segoni, M. D’Ambrosio, N. Casagli, and F. Catani. 2017. “Soil Characterization for Shallow Landslides Modeling: A Case Study in the Northern Apennines (Central Italy).” Landslides 14: 755–770. https://doi.org/10.1007/s10346-017-0809-8.
- Tsuguti, H., N. Seino, H. Kawase, Y. Imada, T. Nakaegawa, and I. Takayabu. 2019. “Meteorological Overview and Mesoscale Characteristics of the Heavy Rain Event of July 2018 in Japan.” Landslides 16: 363–371. https://doi.org/10.1007/s10346-018-1098-6.
- Wang, J., H. Qian, X. Su, and D. Zhang. 2021. “Research of Diagnosing Causes of Turbine Faults Based on PSO-LightGBM Algorithm.” Proceedings of the 40th Chinese Control Conference, Shanghai, People’s Republic of China, 26–28 July 2021: 4608–4615.
- Wang, G., N. Watanabe, K. Hoshikawa, G. Furuya, F. Cai, and S. Wu. 2023. “Diverse Shear Behaviors of Clayey Materials: Implications for Differing Landsliding Behaviors Within the Same Area in Niigata, Japan.” Engineering Geology 312: 106932. https://doi.org/10.1016/j.enggeo.2022.106932.
- Yoshimatsu, H., and S. Abe. 2006. “A Review of Landslide Hazards in Japan and Assessment of Their Susceptibility Using an Analytical Hierarchic Process (AHP) Method.” Landslides 3: 149–158. https://doi.org/10.1007/s10346-005-0031-y.
- Zhang, D., and Y. Gong. 2020. “The Comparison of LightGBM and XGBoost Coupling Factor Analysis and Prediagnosis of Acute Liver Failure.” IEEE Access 8: 220990–221003. https://doi.org/10.1109/ACCESS.2020.3042848.