
Abstract
Aims: This paper was to scrutinize the toxicity mechanism of anti-programmed death 1 (anti-PD-1) therapy-caused spinal cord injury (SCI). Methods: Bone marrow transplant Rag1−/− mice were used to establish SCI model. Results: Anti-PD-1 results in SCI via CD8+ T-cells activation, while excessive activation of CD8+ T-cells further aggravated SCI. Both anti-PD-1 and the activation of CD8+ T-cells induced the expression of apoptosis-related perforin, GrB and FasL, but suppressed PI-9 level. The opposite results were observed in the effects of neuroserpin on these factors. CD8+ T-cells activation induced neurotoxicity via upregulation perforin, GrB and FasL and inhibiting PI-9. Additionally, neuroserpin suppressed CD8+ T-cells activation via perforin/GrB/PI-9/FasL pathways. Conclusion: These results may provide theoretical foundation for the clinical treatment of SCI caused by anti-PD-1.
Plain language summary
What is this article about?
In the process of treating cancer, immune checkpoint inhibitors such as anti-programmed death 1 (anti-PD-1) therapy, as a form of immunotherapy, have developed rapidly and changed the way to manage cancers significantly. However, some cancer patients who receive immune checkpoint blockade treatment suffer from severe adverse effects including spinal cord injury (SCI). This article for the first time constructed a bone marrow transplant mouse model to explore the toxicity mechanism of anti-PD-1 therapy-caused SCI.
What were the results?
We found that anti-PD-1 therapy can induce the activation of immune cells, while immune cell activation further promotes self-destruction of nerve cells by regulating cell death pathways.
What do the results of the study mean?
The mechanism of anti-PD-1 therapy-caused SCI is to activate of immune cells through regulating cell death pathways, thereby inducing self-destruction of nerve cells. These findings provide theoretical foundation for the clinical treatment of SCI caused by anti-PD-1 therapy.
Successful establishment of spinal cord injury model via anti-programmed death 1 therapy
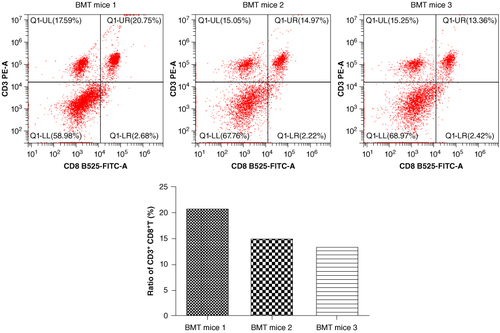
The ratio of CD3 + CD8+ T-cells was significantly increased in three randomly selected bone marrow transplant Rag1−/− mice.
Basso Mouse Scale for Locomotion score in the spinal cord injury (SCI) model group was lowered significantly and further decreased in SCI exacerbation group. While was restored in the SCI treatment group.
This study firstly explores the toxicity mechanism of anti-programmed death 1 therapy-caused SCI
Anti-programmed death 1 (anti-PD-1) therapy could induce the activation of CD8+ T-cells, while administration of neuroserpin suppressed CD8+ T-cells activation.
Anti-PD-1 therapy or naive CD8+ T-cells combination with anti-PD-1 therapy increases the levels of perforin, FasL and GrB, but decreases PI-9 level, while treatment with neuroserpin reverses the expression of these factors.
Limitations & future application
Some limitations of this research remain exist such as confirming the number of T- and B-cells in Rag1-/- mice and measuring the percentages of other immune cells except for CD8+ T-cells. Even so, this study also provides a theoretical basis for the clinical treatment of anti-PD-1 therapy-induced SCI to a certain extent.
1. Introduction
Numerous genetic and epigenetic alterations are existed in human cancers, leading to the uncontrolled proliferation and antigens expression of cancer cells [Citation1]. These uncontrolled antigens not only include novel proteins generated by gene rearrangement and mutation but also the normal proteins overexpressed by cancer cells [Citation2]. The traditional treatment for cancers including radiotherapy and chemotherapy is aimed to interfere with the growth and survival of neoplastic cells [Citation3]. Tumors can adopt multiple pathways to evade immune recognition actively such as endogenous ‘immune checkpoints’ that normally terminate immune responses following the activation of antigen. Recently, immune checkpoint inhibitors (ICIs), as a form of immunotherapy, have developed rapidly and changed the way to manage cancers significantly.
The programmed death 1 (PD-1) pathway has been broadly categorized as ‘immune checkpoint’. PD-1 cDNA was firstly isolated from apoptotic progenitor cells and T-cell hybridoma in mice in 1992 [Citation4]. Public data have demonstrated that PD-1 has two ligands namely PD-L1 and PD-L2, which is mainly related to inhibitory immune signaling and is an essential regulator of adaptive immune responses [Citation5]. Blockade of PD-1 can interact with PD-L1 to accelerate the growth of CD8+ T-cells and induce the cytotoxicity to cancer cells [Citation6,Citation7]. Recently, several monoclonal antibodies targeting PD-1 showed significantly clinical activity in the treatment of cancers. For example, nivolumab, as the first monoclonal antibody targeting PD-1, can induce approximately 40% of objective response rate (ORR) in melanoma patients [Citation8,Citation9]. Compared with standard chemotherapy, nivolumab is proved to extend overall survival of non-small-cell lung carcinoma patients effectively [Citation10]. Pembrolizumab is another monoclonal antibody directing at PD-1 and a phase III clinical trial on advanced melanoma has indicated that pembrolizumab is a more effective agent compared with ipilimumab (a monoclonal antibody targeting CTLA-4) in first-line treatment for melanoma [Citation11]. Meanwhile, pembrolizumab also shows relatively high ORR in patients with non-small-cell lung carcinoma, triple-negative breast cancer and bladder cancer [Citation12–14]. However, the systemic activation of the immune system not only attacks cancer cells, but also attacks the normal organs or tissues. Some cancer patients who receive immune checkpoint blockade treatment suffer from severe adverse effects known as immune-related adverse events (irAEs), causing damage to different tissues or organs [Citation15,Citation16]. WHO database of adverse drug reactions reported that from 2009 to 2018, there are 31,059 irAEs-related cases, among which 613 cases are fatal [Citation17]. The most frequent cause of fatal events with anti-PD-1 was hepatitis, pneumonitis and neurotoxicity [Citation17]. Therefore, it is imperative to potentiate the comprehension of immune-mediated toxicity mechanism behind anti-PD-1 therapy.
The current report for the first time constructed a bone marrow transplant (BMT) Rag1−/− mice to explore the toxicity mechanism of anti-PD-1 therapy-caused spinal cord injury (SCI). We found that anti-PD-1 therapy can induce the activation of CD8+ T-cells, while excessive activation of CD8+ T-cells further aggravate SCI. Additionally, neuroserpin (NSP) can suppress the growth and activation of CD8+ T-cells via perforin/granzyme B (GrB)/proteinase inhibitor 9 (PI-9)/Fas-ligand (FasL) pathways, eventually attenuating the progression of SCI caused by anti-PD-1 therapy. These findings provide theoretical foundation for the clinical treatment of SCI caused by anti-PD-1 therapy.
2. Methods
2.1. Ethical statement
All procedures in mice were executed in compliance with the NIH Guide for the Care and Use of Laboratory Animals and at the same time were approved by the Experimental Animal Ethics Committee of our institute.
2.2. BMT mice
An 8-week male Rag1−/− mice (C57BL/6 background) and a male wild type (WT) C57BL/6 mice were procured from Shanghai Model Organisms Center (Shanghai, China). C57BL/6 mice were served as donators, while Rag1−/− mice were as recipients. With the aid of X-RAD 320 x-ray Irradiator (Precision x-ray Inc., North Branford, CT, USA), Rag1−/− mice underwent total body irradiation (5.5 Gy). Approximately 12 h after irradiation, bone marrow cells (1 × 10⁷) isolated from WT C57BL/6 mice were injected into the recipient mice via tail vein. Then 4 weeks later, three recipient mice (BMT mice 1/2/3) were selected randomly to isolate peripheral blood mononuclear cells (PBMCs).
2.3. PBMCs isolation & flow cytometry analysis
Peripheral venous blood (1 ml) from tail vein of BMT Rag1−/− mice was collected in vials supplemented with anticoagulant. According to the instructions, PBMCs were isolated using the Ficoll density separation method (Solarbio Science & Technology, Beijing, China). Following the standard procedures of flow cytometry, PBMCs were incubated with anti-CD8 (cat. no. ab210214; Abcam, Cambridge, UK) and anti-CD3 (cat. no. ab22268; Abcam). The ratio of CD3 + CD8+ T-cells was calculated by FACSCalibur (BD Biosciences, CA, USA).
2.4. Isolation & identification of naive CD8+ T-cells
Naive CD8+ T-cells were isolated from the spleens of WT C57BL/6 mice. In brief, three randomly selected WT C57BL/6 mice were euthanized by overdose of sodium pentobarbital (200 mg/kg) via intraperitoneal injection. The spleens were collected and then disrupted to obtain a single-cell suspension. The naive CD8+ T-cells were enriched using magnetic MACS MicroBeads from Miltenyi Biotec (Auburn, CA, USA). The cells were coated with FITC-labeled antibodies specific for CD3 (cat. no. ab91493; Abcam), CD8 (cat. no. ab237367; Abcam), CD44 (cat. no. ab25064; Abcam) and CD62L (cat. no. ab24876; Abcam). Anti-FITC MicroBeads were then added and the suspension was passed over separation columns attached to a MACS magnet. The ratio of CD3 + CD8+ or CD44-CD62L+ was calculated using by FACSCalibur (BD Biosciences) (Supplementary Information 1).
2.5. Establishment of SCI model via anti-PD-1 therapy
The BMT Rag1−/− mice were separated into four groups (n = 6) randomly: the control group, which intraperitoneally injected with IgG (200 μg, Abcam); SCI model group, which intraperitoneally injected with anti-PD-1 (200 μg, Abcam); SCI exacerbation group, which were administered with naive CD8+ T-cells (5 × 10⁶) isolated from the spleens of WT C57BL/6 mice via tail vein and then intraperitoneally injected with anti-PD-1 (200 μg); SCI treatment group, which intrathecally injected with 25 μl NSP (20 μg/ml, Abcam) and then intraperitoneally injected with anti-PD-1 (200 μg). IgG or anti-PD-1 was injected once a week for four consecutive weeks. The motor function recovery of mice hindlimbs (n = 6 per group) was assessed by Basso Mouse Scale for Locomotion (BMS) score [Citation18]. Briefly, two independent raters were trained for the BMS recording and blind to the grouping of the mice for the entire experiment. Mice were evaluated using the BMS score on postoperative days 21. Each mouse was scored during free ambulation in an open field for 4 min using a 0–9 score rating system in accordance with standards in the scale. On postoperative 7 weeks, mice were euthanized by overdose of sodium pentobarbital (200 mg/kg) via intraperitoneal injection. They were used for the subsequent experiments.
2.6. Western blotting
The injured spinal cord (0.5 cm long; n = 6 per group) was excised, snap frozen in liquid nitrogen and transferred to -80°C until use. The tissue was grinded in liquid nitrogen and homogenized in RIPA lysis buffer containing 1% Protease/Phosphatase Inhibitor Cocktail (Cell Signaling Technology, MA, USA) for 30 min at 4°C. After centrifugation at 4°C and 18,000 × g for 20 min, the supernatant was collected and the concentration of total protein was quantified via a BCA protein assay Kit (Beyotime Biotechnology, Shanghai, China). Then, protein samples (40 μg protein/lane) that had been electrophoresed using a 10% SDS-PAGE gel was transferred onto PVDF membranes. The membranes were blocked with 5% nonfat milk for 1 h at 37°C, then incubated overnight with primary antibodies perforin (dilution in 1:20000; cat. no. 14580-1-AP; Proteintech, Wuhan, China), FasL (dilution in 1:1000; cat. no. #72062; Cell Signaling Technology), GrB (dilution in 1:1000; cat. no. 13588-1-AP; Proteintech), PI-9 (dilution in 1:20000; cat. no. 67950-1-Ig; Proteintech) and GAPDH (dilution in 1:50000; cat. no. 60004-1-Ig; Proteintech) at 4°C and the HRP-conjugated secondary antibodies (dilution in 1:1000; cat. no. ab205719; Abcam) at 25°C for 1 h. Blot signals were measured via an Enhanced Chemiluminescence Detection Kit (Beyotime Biotechnology).
2.7. RNA extraction & qRT-PCR
Total RNA from spinal cords (0.5 cm long; n = 6 per group) was extracted with the aid of Trizol reagent (Invitroge n, CA, USA). To determine the mRNA expression levels of perforin, FasL, GrB and PI-9, the extracted RNA was firstly employed into cDNA via a Hifair® II 1st Strand cDNA Synthesis SuperMix Kit (Yeasen Biotechnology, Shanghai, China) and then added Hieff® qPCR SYBR Green Master Mix (Yeasen Biotechnology) for the subsequent PCR analysis on an ABI 7900 Real-Time PCR System (Applied Biosystems, CA, USA). Gene expression was calculated with 2-ΔΔCt methods, with the controls of GAPDH. Primer sequences used were listed in .
Table 1. Real-time PCR primer synthesis list.
2.8. Section preparation
The spinal cords (1 cm in each direction from the epicenter; n = 6 per group) were harvested and immediately fixed overnight in 4% paraformaldehyde (PFA) at 4°C. The tissues were then immersed in 30% sucrose-paraformaldehyde solution until they sunk to the bottom. The tissues were embedded in paraffin and snap frozen in liquid nitrogen. A cryostat (Leica, Wetzlar, Germany) was used to obtain 4-μm thick slices, which were stored at -80°C and used for subsequent hematoxylin and eosin (HE) staining, silver staining and immunofluorescence.
2.9. HE staining
HE staining was performed in accordance with a well-established protocol [Citation19]. The slices were soaked twice in dimethylbenzene for 10 min each for dewaxing. The slices were immersed in absolute alcohol for 2 min and then in 95%, 90% and 80% alcohol for 1 min each. They were washed with distilled water for 2 min, stained with hematoxylin for 5 min and washed with tap water. Hydrochloric acid (0.5%)/alcohol (70%) was used to differentiate the slices, after which they were washed with tap water. The samples were stained with 0.5% eosin for 3 min and successively immersed in 80%, 90%, 95% and 100% alcohol for 1 min each for dehydration. The slices were cleared by being immersed in dimethylbenzene twice for 5 min each. After mounting with neutral gum, images were acquired under an optical microscope (OLYMPUS BX53; Olympus, Tokyo, Japan).
2.10. Silver staining
The sections were placed into xylene and then rehydrated through alcohol and water. The silver solution (1% silver nitrate in an aqueous solution) as preheated to 60°C and the sections were incubated in the silver solution for 3 h. After a quick wash with distilled water, the sections were placed into the reducing solution at 45°C for 1 h and were then washed several times with distilled water. Finally, the sections were observed under an optical microscope (Olympus).
2.11. Immunofluorescence
Spinal cord slices were deparaffinized and rehydrated. After immersing heated sodium citrate for antigen retrieval, the slices were blocked with goat serum for 15 min at room temperature. After that, the slices were incubated with primary antibodies CD8 (dilution in 1:50; cat. no. 66868-1-Ig; Proteintech) and CD3 (dilution in 1:50; cat. no. 60181-1-Ig; Proteintech) at 4°C overnight. After washing with PBS three-times, the slices were incubated with FITC-labeled secondary antibody (1: 200; cat. no. ab6785; Abcam) for 60 min in dark at room temperature. DAPI was used for nuclear staining. Following mounting with antifade mounting medium, the images of slices were photographed with the aid of a fluorescence microscope from OLYMPUS.
2.12. ELISA
Mouse Perforin ELISA Kit was acquired from Sangon Biotech (Shanghai, China). Mouse FasL ELISA Kit was obtained from Abcam. According to vendors' instructions, the concentrations of perforin and FasL in the serum of BMT Rag1−/− mice were determined via the corresponding commercial Kits. The absorbance was measured at 450 nm on a microplate reader from BioTek Instruments (Winooski, VT, USA).
2.13. Statistical analysis
All data were analyzed with SPSS 23.0 statistical software (SPSS, IL, USA) and showed in the form of mean ± standard deviation. One-way analysis of variance (ANOVA) was for comparison between multiple groups. Tukey’s multiple comparison test was used for pairwise comparison after ANOVA. p-values <0.05 were considered statistically significant.
3. Results
3.1. BMT Rag1−/− mice are established successfully
Early in 1990s, the characterization and generation of Rag1−/− mice have been described explicitly [Citation20]. The lymphoid organs of Rag1−/− mice were found to lack mature T and B lymphocytes. Therefore, they are unable to produce allogeneic rejection to cells from allogeneic sources. We used x-ray Irradiator to irradiate Rag1−/− mice for clearing away the bone marrow cells. These mice were served as recipients to receive bone marrow cells isolated from WT C57BL/6 mice. We found that the ratio of CD3 + CD8+ T-cells was significantly increased among three randomly selected BMT Rag1−/− mice (), suggesting that BMT Rag1−/− mice were established successfully.
Figure 1. BMT Rag1−/− mice are established successfully. The ratio of CD3 + CD8+ T-cells was significantly increased in three randomly selected BMT Rag1−/− mice, indicating the successful establishment of BMT Rag1−/− mice.
BMT: Bone marrow transplant; Rag: Recombination activating gene.
3.2. Successful establishment of SCI model via anti-PD-1 therapy
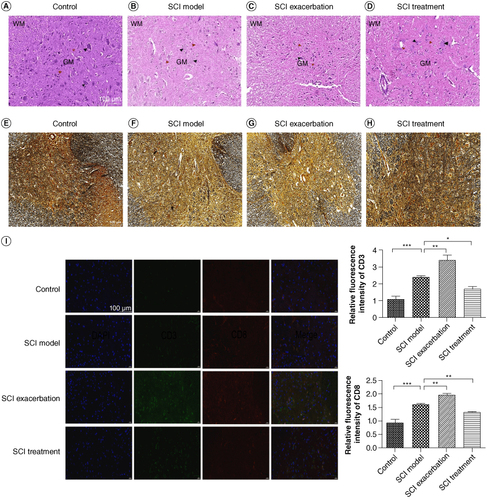
Because anti-PD-1 therapy can lead to SCI during cancer treatment, we tried to establish a novel SCI mouse model via anti-PD-1 therapy. BMS score was a new method to evaluate the motor functions of mice after SCI that conducted by Basso et al. in 2006. We found that compared with the control group, BMS score in the SCI model group decreased overtly (, p < 0.001). By contrast to the mice in the SCI model group, BMS score of mice further reduced in the SCI exacerbation group (p < 0.05), while was restored in the SCI treatment group (p < 0.001). As illustrated in A–D, HE staining results showed that the spinal cord structure of the control group was clearly visible, with abundant numbers of nerve fibers and neurons. The arrangement of spinal cord tissue in SCI model group was disordered, accompanied by the formation of spinal cord cavities. These situations were observed to be further aggravated in the SCI exacerbation group and at the same time, it was difficult to distinguish between gray and white matter. In the SCI treatment group, we found that the spinal cord tissue structure was relatively visible and gray and white matter could be clearly distinguished. As depicted in E–H, the silver staining results showed that the spinal gray matter neurons in the control group of mice were abundant and arranged neatly. Compared with the control group, the gray matter neurons in the model group were significantly reduced and structurally disordered. Complete neurons could hardly be seen in SCI exacerbation group. Compared with the SCI model group, the condition of the treatment group was significantly improved, with a significant increase in the number of neurons. Additionally, we further demonstrated that the relative fluorescence intensity of CD3 and CD8 was remarkably increased in SCI model group compared with that of control group (I, p < 0.001). Meanwhile, in contrast to the SCI model group, both CD3 and CD8 fluorescence intensities were further elevated in the SCI exacerbation group (p < 0.01), while were reduced in the SCI treatment group to some extent (p < 0.05).
Figure 2. Anti-PD-1 therapy or naive CD8+ T-cells combination with anti-PD-1 therapy leads to severe SCI in BMT Rag1−/− mice, as assessed by BMS scores. Compared with the control group, the BMS score for SCI model group lowered significantly. By contrast to the mice in the SCI model group, BMS score of mice further reduced in the SCI exacerbation group, while was restored in the SCI treatment group.
*p < 0.05; ***p < 0.001.
BMT: Bone marrow transplant; BMS: Basso Mouse Scale for Locomotion; PD-1: Programmed death 1; Rag: Recombination activating gene; SCI: Spinal cord injury.
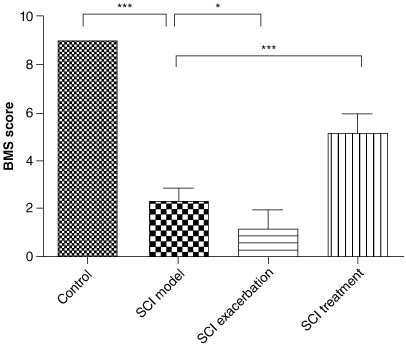
Figure 3. Successful establishment of SCI model via anti-PD-1 therapy. The pathological changes among the BMT Rag1−/− mice in the control (A), SCI model (B), SCI exacerbation (C) and SCI treatment (D) groups were observed via HE staining. WM represents white matter, GM represents gray matter, black arrow points to neurons and red arrow points to nerve fibers. Scale bar = 100 μm. Silver staining was conducted to further observe the structure of spinal cord in the control (E), SCI model (F), SCI exacerbation (G) and SCI treatment (H) groups. Scale bar = 100 μm. (I) Relative fluorescence intensity of CD3 or CD8 was calculated via immunofluorescence. Scale bar = 100 μm.
*p < 0.05; **p < 0.01; ***p < 0.001.
BMT: Bone marrow transplant; HE: Hematoxylin and eosin; PD-1: Programmed death 1; Rag: Recombination activating gene; SCI: Spinal cord injury.
3.3. Anti-PD-1 therapy or naive CD8+ T-cells combination with anti-PD-1 therapy increases the levels of perforin, FasL & GrB, but decreases PI-9 level, while treatment with NSP reverses the expression of these factors
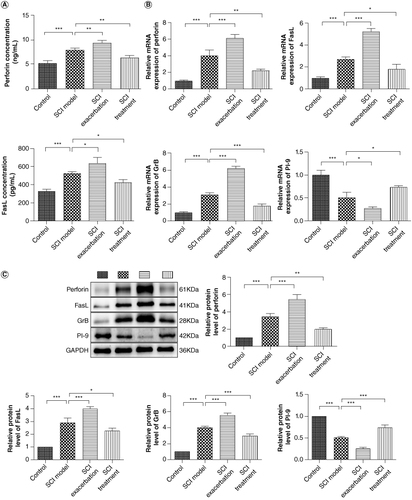
Perforin/GrB and FasL are two main pathways involved in cell apoptosis [Citation21,Citation22]. Meanwhile, proteinase inhibitor 9 (PI-9) is now the only known intracellular inhibitor of GrB [Citation23]. To ascertain the role of CD8+ T-cell in SCI caused by anti-PD-1 therapy, the levels of perforin, FasL, GrB and PI-9 in serum or spinal cord of BMT Rag1−/− mice were determined. As shown in A, the serum concentrations of perforin and FasL in SCI mice were dramatically increased compared with those of control mice (p < 0.001). Compared with those in the SCI model, perforin and FasL concentrations in SCI exacerbation group were further elevated (p < 0.05) but were reduced in SCI treatment group (p < 0.05). We found that the mRNA expression of perforin, FasL and GrB in spinal cords of SCI mice was markedly upregulated relative to that of the control mice (B, p < 0.001). As expected, compared with the SCI group, further upregulation of perforin, FasL and GrB mRNA expression levels were observed in SCI exacerbation group (p < 0.001) but pronounced downregulation was found in SCI treatment group (p < 0.05). The mRNA expression of PI-9 was opposite to the result of GrB due to its inhibitor role of GrB (p < 0.05). For the protein levels of perforin, FasL, GrB and PI-9, similar patterns with the results of qRT-PCR were observed (C, p < 0.05).
Figure 4. Anti-PD-1 therapy or naive CD8+ T-cells combination with anti-PD-1 therapy increases the levels of perforin, FasL and GrB, but decreases PI-9 level, while treatment with NSP reverses the expression of these factors. (A) The serum concentrations of perforin and FasL were measured by ELISA. (B) The mRNA expression of perforin, GrB, PI-9 and FasL was detected by qRT-PCR. (C) The protein levels of perforin, GrB, PI-9 and FasL were determined by western blotting.
*p < 0.05; **p < 0.01; ***p < 0.001.
FasL: Fas-ligand; GrB: Granzyme B; NSP: Neuroserpin; PD-1: Programmed death 1; PI-9: Proteinase inhibitor 9.
4. Discussion
In recent decades, the oncology field has developed rapidly. Although traditional chemotherapy and targeted drugs continue to be used, treatment options for cancers now tend to ICIs. By blockade of checkpoint proteins, ICIs make the immune cells such as T-cells to better identify and destroy cancerous cells [Citation24]. Thus far, several PD-1 inhibitors such as nivolumab and pembrolizumab have generated significant clinical benefits by inducing regression of advanced and metastatic tumors and improving survival [Citation25,Citation26]. However, ICIs can affect immunologic homeostasis and thus lead to the occurrence of irAEs [Citation24]. It is urgent to explore and establish a novel animal model to investigate the mechanism underlying irAEs.
Recombination activating genes (Rags) play an important role in the V (D) J recombination process of B-cell receptors and T-cell receptors [Citation27]. Both Rag1 and Rag2 are indispensable in the V (D) J rearrangement process of lymphocytes [Citation27]. The deficiency of Rag1 or Rag2 can lead to the development arrest of B and T lymphocytes (B-cells arrest at the B220-CD43 + IgM- stage and T-cells arrest at the CD3-CD4-CD8 + CD25+ stage) and unable to produce mature B and T lymphocytes [Citation28,Citation29]. Therefore, mice with Rag1 or Rag2 knocking-down lack mature T/B lymphocytes. They have normal appearance and reproductive ability, but are unable to produce allogeneic rejection to cells from allogeneic sources. Therefore, they can be used as carriers for xenograft models and immunological researches. For example, He et al. knocked out Rag1 and Rag2 in Sprague Dawley rat to establish a patient-derived xenograft rat model of lung squamous cell carcinoma [Citation30]. Weckbach et al. used Rag1−/− mice as animal models to explore the role of adaptive immunity in contributing to post-traumatic neuroinflammation and neuropathology after head injury [Citation31]. It is regrettable that there are still limited researches on irAEs based on Rag1−/− mice. In this study, we sought to develop a novel mouse model that could overcome these issues. Following receiving 5.5 Gy of total body irradiation, Rag1−/− mice (C57BL/6 background) as recipients received bone marrow cells isolated from WT C57BL/6 mice. We found that the ratio of CD8+ T-cells was significantly increased among three randomly selected BMT Rag1−/− mice. These results implied that the immune system of Rag1−/− mice was activated and BMT Rag1−/− mice were established successfully. But it seems that this operation has certain limitation. Although in the peripheral blood, spleen and thymus of Rag1-/- mice, the numbers of T-cells and B-cells approach negligible levels (almost 0) and this has been widely acknowledged. In fact, numerous studies have used the percentage CD45+ cells to characterize the numbers of T- and B-cells. For the rigor of the experiments, we consider further confirming the number of T- and B-cells in Rag1-/- mice in future research. Some researches indicated that the occurrence of irAEs such as SCI during cancer treatment is related to the activation of CD8 + T-cells by anti-PD-1 therapy as there is a large number of CD8 + T-cells infiltrated in spinal cord tissue and lead to the pathological changes of spinal cord demyelination and swelling [Citation32,Citation33]. Therefore, based on BMT Rag1−/− mouse model, we further establish a SCI model via anti-PD-1 therapy. As expected, we found that blockade of PD-1 was indeed induce the occurrence and development of SCI. The mechanism is related to the activation of CD8 + T-cells as BMT Rag1−/− mice in the SCI exacerbation group further validated this conclusion.
The pathophysiology of SCI involves multiple characteristics, among which the apoptosis of neurons and oligodendrocytes is an important feature that may contribute greatly to the paralysis of patients with SCI [Citation34,Citation35]. Perforin/GrB and FasL are two main pathways involved in cell apoptosis [Citation21,Citation22]. In perforin/GrB-mediated apoptosis, perforin facilitates release of GrB and other granzyme proteases from the endosome [Citation21]. Subsequently, GrB together with other granzymes enter the target cell by endocytosis and induces apoptosis by direct cleavage of non-caspase and caspase substrates [Citation21]. In FasL-mediated apoptosis, FasL binds to its cognate receptor Fas and then apoptotic signals are delivered to the target cells, followed by activating the mitochondrial apoptosis pathway in mitochondria [Citation36,Citation37]. As the only known intracellular inhibitor of GrB, high levels of PI-9 can partially suppress CD8+ T-cell-induced apoptosis [Citation38]. Additionally, previous data have confirmed that CD8+ T-cells can generally induce cytotoxicity to target cells through perforin/GrB and FasL pathways [Citation39]. Based on the results that have been obtained, we speculated the reason why CD8+ T-cells activation can induce SCI is because it may promote neuronal apoptosis by regulating perforin/GrB/PI-9/FasL pathways. As expected, we found that anti-PD-1 therapy could elevate the levels of perforin, GrB and FasL, but reduce PI-9 expression. Not only that, the activation of CD8+ T-cells further upregulated the expression of perforin, GrB and FasL and downregulated PI-9 expression. In addition, the opposite results were observed in the effects of NSP on the levels of perforin, GrB, FasL and PI-9. These results suggested that NSP may target these effector molecules to suppress the activation of CD8+ T-cells and therefore attenuate the progression of SCI, which is consistent with the neuroprotective role of NSP in previous studies [Citation40–42]. Here also exists a limitation that should not be ignored. Other immune cells such as NK cells also produce GrB along with perforin to mediate apoptosis. FasL is expressed in other immune cells such as macrophages, astrocytes and oligodendrocytes. In addition, macrophages and T-cells express Fas. Therefore, the measurement for the percentages of these cells is necessary. We will consider this in future studies.
5. Conclusion
This groundbreaking work develops a novel animal model, namely using BMT Rag1−/− mice as the background to explore the mechanism of SCI during anti-PD-1 therapy. The activation of CD8+ T-cells can induce neurotoxicity via upregulation the expression of perforin, GrB and FasL and inhibiting PI-9 expression. Additionally, NSP may target perforin/GrB/PI-9/FasL pathways to suppress the activation of CD8+ T-cells, eventually attenuating the progression of SCI caused by anti-PD-1 therapy. This may provide information and insights for reducing the occurrence of anti-PD-1-related irAEs.
Author contributions
M Ding and X Wu made substantial contributions to the conception and design of the work. H Chen, Z Lu and X Ni made substantial contributions to the acquisition, analysis and interpretation of data for the work. H Chen drafted the manuscript. H Zhang and G Chen revised the manuscript critically for important intellectual content. All authors agreed to be accountable for all aspects of the work in ensuring that questions related to the accuracy and agreed final approval of the version to be published.
Financial disclosure
This work was supported by The Basic Public Welfare Research Program of Zhejiang Province (Project No: LGD21C040001) and The Science and Technology Project of Jinhua City in China (Project No: 2022-3-146). The authors have no other relevant affiliations or financial involvement with any organization or entity with a financial interest in or financial conflict with the subject matter or materials discussed in the manuscript apart from those disclosed.
Writing disclosure
No writing assistance was utilized in the production of this manuscript.
Ethical conduct of research
Experiments for animals were conducted in compliance with the NIH Guide for the Care and Use of Laboratory Animals and approved by the Experimental Animal Ethics Committee of Jinhua Food and Drug Inspection and Testing Research Institute (approval no. AL-JSYJ202023).
Supplementary Materials
Download Zip (500.5 KB)Acknowledgments
We acknowledge the strong support of Jinhua Guangfu Cancer Hospital, Jinhua Food and Drug Inspection and Testing Research Institute and School of Medicine, Jinhua Polytechnic.
Supplemental material
Supplemental data for this article can be accessed at https://doi.org/10.1080/1750743X.2024.2383557
Competing interests disclosure
The authors have no competing interests or relevant affiliations with any organization or entity with the subject matter or materials discussed in the manuscript. This includes employment, consultancies, stock ownership or options and expert testimony.
Additional information
Funding
References
- Topalian SL, Hodi FS, Brahmer JR, et al. Safety, activity and immune correlates of anti-PD-1 antibody in cancer. N Engl J Med. 2012;366:2443–2454. doi:10.1056/NEJMoa1200690
- Lawrence MS, Stojanov P, Polak P, et al. Mutational heterogeneity in cancer and the search for new cancer-associated genes. Nature. 2013;499:214–218. doi:10.1038/nature12213
- Seidel JA, Otsuka A, Kabashima K, et al. Anti-PD-1 and anti-CTLA-4 therapies in cancer: mechanisms of action, efficacy and limitations. Front Oncol. 2018;8:86. doi:10.3389/fonc.2018.00086
- Ishida Y, Agata Y, Shibahara K. Induced expression of PD-1, a novel member of the immunoglobulin gene superfamily, upon programmed cell death. EMBO J. 1992;11:3887–3895. doi:10.1002/j.1460-2075.1992.tb05481.x
- Nishimura H, Nose M, Hiai H, et al. Development of lupus-like autoimmune diseases by disruption of the PD-1 gene encoding an ITIM motif-carrying immunoreceptor. Immunity. 1999;11:141–151. doi:10.1016/S1074-7613(00)80089-8
- Postow MA, Sidlow R, Hellmann MD. Immune-related adverse events associated with immune checkpoint blockade. N Engl J Med. 2018;378:158–168. doi:10.1056/NEJMra1703481
- Boussiotis VA. Molecular and biochemical aspects of the PD-1 checkpoint pathway. N Engl J Med. 2016;375:1767–1778. doi:10.1056/NEJMra1514296
- Topalian SL, Sznol M, McDermott DF, et al. Survival, durable tumor remission and long-term safety in patients with advanced melanoma receiving nivolumab. J Clin Oncol. 2023;41:943–954. doi:10.1200/JCO.22.02272
- Robert C, Long GV, Brady B, et al. Nivolumab in previously untreated melanoma without BRAF mutation. N Engl J Med. 2015;372:320–330. doi:10.1056/NEJMoa1412082
- Rizvi NA, Mazieres J, Planchard D, et al. Activity and safety of nivolumab, an anti-PD-1 immune checkpoint inhibitor, for patients with advanced, refractory squamous non-small-cell lung cancer (CheckMate 063): a phase 2, single-arm trial. Lancet Oncol. 2015;16:257–265. doi:10.1016/S1470-2045(15)70054-9
- Robert C, Schachter J, Long GV, et al. Pembrolizumab versus ipilimumab in advanced melanoma. N Engl J Med. 2015;372:2521–2532. doi:10.1056/NEJMoa1503093
- Garon EB, Rizvi NA, Hui R, et al. Pembrolizumab for the treatment of non-small-cell lung cancer. N Engl J Med. 2015;372:2018–2028. doi:10.1056/NEJMoa1501824
- Nanda R, Chow LQ, Dees EC, et al. Pembrolizumab in patients with advanced triple-negative breast cancer: phase Ib KEYNOTE-012 study. J Clin Oncol. 2016;34:2460–2467. doi:10.1200/JCO.2015.64.8931
- O'Donnell PH, Plimack ER, Bellmunt J, et al. Pembrolizumab (Pembro; MK-3475) for advanced urothelial cancer: results of a phase IB study. J Clin Oncol. 2015;33:296–296. doi:10.1200/jco.2015.33.7_suppl.296
- Pollack MH, Betof A, Dearden H, et al. Safety of resuming anti-PD-1 in patients with immune-related adverse events (irAEs) during combined anti-CTLA-4 and anti-PD1 in metastatic melanoma. Ann Oncol. 2018;29:250–255. doi:10.1093/annonc/mdx642
- Johnson DB, Balko JM, Compton ML, et al. Fulminant myocarditis with combination immune checkpoint blockade. N Engl J Med. 2016;375:1749–1755. doi:10.1056/NEJMoa1609214
- Wang DY, Salem JE, Cohen JV, et al. Fatal toxic effects associated with immune checkpoint inhibitors: a systematic review and meta-analysis. JAMA Oncol. 2018;4:1721–1728. doi:10.1001/jamaoncol.2018.3923
- Basso DM, Fisher LC, Anderson AJ, et al. Basso Mouse Scale for locomotion detects differences in recovery after spinal cord injury in five common mouse strains. J Neurotrauma. 2006;23:635–659. doi:10.1089/neu.2006.23.635
- Fischer AH, Jacobson KA, Rose J, et al. Hematoxylin and eosin staining of tissue and cell sections. CSH Protoc. 2008;1:pdb.prot4986. doi:10.1101/pdb.prot4986
- Mombaerts P, Iacomini J, Johnson RS, et al. RAG-1-deficient mice have no mature B and T lymphocytes. Cell. 1992;68:869–877. doi:10.1016/0092-8674(92)90030-G
- Raja SM, Metkar SS, Froelich CJ. Cytotoxic granule-mediated apoptosis: unraveling the complex mechanism. Curr Opin Immunol. 2003;15:528–532. doi:10.1016/S0952-7915(03)00111-0
- Peng SL. Fas (CD95)-related apoptosis and rheumatoid arthritis. Rheumatology (Oxford). 2006;45:26–30. doi:10.1093/rheumatology/kei113
- Sun J, Bird CH, Sutton V, et al. A cytosolic granzyme B inhibitor related to the viral apoptotic regulator cytokine response modifier A is present in cytotoxic lymphocytes. J Biol Chem. 1996;271:27802–27809. doi:10.1074/jbc.271.44.27802
- Brahmer JR, Lacchetti C, Schneider BJ, et al. Management of immune-related adverse events in patients treated with immune checkpoint inhibitor therapy: American Society of Clinical Oncology Clinical Practice Guideline. J Clin Oncol. 2018;36:1714–1768. doi:10.1200/JCO.2017.77.6385
- Brahmer JR, Drake CG, Wollner I, et al. Phase I study of single-agent anti-programmed death-1 (MDX-1106) in refractory solid tumors: safety, clinical activity, pharmacodynamics and immunologic correlates. J Clin Oncol. 2010;28:3167–3175. doi:10.1200/JCO.2009.26.7609
- Ribas A, Hodi F, Kefford R, et al. Efficacy and safety of the anti-PD-1 monoclonal antibody MK-3475 in 411 patients (pts) with melanoma (MEL). J Clin Oncol Official J Am Soc Clin Oncol. 2014;32:LBA9000. doi:10.1200/jco.2014.32.18_suppl.lba9000
- Carmona LM, Schatz DG. New insights into the evolutionary origins of the recombination-activating gene proteins and V(D)J recombination. FEBS J. 2017;284:1590–1605. doi:10.1111/febs.13990
- Ott de Bruin L, Yang W, Capuder K, et al. Rapid generation of novel models of RAG1 deficiency by CRISPR/Cas9-induced mutagenesis in murine zygotes. Oncotarget. 2016;7:12962–12974. doi:10.18632/oncotarget.7341
- van Til NP, de Boer H, Mashamba N, et al. Correction of murine Rag2 severe combined immunodeficiency by lentiviral gene therapy using a codon-optimized RAG2 therapeutic transgene. Mol Ther. 2012;20:1968–1980. doi:10.1038/mt.2012.110
- He D, Zhang J, Wu W, et al. A novel immunodeficient rat model supports human lung cancer xenografts. FASEB J. 2019;33:140–150. doi:10.1096/fj.201800102RR
- Weckbach S, Neher M, Losacco JT, et al. Challenging the role of adaptive immunity in neurotrauma: rag1(-/-) mice lacking mature B and T-cells do not show neuroprotection after closed head injury. J Neurotrauma. 2012;29:1233–1242. doi:10.1089/neu.2011.2169
- Yu W, Sun J, Wang T, et al. The effect of microwave ablation combined with anti-PD-1 monoclonal antibody on T cell subsets and long-term prognosis in patients suffering from non-small-cell lung cancer. Comput Math Methods Med. 2022;2022:7095423. doi:10.1155/2022/7095423
- Zhang Y, Zhu T, Wang Q, et al. Effects of PD-1 inhibitor combined with anti-angiogenic drugs on efficacy and immune function of non-small cell lung cancer. Am J Transl Res. 2022;14:8225–8233.
- Ghavami S, Shojaei S, Yeganeh B, et al. Autophagy and apoptosis dysfunction in neurodegenerative disorders. Prog Neurobiol. 2014;112:24–49. doi:10.1016/j.pneurobio.2013.10.004
- Zhang N, Yin Y, Xu SJ, et al. Inflammation & apoptosis in spinal cord injury. Indian J Med Res. 2012;135:287–296.
- Abrahams VM, Kamsteeg M, Mor G. The Fas/Fas ligand system and cancer: immune privilege and apoptosis. Mol Biotechnol. 2003;25:19–30. doi:10.1385/MB:25:1:19
- Mustafa N, Mitxelena J, Infante A, et al. E2f2 attenuates apoptosis of activated T lymphocytes and protects from immune-mediated injury through repression of Fas and FasL. Int J Mol Sci. 2021;23:311. doi:10.3390/ijms23010311
- Barrie MB, Stout HW, Abougergi MS, et al. Antiviral cytokines induce hepatic expression of the granzyme B inhibitors, proteinase inhibitor 9 and serine proteinase inhibitor 6. J Immunol. 2004;172:6453–6459. doi:10.4049/jimmunol.172.10.6453
- Cunningham TD, Jiang X, Shapiro DJ. Expression of high levels of human proteinase inhibitor 9 blocks both perforin/granzyme and Fas/Fas ligand-mediated cytotoxicity. Cell Immunol. 2007;245:32–41. doi:10.1016/j.cellimm.2007.03.004
- Yepes M, Sandkvist M, Wong MK, et al. Neuroserpin reduces cerebral infarct volume and protects neurons from ischemia-induced apoptosis. Blood. 2000;96:569–576. doi:10.1182/blood.V96.2.569.014k35_569_576
- Li Z, Liu F, Zhang L, et al. Neuroserpin restores autophagy and promotes functional recovery after acute spinal cord injury in rats. Mol Med Rep. 2018;17:2957–2963.
- Ding S, Chen Q, Chen H, et al. The neuroprotective role of neuroserpin in ischemic and hemorrhagic stroke. Curr Neuropharmacol. 2021;19:1367–1378. doi:10.2174/1570159X18666201008113052