
 ?Mathematical formulae have been encoded as MathML and are displayed in this HTML version using MathJax in order to improve their display. Uncheck the box to turn MathJax off. This feature requires Javascript. Click on a formula to zoom.
ABSTRACT
Purpose
To characterize the effect of glasdegib on cardiac repolarization (QTc) in patients with advanced cancer.
Methods
A concentration–QTc model was developed using data from two glasdegib single-agent, dose-escalation trials. Triplicate electrocardiogram was performed at pre-specified timepoints paired with pharmacokinetic blood collections after a single dose and at steady-state. Changes in QTc from baseline were predicted by model-based simulations at the clinical dose (100 mg QD) and in a supratherapeutic setting.
Results
Glasdegib did not affect the heart rate, but had a positive effect on the corrected QT interval, described by a linear mixed-effects model with ΔQTcF (QTc using Fridericia’s formula) as the dependent variable with glasdegib plasma concentrations from doses of 5–640 mg QD. The predicted mean QTcF change (upper bound of the 95% CI) was 5.30 (6.24) msec for the therapeutic 100-mg QD dose; at supratherapeutic concentrations (40% and 100% increase over the therapeutic Cmax), it was 7.42 (8.74) and 12.09 (14.25) msec, respectively.
Conclusions
The relationship of glasdegib exposure and QTc was well characterized by the model. The effect of glasdegib on the QTc interval did not cross the threshold of clinical concern for an oncology drug.
Trial registration
ClinicalTrials.gov ID: NCT01286467 and NCT00953758.
1. Introduction
The assessment of the potential of a drug to delay cardiac repolarization is a requirement in all new drug applications. Non-antiarrhythmic drugs could have the undesirable property of delaying cardiac repolarization, which has been associated with serious cardiac arrythmias, including Torsades de pointes (TdP), that can cause sudden cardiac death. The duration of the QT interval corrected for heart rate (QTc) is the most commonly used measurement to evaluate delays in cardiac repolarization. The original International Conference on Harmonisation (ICH) E14 guidance recommended performing a thorough QT (TQT) study to characterize the potential of a drug to prolong the QT interval [Citation1]. A TQT study is typically performed in healthy volunteers, and the study design includes placebo and active control treatments, in addition to at least one supratherapeutic dose group. In revision 3 of the E14 guidance, the ICH provides an update on the use of concentration–QT (exposure–response [E-R]) modeling as an alternative to a TQT study. The revision identifies that the data included in the analysis do not need to come from a dedicated QT trial and may be aggregated across multiple trials [Citation2,Citation3]. The potential for E-R modeling to be presented in lieu of a TQT study represents an important development and acknowledgment of the value of modeling and simulation in drug development. Garnett et al. published a White Paper on concentration-QTc modeling [Citation4] to propose recommendations for designing studies to use this modeling as the primary analysis and reporting the results of the analysis to support regulatory submissions. For decision-making, the concentration of interest will be derived from the drug development program and, therefore, can be treated as a prediction variable without concerns of uncertainty.
Tsamandouras et al. evaluated several different phase 1 study designs – parallel-group, 4-period crossover sequential cohorts, and 4-period crossover interleaving cohorts – evaluating and comparing their power to identify drug effects on QT interval via E-R modeling [Citation5]. It was found that data from first-in-human studies (first-in-patient for oncology) could be used to detect the true drug effect on the QT interval. Taking various factors, such as half-life of the compound and safety concerns about drug exposure, into consideration, it seems feasible that a purposefully selected design of phase 1 study could generate data for E-R modeling that accurately predicts drug effect on the QT interval, replacing a TQT study. While these study designs typically included placebo groups, which are generally not appropriate for oncology trials, the intention of designing phase 1 dose-finding studies from which a concentration-QT analysis can characterize the effect on the QT interval, in lieu of a TQT study, is clearly an interest across therapeutic areas.
Glasdegib (PF-04449913) is a potent and selective, orally administered inhibitor of Smoothened (SMO), a key component of the Hedgehog (Hh) signaling pathway. The Hh pathway regulates cell differentiation and self-renewal in the developing embryo, and is typically silenced in adult tissues. Aberrant Hh signaling has been identified in many solid tumor types and in hematologic malignancies. Glasdegib is approved in the United States in combination with low-dose cytarabine for the treatment of newly diagnosed acute myeloid leukemia (AML) in adult patients who are ≥75 years old or who have comorbidities that preclude the use of intensive induction chemotherapy [Citation6]. Glasdegib has been studied in patients across multiple hematologic and solid tumor malignancies. It is currently being further evaluated in phase 3 studies, in combination with chemotherapy, in patients with AML in both the intensive and non-intensive setting (NCT03416179), and also in myelodysplastic syndrome (phase 2, NCT02367456), at the clinical dose of 100 mg, orally, once a day (PO QD).
In pre-clinical evaluation using an in vitro assay in human embryonic kidney 293 cells, glasdegib demonstrated the ability to inhibit human ether-à-go-go–related gene (hERG) potassium channels in a concentration-dependent manner; this proarrythmic effect suggested the potential to affect the cardiovascular system. Additionally, in an in-vivo single-dose cardiovascular study in dogs, glasdegib demonstrated dose-dependent QTc prolongation [Citation7].
In the clinical setting, two glasdegib single-agent, dose-ranging studies were conducted in patients with cancer, with doses ranging from 5 mg QD to 640 mg QD. In the first-in-patient dose-escalation study in select hematologic malignancies (Study B1371001, NCT00953758), following single-agent glasdegib treatment (5–600 mg QD), some patients experienced a QTc >500 msec following multiple doses at the two highest evaluated dose levels of 400 mg QD (maximum tolerated dose [MTD]) and 600 mg QD (maximum administered dose) [Citation8]. Study B1371002 (NCT01286467) evaluated single-agent glasdegib doses of 80–640 mg QD in patients with advanced solid tumors. Following daily administration of glasdegib at the two highest dose levels tested, 320 mg (n = 7) and 640 mg (n = 8) QD, one instance each of QTc >500 msec was observed [Citation9]. Glasdegib is primarily metabolized by the CYP3A4 pathway, with minor contributions by CYP2C8 and UGT1A9. Glasdegib accounts for 69% of the total circulating drug-related material in plasma. Following a single oral dose of 100 mg radiolabeled glasdegib, 49% (17% unchanged) of the administered dose was eliminated in the urine and 42% (20% unchanged) of the administered dose was eliminated in the feces [Citation10–12]. In both studies, patients were required to have adequate renal and hepatic function as specified per the inclusion criteria for enrollment into the clinical trial [Citation8,Citation9].
A 100-mg PO QD dose was chosen for further clinical evaluation given the observed QT signal at higher glasdegib dose levels, clinical evidence of consistent down-regulation of the Hh pathway at glasdegib ≥100 mg QD, clinical efficacy signals, and the safety and tolerability profile. A further consideration in choosing this dose was to provide an additional exposure margin for possible drug–drug interactions, and the potential to increase glasdegib exposure [Citation8]. Based on the observed pre-clinical and clinical evidence, it was important to elucidate the effect of glasdegib on the QTc interval at both the therapeutic and supratherapeutic exposures. Therefore, the goal of this analysis was to characterize the E-R relationship between QTc and glasdegib plasma concentration in patients with advanced cancer.
In this analysis, a more stringent criterion than the one recommended in revision 3 of the E14 guidance [Citation2] and the White Paper [Citation4] was implemented, evaluating the upper bound of the 95% confidence interval (CI) and using the geometric mean of the observed glasdegib concentration values at the time the maximum concentration is observed. The other recommendations regarding the need for a wide range of doses to be evaluated (5–640 mg QD) with exposures well above the expected exposures at the clinical dose (100 mg QD) were fully satisfied.
2. Patients and methods
The data used for this analysis were collected from two dose-finding studies conducted in patients with cancer: Study B1371001(Clinicaltrials.gov ID: NCT00953758, 31 January 2011) and Study B1371002 (Clinicaltrials.gov ID: NCT01286467, 6 August 2009). Both studies were conducted in accordance with the principles of the Declaration of Helsinki and the International Council for Harmonisation Guidelines for Good Clinical Practice. Each study was approved by the institutional review board of each study center (for details see Supplemental Table S1). Written informed consent was obtained from all individual patients included in each study. All mandatory laboratory health and safety procedures were complied with in the course of conducting any experimental work reported.
2.1. Clinical trial designs
Study B1371001 was a phase 1, open-label, multicenter, first-in-patient, dose-finding study. Forty-seven adult patients with a variety of advanced hematologic malignancies were treated with glasdegib over a wide dose range (5, 10, 20, 40, 80, 120, 180, 270, 400, and 600 mg QD). The beginning of Cycle 1 was preceded by a single lead-in glasdegib dose for the purpose of characterizing pharmacokinetic (PK) characteristics after a single dose. From Cycle 1/Day 1 onward, the drug was administered once a day, without interruption, in 28-day cycles. The primary objective of the study was to determine an MTD and a recommended phase 2 dose (RP2D). Secondary objectives included characterizing the potential glasdegib effect on the QTc interval. Triplicate electrocardiogram (ECG) readings paired with a PK plasma sample collection occurred at pre-specified times. PK-ECG pairs were collected pre dose, and at 1, 4, and 24 hours post dose during the single-dose lead-in phase of the trial. Additional PK-ECG pairs were collected at Cycle 1/Day 1, at pre dose, and 1 hour post dose; Cycle 1/Day 8 at 1 hour post dose; Cycle 1/Day 15 at 1 hour post dose; Cycle 1/Day 21 at pre dose, and at 1, 2, 4, and 24 hours following glasdegib dosing; and at every subsequent cycle on Day 1 at 1 hour post dose [Citation8].
Study B1371002 was an open-label, multicenter, phase 1 study of glasdegib administered orally to 23 adult patients with solid tumor malignancies. Four dose levels were evaluated in this study (80, 160, 320, and 640 mg QD). One treatment cycle was defined as 28 days. In Cycle 1 only, patients received glasdegib for 25 days followed by 3 days without treatment to characterize the glasdegib plasma elimination after steady-state dosing. In Cycle 2 and beyond, glasdegib was administered continuously once a day. Triplicate ECGs were scheduled for Days 1, 15, and 25 of Cycle 1; and Day 1 of each cycle thereafter. Triplicate ECG readings paired with a PK sample were collected at pre dose, and 2 hours post dose on Day 1 of each cycle, and on Cycle 1/Day 15. On Cycle 1/Day 25 PK-ECG pairs were collected at pre dose, and at 2, 6, and 24 hours following glasdegib dosing [Citation9].
For both studies, patients with QT interval corrected for heart rate using Fridericia’s formula (QTcF) >470 msec at screening were deemed ineligible. If, during the study, a patient experienced a QTcF measurement >480 msec, immediate correction for reversible causes (including electrolyte abnormalities, hypoxia, and concomitant medications with potential to prolong the QTc) was performed.
2.2. ECG collections and assessments
Triplicate 12-lead (with a 10-second rhythm strip) measurements in the supine position were collected for scheduled ECGs. The ECG measurements were collected using an automatic ECG machine. At each scheduled timepoint, three consecutive ECGs were collected approximately 2 minutes but no longer than 5 minutes apart, to determine the mean QTc interval. When PK samples were collected around the time of ECG assessment, study centers were instructed to make all efforts to perform the ECG before each PK sample drawing such that the PK sample was collected at the nominal time. The standard measurements from each ECG collection (i.e. RR, QT, QRS, PR, and heart rate) were reported on the case report form. For modeling purposes, ECG measurements after the first dose were considered acceptable for inclusion if they were collected within 15 minutes prior to or after the PK collection. Baseline measurements must have been collected prior to the first dose.
A potential glasdegib-induced change in heart rate was evaluated prior to correction of the QT interval. The instantaneous heart rate can be calculated from RR or the time between any two QRS complexes. The drawback of this method is that the calculated heart rate can be different from the measured pulse even in a healthy person due to variations in the heart rate associated with respiration (the sinus arrhythmia). From the RR interval (msec) one can derive heart rate in beats per minute as 60*1000/RR.
The determination of the appropriate correction factor is necessary to account for the dependence between the QT and RR intervals. In order to determine the best correction factor for the analysis, a linear mixed-effects model was developed to evaluate the relationship between heart rate and exposure. The linear relationship for time between successive R-wave peaks in the ECG (RR) and glasdegib plasma concentration was evaluated as:
where the subscripts i and j represent the ith individual at the timepoint j. RRij was the average of the triplicate values with each glasdegib concentration pair. INTi was the estimated baseline RR value (i.e. glasdegib plasma concentration = 0), and CONCij was the observed glasdegib plasma concentration around the time of the ECG collection (±15 minutes). SLOPEi quantified the relationship between RRij and CONCij. ηi and εij represented the interindividual and residual variability of the model with a mean of zero and a variance of omega (N[0,ω2]) and sigma (N[0,σ2]), respectively. The effect of glasdegib on RR was determined by the slope of the relationship between RR and CONC. If the calculated SLOPE was considered statistically significant (the 95% CI of the estimated parameter does not contain zero), then glasdegib would be considered to be affecting RR and a fixed correction factor to remove the underlying effect of heart rate on the QT interval may not be appropriate.
When there is no relationship between heart rate and exposure, the standard heart rate correction formula can be used. The calculation requires an appropriate value for the correction factor (
) that removes the correlation between heart rate and QT. Bazett’s correction of the QT interval for heart rate (QTcB; β = 1/2) and QTcF (β = 1/3) fixed correction factors were selected because of their common and widely accepted use, as well as a population-specific correction of the QT interval for heart rate (QTcS). Further, it is generally acknowledged that the QT–heart rate relationship differs among people and therefore, all fixed formulas are inaccurate to some extent [Citation13].
By applying the natural logarithm to both sides of the correction formula, a linear mixed-effects model can be used to estimate the population-specific correction factor:
where ln(QTi) is the dependent variable, ln(QTc) is a population intercept, and ln(RRi) is the independent variable. The estimated coefficient for ln(RRi) is the QTcS correction factor (). ηi and εij represent the interindividual and residual variability of the model assumed to follow a normal distribution with a mean of zero and a variance of omega (N[0,ω2]) and sigma (N[0,σ2]), respectively.
To evaluate the appropriateness of the fixed and estimated correction factors, the estimated QTc values (QTcB, QTcF, and QTcS) were regressed against the corresponding RR measurements using a linear mixed-effects model with a random intercept. A correction factor is considered to have adequately corrected for the dependence between QT and RR if there is no correlation between QTc and RR (i.e. the slope coefficient is not statistically significant [p < 0.05]).
2.3. Exposure–response modeling
To determine if a linear mixed-effects model would be appropriate for modeling the relationship between glasdegib exposure and QTc, exploratory plots of the relationship between concentration and QTc were evaluated. These plots were used to assess whether the relationship was linear or whether hysteresis was observed, which would represent a non-linear relationship. Given that the plots presented a linear relationship between QTc and glasdegib concentration, a linear mixed-effects model was determined to be appropriate. A base model with an intercept () and a concentration slope (
) along with random effects on both parameters was estimated. The general form of the model is shown below:
where standard deviation of the residual error was ‘thetarized’ such that is a scalar and
~ N(0,1).
was then estimated by the model. The random intercept effect was parameterized such that
~ N(0,
). A random effect on the concentration slope was not included because the shrinkage was very large (>20%).
A stepwise covariate procedure was utilized that included a forward selection step followed by a backward elimination step, using pre-specified significance thresholds of and
, respectively. Age, sex, and study (hematologic versus solid tumors) were evaluated in the covariate analysis. The protocol allowed for correction of electrolyte imbalances and prohibited the use of concomitant medications, such as cytochrome P450 3A4 (CYP3A4) inhibitors/inducers, that could impact the exposure of glasdegib. Hence, these variables could not be tested as covariates. Given the oncology patient population that requires polypharmacy, there could be a possibility that patients would be using concomitant medications with the potential for QTc prolongation. It was understood that any potential impact/unexplained effect would be captured as part of the glasdegib exposure–QTc estimate resulting in a larger estimated QTc prolongation for a given exposure. Standard model diagnostic plots for residuals, predictions, post-hoc estimates, and covariates, along with visual predictive checks, were evaluated for evidence of lack of model fit.
A parametric bootstrap using the final model and the geometric mean maximum observed plasma concentration (Cmax) was used to estimate the 95% CI for the mean QTc prolongation at the therapeutic exposure (100 mg QD) and two supratherapeutic exposures: a 40% increase (1.4-fold) in the geometric mean Cmax from the 100-mg QD dose (in the presence of a strong CYP3A4 inhibitor) [Citation14] and the geometric mean Cmax from a 200-mg QD dose, reflecting a 2-fold increase. The geometric mean Cmax values were 1137 ng/mL, 1592 ng/mL, and 2445 ng/mL, respectively [Citation15].
2.4. Model sensitivity and robustness
The study protocols allowed a 15-minute window for PK and ECG assessments to be considered matched. Given that the plasma half-life of glasdegib is approximately 17 hours, a lag of 15 minutes between PK and ECG assessments would not be considered impactful in the analysis. The consideration for evaluable PK-ECG pairs, using the ±15-minute window, resulted in the exclusion of some of the available data. To evaluate the sensitivity to the inclusion criterion, an additional analysis was performed using all the available data. The same procedures were used to develop the model. This approach evaluated the influence of using the within-15-minute criterion. The analysis was performed for both QTcS and QTcF.
3. Results
3.1. Patient characteristics
A total of 70 patients were enrolled in these two studies and included in the analysis. Summary statistics of the demographics and baseline characteristics of the patients in the analysis are provided in . Data are available for 1027 PK-ECG pairs, of which 747 pairs were collected within a ±15-minute window and included in the analysis. A summary of the ECG measurements broken down by dose is provided in and Supplemental Table S2.
Table 1. Baseline patient demographics
Table 2. Summary of ECG measurements
3.2. Correction factor determination
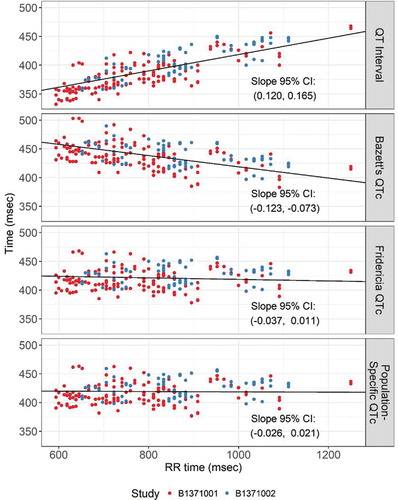
A linear mixed-effects model of the relationship between glasdegib concentration and the RR interval did not identify a statistically significant relationship (the 95% CI for the slope estimate included 0). The relationship between glasdegib concentration and RR is presented in ). The relationships between glasdegib concentration and QT, QTcB, QTcF, and QTcS are presented in . The 95% CI for the slope is presented in each plot. Both QTcF () and QTcS (estimated to be
) sufficiently removed the correlation between glasdegib concentration and QTc. Because both QTcF and QTcS were adequate, models were developed for both measurements.
Figure 1. Relationship between glasdegib plasma concentration and (a) RR, (b) QTcF, and (c) QTcS intervals
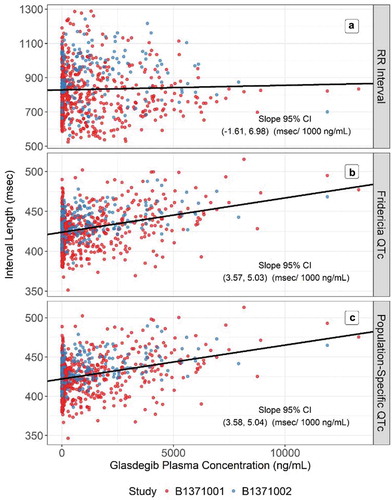
Figure 2. Assessment of the correction factors for QT interval: QTcB, QTcF, and QTcS
3.3. E-R modeling of QTcF
The relationship between glasdegib concentration and QTcF and QTcS is presented in ,). The plots represent a linear relationship as a function of concentration, with no evidence of hysteresis; therefore, a linear mixed-effects model was developed to characterize this relationship. The base models only included a random effect on the intercept because the shrinkage on the slope parameter was high when the additional random effect was included. The stepwise covariate analysis did not identify any covariates that met the conditions for inclusion in the model. Evaluation of residual plots and visual predictive checks did not identify any concerns with the final model fit. The final model estimates are presented in .
Table 3. Final E-R models for QTcF and QTcS
3.4. Model-predicted effect on QTc interval
A parametric bootstrap was performed using the final models to evaluate the mean QTc change from baseline at therapeutic and supratherapeutic exposures. Since the doses evaluated in these studies generated concentrations that encompassed the observed concentrations at the 100-mg QD and 200-mg QD doses, reliable model-based predictions of the mean change in QTc could be made at the therapeutic and supratherapeutic exposures. These estimates used the geometric mean of the observed steady-state Cmax across patients receiving 100 mg QD and 200 mg QD from a phase 2 study (NCT01546038) in patients with hematologic malignancies. Estimates and 95% CIs for the mean QTc change at each of the exposures are presented in . Although a 90% CI is more commonly presented, a 95% CI was utilized as it might potentially allow a more conservative approach. At the steady-state exposures expected with the 100-mg QD dose, the predicted mean QTcF change (upper bound of 95% CI) from baseline at the glasdegib therapeutic Cmax was 5.30 (6.24) msec. At supratherapeutic concentrations of glasdegib (a 40% increase and a 100% increase over the therapeutic Cmax, respectively), the change from baseline was 7.42 (8.74) msec and 12.09 (14.25) msec, respectively.
Table 4. Median and 95% CI for the mean change in QTc at therapeutic and supratherapeutic exposures
3.5. Model sensitivity
To evaluate the model sensitivity, the analysis was repeated using all of the data available, i.e. including PK-ECG pairs collected out of a ±15-minute window that indicated data with more noise. The results were similar at each stage of the modeling (data not shown). There was no relationship between glasdegib concentration and RR. There was a similar relationship between glasdegib concentration and both QTcF and QTcS. For both corrections the final model, after the covariate search, did not include any additional covariates. The estimation of the mean effect at each of the exposures of interest was similar.
4. Discussion
As part of the glasdegib clinical development program, a first-in-patient study, B1371001, was conducted in patients with cancer with select hematologic malignancies; additionally, a second phase 1 study (B1371002) was conducted in patients with advanced solid tumors. Glasdegib monotherapy was administered once daily at doses ranging from 5 mg to 640 mg. In these initial studies there was evidence of an increase of the QT interval in a dose-dependent manner. The QTc prolongation observed at the higher dose levels was one of the factors contributing to the selection of 100 mg QD for further clinical development. Due to the relationship between delays in cardiac repolarization and ventricular arrythmias, such as TdP, it was important to demonstrate the safety margin at the selected clinical dose, and at a higher dose that could be expected in potential situations such as drug–drug interactions or organ impairment scenarios. The potential for glasdegib exposure to affect the QTc interval was well characterized in this PK/pharmacodynamics analysis and played a key role in supporting early decision-making and the safe selection of the clinical dose.
Given that glasdegib was intended for evaluation in an AML population, this was an important consideration. Glasdegib is metabolized by CYP3A4 [Citation10,Citation14,Citation16]. Many patients with AML require the use of anti-fungal azoles, either prophylactically or as treatment for infections brought on by a compromised immune system, and this is a clinical need. All azoles inhibit CYP3A4 and it was identified that inhibition of CYP3A4 would increase glasdegib exposures [Citation16]. Therefore, the selection of the clinical dose of 100 mg QD not only accounted for the impact of glasdegib at the clinical dose itself, but also took into account the scenario of a potential increase in glasdegib exposure in patients with AML who may be taking azoles as concomitant medications. Additionally, the supratherapeutic dose/exposure used was selected to ensure that it was well above the increase in glasdegib Cmax associated with CYP3A4 inhibition based on a separate clinical drug–drug interaction study that used ketoconazole as the strong CYP3A4 inhibitor [Citation16]. The ability to use the patient data from monotherapy studies in the PK-QT analysis played a critical role, in conjunction with safety/tolerability, translational markers, and signs of clinical efficacy, in selection of the clinical dose.
While the ICH E14 guidance identifies the upper bound of the 90% CI of 10 msec as the threshold of clinical concern in general, in oncology the threshold of clinical concern is typically accepted to be 20 msec due to the life-threatening nature of the disease [Citation17]. Regulatory authorities generally require an evaluation of at least double the maximum expected therapeutic concentrations due to typical variability in exposure across patients and to account for elevations in drug exposures due to intrinsic (e.g. organ impairment) or extrinsic (e.g. drug–drug interaction) causes. The broad range of doses evaluated in the dose-ranging studies meant that the model was very well informed, with the maximum dose studied being more than 6-fold higher than the clinical dose (100 mg QD versus 640 mg QD). Model-based predictions of the expected QTc change at supratherapeutic exposures associated with a 200-mg QD dose resulted in the upper bound of a 2-sided 95% CI (a more conservative approach than the recommended 1-sided 90% CI) below the 20-msec threshold. Therefore, glasdegib was not predicted to have a large effect on the QTc interval either at the therapeutic or supratherapeutic exposure levels, indicating that the effect of glasdegib on the QTc interval did not cross the threshold of clinical concern for an oncology drug.
Although E-R modeling approaches to characterizing a relationship between PK and QTc are typically limited by not having control arms (neither active nor placebo), the benefits of population modeling are nonetheless important and have been identified as being so, especially in early phases of clinical development. The third revisions to the ICH E14 guidance do acknowledge the importance of alternative strategies for characterizing a concentration–QT relationship, such as PK-QTc modeling [Citation3]. In the FDA’s question and answer guidance for industry [Citation2], four important considerations are presented, all of which were satisfied in this E-R analysis. Studies B1371001 (first-in-human) and B1371002 were multiple ascending dose studies, which included repeat dosing with exposures obtained well above the expected exposures at the therapeutic dose of 100-mg QD. High-quality triplicate ECG measurements were collected and scheduled to be collected within 15 minutes of the paired PK sample. With data pooled, the covariate search tested for differences across studies and no statistically significant differences were found (based on the pre-specified backwards elimination significant criteria of 0.001). Since the highest tested doses were more than 6-fold higher than the clinical dose, the exposures obtained and included in the model were several folds higher than the clinically relevant exposures – the E14 guidance (section II.B.2 [2.2.2]) states that a positive control is not necessary in such a scenario. Several of the observed PK concentrations included in the model were higher than 10,000 ng/mL – the geometric mean of the steady-state Cmax with a 100-mg QD dose (the clinical dose) was 1137 ng/mL.
Of the many considerations discussed in the E14 guidance, a wide range of doses and exposures well above the concentrations expected with the clinical dose is very important for concentration–QTc models to be able to robustly characterize the relationship. For drugs in which the selected clinical dose is at or near the upper range of evaluated doses, a model may not be able to fully characterize the proarrythmic effects, particularly at supratherapeutic exposures. Oncology provides a unique development environment since it is common for only one dose level to be studied in later phases of clinical development, typically with no additional dose-finding studies conducted, once a clinical/RP2D dose has been selected. Most often, the first-in-human/dose-escalation study may be the only study by which the selection of the clinical dose is justified. Additionally, it is noted that it may not be feasible to dose many oncology compounds in healthy individuals to perform a formal ICH E14–compliant TQT study. Consequently, modeling and simulation are sometimes the only way to evaluate certain clinical concerns, especially in the early clinical development space. Models developed using data from patients, rather than healthy volunteers, have the added benefit of evaluating the effect in either a more relevant or in the actual target indication population.
A formal TQT study was also conducted in the later stages of the clinical development of glasdegib, with the results from the formal study confirming the conclusions reached from the PK-QT modeling [Citation18–20]. The estimated slope of the effect in the TQT study was 0.005 and 0.004 msec/ng/mL, with the 90% CI for the expected prolongation 11.95–15.49 msec and 10.14–13.64 msec for the QTcF and QTcS measurements, respectively, at the expected supratherapeutic Cmax of 2445 ng/mL. In this PK-QT analysis, the estimated slopes were 0.00430 and 0.00431 msec/ng/mL, with the 95% CI for the expected prolongation 10.03–14.25 msec and 9.85–14.26 msec for the QTcF and QTcS measurements, respectively, at the expected supratherapeutic Cmax of 2445 ng/mL. The estimated slopes and the total estimated prolongation at the supratherapeutic exposure was very similar for the baseline- and placebo-controlled TQT study and the PK-QT analysis. The estimates for the slope (exposure–QTc effect) from this analysis were contained within the CIs from the TQT study, and the upper bounds of the CIs for the total effect were very similar for both QTcF and QTcS, confirming the results from this PK-QT analysis.
This PK-QT analysis provides a good example of how modeling, using high-quality data, was able to provide reliable and accurate answers to urgent clinical questions. In this case, both the modeling and the TQT study supported the 100-mg QD dose of glasdegib as a safe clinical dose for patients.
5. Conclusions
In conclusion, the effect of glasdegib exposure on QTc changes from baseline was well characterized using a linear mixed-effects E-R population model, with data pooled from phase 1 dose-escalation studies in patients with cancer. It was demonstrated that a large effect of glasdegib on the QTc interval was not predicted either at the therapeutic or supratherapeutic exposure levels, indicating that the effect of glasdegib on the QTc interval did not cross the threshold of clinical concern for an oncology drug.
Declaration of interest
LK Fostvedt and N Shaik are employees of and own stock in Pfizer. A Ruiz-Garcia was an employee of Pfizer when the study was carried out. G Martinelli has served as a consultant for Amgen, Ariad, Incyte, Pfizer, Celgene, Janssen, Jazz, Daiichi Sankyo, and AbbVie; participated in speakers’ bureaus for Pfizer, Celgene, and Novartis; and received research funding from Pfizer and AbbVie. AJ Wagner has served as a consultant to Eli Lilly, Five Prime Therapeutics, NanoCarrier, and Daiichi Sankyo; and has received research funding to his institution from Pfizer, Novartis, Eli Lilly, Five Prime Therapeutics, Daiichi Sankyo, Plexxikon, Karyopharm, Aadi, Merck, and Sanofi. The authors have no other relevant affiliations or financial involvement with any organization or entity with a financial interest in or financial conflict with the subject matter or materials discussed in the manuscript apart from those disclosed.
Reviewer disclosures
One reviewer has declared receiving advisory board and speaker bureau honoraria from Pfizer. Another reviewer has declared advisory for Oncopeptides. Peer reviewers on this manuscript have no other relevant financial relationships or otherwise to disclose.
Authors’ contributions
All authors had full access to all study data. All authors made important contributions to data acquisition, analysis, and/or interpretation of data. The manuscript was developed by LKF and NS. All authors reviewed manuscript drafts and have reviewed and approved the final version for submission.
Supplemental Material
Download MS Word (17.4 KB)Acknowledgments
Editorial support (manuscript formatting, preparation for submission) was provided by Shuang Li, PhD, of Engage Scientific Solutions, and was funded by Pfizer.
Supplementary material
Supplemental data for this article can be accessed here.
Additional information
Funding
References
- International Conference on Harmonisation. ICH harmonised tripartite guideline E14: the clinical evaluation of QT/QTc interval prolongation and proarrhythmic potential for nonantiarrhythmic drugs [Internet]. 2005 [cited 2020 Jun 30]. Available from: https://database.ich.org/sites/default/files/E14_Guideline.pdf
- US Food and Drug Administration. E14 clinical evaluation of QT/QTc interval prolongation and proarrhythmic potential for non-antiarrhythmic drugs — questions and answers (R3). Guidance for industry [Internet]. 2017 [cited 2020 Jun 30]. Available from: https://www.fda.gov/media/71379/download
- International Conference on Harmonisation. E14 Implementation Working Group, ICH E14 guideline: the clinical evaluation of QT/QTc interval prolongation and proarrhythmic potential for non-antiarrhythmic drugs. Questions & answers (R3) [Internet]. 2015 [cited 2020 Jun 30]. Available from: https://database.ich.org/sites/default/files/E14_Q%26As_R3_Q%26As.pdf,https://database.ich.org/sites/default/files/E14_Q%26As_R3_Concept_Paper.pdf
- Garnett C, Bonate PL, Dang Q, et al. Scientific White Paper on concentration-QTc modeling. J Pharmacokinet Pharmacodyn. 2018;45(3):383–397.
- Tsamandouras N, Duvvuri S, Riley S. Impact of phase 1 study design on estimation of QT interval prolongation risk using exposure-response analysis. J Pharmacokinet Pharmacodyn. 2019;46(6):605–616.
- Pfizer Inc. Daurismo® (glasdegib) prescribing information [Internet]. 2018 [cited 2020 Jun 30]. Available from: https://www.accessdata.fda.gov/drugsatfda_docs/label/2018/210656s000lbl.pdf
- Pfizer Inc. Pharmacology/toxicology new drug application review and evaluation [Internet]. 2018 [cited 2020 Jun 30]. Available from: https://www.accessdata.fda.gov/drugsatfda_docs/nda/2018/210656Orig1s000PharmR.pdf
- Martinelli G, Oehler VG, Papayannidis C, et al. Treatment with PF-04449913, an oral smoothened antagonist, in patients with myeloid malignancies: a phase 1 safety and pharmacokinetics study. Lancet Haematol. 2015;2(8):e339–e46.
- Wagner AJ, Messersmith WA, Shaik MN, et al. A phase I study of PF-04449913, an oral hedgehog inhibitor, in patients with advanced solid tumors. Clin Cancer Res. 2015;21(5):1044–1051.
- Lam JL, Vaz A, Hee B, et al. Metabolism, excretion and pharmacokinetics of [(14)C]glasdegib (PF-04449913) in healthy volunteers following oral administration. Xenobiotica. 2017;47(12):1064–1076.
- Masters JC, LaBadie RR, Salageanu J, et al. Pharmacokinetics and safety of glasdegib in participants with moderate/severe hepatic impairment: a phase I, single-dose, matched case-control study. Clin Pharmacol Drug Dev. 2020. doi:10.1002/cpdd.897
- Shaik N, LaBadie RR, Hee B, et al. Evaluation of the impact of renal impairment on the pharmacokinetics of glasdegib in otherwise healthy volunteers. Cancer Chemother Pharmacol. 2021;87(2):241–250.
- Hnatkova K, Vicente J, Johannesen L, et al. Errors of fixed QT heart rate corrections used in the assessment of drug-induced QTc changes. Front Physiol. 2019;10:635.
- Shaik MN, Hee B, Wei H, et al. Evaluation of the effect of rifampin on the pharmacokinetics of the Smoothened inhibitor glasdegib in healthy volunteers. Br J Clin Pharmacol. 2018;84(6):1346–1353.
- Savona M, Pollyea D, Stock W, et al. Phase Ib study of glasdegib, a Hedgehog pathway inhibitor, in combination with standard chemotherapy in patients with AML or high-risk MDS. Clin Cancer Res. 2018;24(10):2294–2303.
- Shaik MN, LaBadie RR, Rudin D, et al. Evaluation of the effect of food and ketoconazole on the pharmacokinetics of the smoothened inhibitor PF-04449913 in healthy volunteers. Cancer Chemother Pharmacol. 2014;74(2):411–418.
- Sarapa N, Britto MR. Challenges of characterizing proarrhythmic risk due to QTc prolongation induced by nonadjuvant anticancer agents. Expert Opin Drug Saf. 2008;7(3):305–318.
- Masters JC, Shaik N. Population pharmacokinetic/pharmacodynamic evaluation of the effect of glasdegib on QT interval in healthy adult subjects. Poster presented at: the 9th American Conference on Pharmacometrics (ACoP) of the International Society of Pharmacometrics; 2018 Oct 7–10; San Diego, CA.
- Shaik N, Mendes Da Costa L, Hee B, et al. A thorough QT study to evaluate the effect of glasdegib on cardiac repolarization in healthy adult subjects. Poster presented at: the 9th American Conference on Pharmacometrics (ACoP) of the International Society of Pharmacometrics; 2018 Oct 7–10; San Diego, CA.
- Masters JC, Shaik N, Mendes Da Costa L, et al. Clinical and model-based evaluation of the effect of glasdegib on cardiac repolarization from a randomized thorough QT study. Clin Pharmacol Drug Dev. 2021;10(3):272–282.