
ABSTRACT
Envelopes with low thermal performance are common characteristics in European historic buildings, causing higher energy demand and insufficient thermal comfort. This paper presents the results of a study on indoor environmental quality (IEQ), with special focus on thermal comfort, in the historic City Hall of Gävle, Sweden, now used as an office building. There are two modern heat recovery ventilation systems with displacement ventilation supply devices. The district heating network heats the building via pre-heat supply air and radiators. Summer cooling comes from electric heat pump ejecting heat into the exhaust ventilation air. A building management system (BMS) controls the heating, ventilation and air-conditioning (HVAC) equipment. The methodology included on-site measurements, BMS data logging and evaluating the occupants’ perception of a summer and a winter period indoor environment using a standardized questionnaire. In conclusion, indoor environmental quality in this historic building is unsatisfactory. Stuffy air, too high, too low and varying room temperatures, lighting problems and noise are constant issues. Although it is equipped with modern ventilation systems, there are still possibilities for improving thermal comfort by improved control strategies, since upgrading the building’s envelope is not allowed according to the Swedish Building Regulations in historic buildings with heritage value.
1. Introduction
Total primary energy use has doubled during the last 40 years globally (Rohdin, Dalewski, & Moshfegh, Citation2012). In order to break down the resulting global warming mechanisms, achieving energy efficiency is an important goal. In Europe, the building sector accounts for almost 40% of total energy use (Morelli et al., Citation2012) and over 25% of buildings are historic (Moran, Blight, Natarajan, & Shea, Citation2014). This illustrates the important role of these types of buildings in reaching the mentioned aim. Achieving energy efficiency should not compromise and, if possible, should actually improve indoor environmental quality in the building sector. Accordingly, studies related to improving energy efficiency are normally accompanied by investigations of indoor environmental quality in the built environment.
1.1. Thermal comfort in office buildings
Several field studies on the concept of indoor environmental quality (IEQ) (specifically including thermal comfort) have been carried out on office buildings with different objectives, methods, and in different climates which have been assessed through some main review papers. Meir, Garb, Jiao, and Cicelsky (Citation2009) reviewed scientific articles on post-occupancy evaluation (POE) for thermal comfort investigations divided into two main categories including lateral studies (limited number of parameters/large number of case studies) and in-depth studies (all possible parameters/a single case study). Lateral studies included Roulet, Foradini, Cox, Maroni, and de Oliveira Fernandez (Citation2005) in which the indoor environmental quality was investigated in a number of office and apartment buildings, mainly using interviews and questionnaire surveys. Around 75% of the buildings had been designed to be energy efficient and 50% of them proved to be so. They proposed a series of recommendations for improving the performance of those buildings: (1) changing the layout from open to cellular offices and improving the acoustical ambiance of the occupants for resolving the noise problem; (2) improving thermal comfort using passive ways such as passive solar gains in winter, passive cooling in summer, and pre-heating or cooling air using heat recovery or underground heat exchanger; and (3) efficient daylighting and artificial lighting design. Zagreus, Huizenga, Arens, and Lehrer (Citation2004) performed the same type of investigation using both questionnaires and measurements of influential physical parameters on thermal comfort in several office buildings in the USA, Canada and Europe. In one of the field studies in the USA, per-occupancy (prior to the move to the new building, called baseline) and POE of occupant comfort in a new large office building containing underfloor air distribution (UFAD) technology were conducted. According to the responses to the questionnaires, air quality satisfaction improved significantly and light satisfaction was significantly lower in the new building compared to the baseline. Survey comments indicated that the low light satisfaction was mainly related to inadequate illumination from task lighting. Morhayim and Meir (Citation2008) presents an in-depth study in which the Sick Building Syndrome (SBS) phenomenon was investigated using POE on a university building including offices and laboratories. The POE included questionnaires, spot measurements of influential physical parameters on thermal comfort, and also walk-through. The results depicted the main reasons for complaints about some environmental disturbing factors. It was revealed that poor indoor air quality (IAQ) was likely caused by (1) visible mould concentration on HVAC outlets and return air openings; (2) moisture-caused patches on acoustic ceilings; and (3) condensation-induced mould on aluminum window frames. Lack of adequate individual control on the central HVAC system resulted in overheated building, causing both redundant energy use and relative discomfort in most spaces. Low relative humidity (around 20%) may have led to complaints about eye, nose, throat and skin irritation, as well as headaches. Finally, high levels of odour were observed in the laboratory spaces due to malfunctioning ventilation system and wrong-positioned exhaust chimneys on the roof.
Humphreys, Fergus Nicol, and Raja (Citation2007) reviewed the main databases of field studies which are the experimental basis of the adaptive approach to thermal comfort. One of the databases was created by de Dear and Brager (Citation1998) in which the collected datasets were categorized into three main classes. In research studies in class III, questionnaire studies were accompanied by simple measurements of temperatures alone and, possibly, relative humidity at only one height level above the floor. This class included field studies such as Humphreys (Citation1976, Citation1978, Citation1981) and Auliciems (Citation1981), which resulted in the early adaptive thermal comfort models. Class II included field experiments in which all physical environmental variables required for PMV/PPD calculations were measured at one arbitrary height at the same time and area as the thermal comfort questionnaires. However, field studies in Class I, applied the same combination of questionnaire surveys and field measurements as in Class II, but introduced measuring at the recommended heights (0.1, 0.6 and 1.1 m) above floor level for the field measurements according to ASHRAE standard 55 and ISO standard 7730. Class I included studies carried out by e.g. Schiller et al. (Citation1988), de Dear and Fountain (Citation1994), and Donnini et al. (Citation1996).
Two literature reviews of thermal comfort studies done by Rupp, Vásquez, and Lamberts (Citation2015) and Wang et al. (Citation2018) include more recent scientific articles on field studies in office buildings in several climates, all applying a combination of questionnaires and measurements of indoor variables. A variety of thermal comfort field studies using both questionnaires and physical thermal comfort measurements have been carried out on office buildings located in different climates, most of which are equipped with modern HVAC systems (e.g. Choi & Moon, Citation2017; Deuble & de Dear, Citation2014; Indraganti, Ooka, & Rijal, Citation2013; Luo, Cao, Damiens, Lin, & Zhu, Citation2014). However, these office buildings do not include old historic buildings.
One of the specific research areas for thermal comfort field studies is historic buildings. Martínez-Molina, Tort-Ausina, Cho, and Vivancos (Citation2016) presented a review on energy efficiency and thermal comfort in historic buildings. These studies were categorized based on types of applications including historic buildings for residential, religious, academic and palace, museum, library and theatre uses as well as historic buildings in urban areas. Several studies related the poor indoor climate due to poor thermal resistance of the building envelope, lack of ventilation system with heat recovery, and negative effects of thermal bridges and air leakage (e.g. Alev et al., Citation2014; Buvik, Andersen, & Tangen, Citation2014). Moreover stratification and insufficient lighting and in several cases poor acoustics and poor performing heating system are common (e.g. Balocco & Calzolari, Citation2008; Li, You, Chen, & Yang, Citation2013; Varas-Muriel, Martínez-Garrido, & Fort, Citation2014).
Rohdin et al. (Citation2012) studied indoor climate during winter in a town hall in Sweden that provided space for offices as well as city archives. The studied building was reported having high complaints about too low temperature, draught and varying temperature. These problems were connected to infiltration and cold surface temperatures.
As shown, various thermal comfort field studies have been carried out on historic buildings located in different climates. However, studies including old historic buildings used as office buildings are very limited. All in all, a knowledge gap is recognized in the field of thermal comfort field studies on old historic buildings refurbished as office buildings and moreover have been equipped with modern heating, ventilation and air-conditioning (HVAC) systems. Such buildings have unique architectures mainly characterized by thicker walls than modern buildings and by higher heat losses through the building envelope, which could affect occupants’ perceived thermal comfort in a different way compared to modern buildings situated in a colder climate. Therefore, the current paper aims to primarily investigate thermal comfort, but also, to a certain extent, other environmental variables in City Hall in Gävle in Sweden using a questionnaire survey study combined with on-site measurements and BMS logged data. The aim of this case-study is to investigate if a modern HVAC system is capable of resolving all the typical thermal comfort issues in this old office historic building.
1.2. Building description
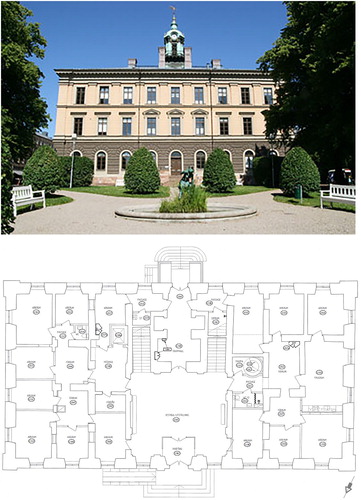
The City Hall in Gävle is a historic building built in 1784–1790; historic meaning that the building envelope is not allowed to be changed, especially the external appearance. It is currently used as an office building for municipal staff. Situated in Gävle, the annual mean temperature is 5.5°C with winter temperatures plummeting to about −22°C. The building consists of three floors with 37 offices and a basement and attic. The total usable area is around 2100 m2 and the average floor to ceiling height is 4 m. The building itself and the plan of the building’s first floor are shown in . All four façades of the building have double-glazed windows with wooden frames. The windows installed on the longer façades face northwest and southeast and the ones on the shorter façades face northeast and southwest. The building is connected to the local district heating network, which provides heat to the hydronic radiators (below the windows) in the rooms, to the domestic hot water preparation heat exchanger as well as to the heating coils in the air handling units. Supply temperature set point of the radiator circuit is calculated based on the supply temperature curve and a night set-back control strategy. The schedule for night set back is set for the whole weekend, 10:00_24:00 on Mondays, and 00:00_04:00 as well as 10:00_24:00 on other weekdays. The circulation pump in the radiators circuit is shut off during the summer period. During the winter period, the pump stops and the related heating valve is closed when the ambient temperature exceeds 15°C. The excess heat is calculated five times per day and when the exceeded outdoor temperature over the mentioned boundary value reaches the margin of + 0.5°C, the pump starts and the heating valve opens again.
Figure 1. City Hall in Gävle (upper), first floor plan (lower). The arrow points to the north.
Room thermostat controls temperature by adjusting the air flow. In each ventilation unit (totally two units), the set point of the supply air temperature to the related rooms is calculated based on the mean of room temperatures of the zones ventilated by the unit in question. The set point is 21°C with 2°C dead band between heating and cooling, i.e. the supply air temperature in each unit is regulated between 15°C and 25°C in order to keep the related rooms’ temperatures at 21°C during winter, and cooling is supplied when the mentioned average room temperature exceeds 23°C. The circulation pump in the heating battery in each ventilation unit is in operation if two circumstances are fulfilled: The period is October_April (winter period) or as long as the ambient temperature is lower than 10°C and when the heating valve in the heating battery opens. The heating valve operates according to a heating curve which defines to which extent it needs to be opened based on the ambient temperature. It is totally closed and 50% opened when the ambient temperature is 10°C and −15°C respectively. Supply and exhaust fans in each ventilation unit are in operation 06:00_18:00 during week days. At start-up of the ventilation unit, the exhaust fan starts operating first. The heat recovery heat exchanger is regulated to recover heat at the maximum capacity. After one minute, the supply fan starts operating and the outdoor air damper is opened and normal regulation is continued. At ventilation unit shut off, the outdoor air damper is closed. It is also possible to start the ventilation unit by the pushbutton timer. In such case, the ventilation unit is stopped after 120 min or by pushing the pushbutton timer again. Night cooling starts if certain circumstances happen together: (1) indoor temperature exceeds 23°C; (2) the ambient temperature is at least 2°C lower than the indoor temperature; (3) the ambient temperature is over 12°C; (4) the ventilation unit is not in ordinary operation; and (5) the time schedule of night cooling is active. The time schedule for night cooling is 01:00_05:00 during weekdays.
There are also thermostatic radiator valves (TRVs) on the radiators, with the setting 3–4 which usually corresponds to 20_23°C. Summer cooling comes from an electric heat pump that ejects heat into the exhaust ventilation air.
2. Method
Questionnaire surveys, on-site measurements as well as data logging were performed. All physical environmental variables required for calculating PMV/PPD indices were measured at all four heights (0.1, 0.6, 1.1 and 1.7 m) above the floor level according to ISO standard 7730 in a critical room located at the southeast-southwest corner on the first floor, hence categorized as Class I according to de Dear and Brager (1998).
2.1. Standardized questionnaire
In order to investigate the occupants’ perception of indoor environment in a building, an epidemiological survey using a standardized questionnaire can be used (Rohdin et al., Citation2012). There are several types of standardized questionnaires in the literature, such as the Royal Society of Health (RSH) questionnaire developed by the British Building Research Establishment, which focuses on office buildings (Rohdin et al., Citation2012), the standardized questionnaires described in ANSI/ASHRAE Standard 55 and in NS/EN 15251 (Berge & Matisen, Citation2016), and Miljö Medicinsk (MM) questionnaire (The MM Questionnaires, Citation2014). The MM questionnaire for offices (MM 040 NA Office) was applied in this study since it is well-established and often used in Nordic countries in studies focused on investigating perceptions and experiences related to indoor climate. It carries out a retrospective assessment of thermal evaluation, in contrast to the questionnaires described in ANSI/ASHRAE Standard 55 and NS/EN 1521 in which the assessment of thermal sensation is done instantaneously based on a seven-point comfort scale (Berge & Matisen, Citation2016). The aim was to investigate the occupants’ perception of indoor environment during two periods including summer 2016 and winter 2016 to spring 2017.
2.2. MM questionnaire
The first version of the MM-questionnaire for non-industrial workplaces was released in 1989 by the Department of Occupational and Environmental Medicine at Örebro University Hospital in Sweden (Andersson et al. Citation1993) after three years of being intensely tested regarding its validity, reliability and its practical application (Andersson Citation1998. Several versions exist for different environments such as schools, day care centres, offices, hospitals and residential buildings (Andersson Citation1998). The MM-questionnaire for offices (MM 040 NA Office) includes a total of ten categories of questions about:
Background factors such as the location of the workplace, the position of the staff, working hours, etc.
Disturbing factors in the work environment such as draught, too high room temperature, etc.
Work conditions such as work load, support from fellow-workers, etc.
Present symptoms in the work environment such as fatigue, headache, etc.
Physical and psychological work environment such as being on sick-leave, etc.
Temperature conditions such as too cold in winter, too warm in summer, etc.
Cleaning situation in the work environment
Noise in the work environment such as disturbing noise from ventilation, noise from outside, etc.
Air quality like problems such as odours, problems in different periods of the day, etc.
Other background factors such as date of birth, gender, education level, etc.
The questionnaire in this study only included multiple-choice questions about disturbing factors and symptoms present in the work environment followed by an open question where respondents were asked if they had experienced any other symptoms and/or environmental factors linked to indoor environment. The questions about the background of the respondent (the categories No. 1 & 10) were not included to ensure the anonymity of the respondents and also because they did not provide useful information for analysis of IEQ in the scope of this study. Additionally, a plan of the building was appended to the questionnaire in which the building was divided into four main zones for all floors and two more questions were added asking the respondents on which floor and in which zone their offices are located. Such division provided the opportunity to analyse the responses considering the different influences of solar radiation on indoor environment in various zones according to their orientation and height from the ground surface. This plan is shown in .
Figure 2. Building plan divided into four zones per floor. The arrow points to the north.
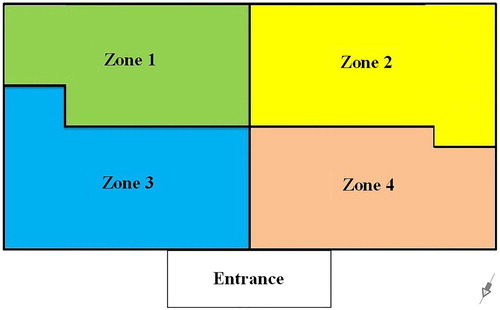
Each zone contained several offices (at least three persons worked in each zone) and, in this way, the anonymity of the respondents was assured. The multiple choice answer alternatives included ‘yes, often’, ‘yes, sometimes’ and ‘no, never’. Web-based questionnaire was sent to staff twice via email: in the middle of September 2016 and February 2017. The respondents had three weeks to answer the questions online and two reminder emails were sent. A total of 23 and 36 responses were collected for summer and winter cases which led to response rates of 76% and 65% respectively. The majority of employees worked at single or two-person offices, while a few had their workplaces located in open-space offices. To analyse the responses, these were compared with two reference materials of the MM-questionnaire. Reference 1 is representative of well-functioning and healthy buildings, i.e. the buildings without known indoor climate problems. The reference data was created in 1989 based on the results of a study of seven offices and two schools which were considered healthy. Reference 2 represents typical Swedish office buildings created from 91 office buildings dispersed all over Sweden, in some cases with indoor climate problems (The MM Questionnaires Manual Work Environment, Citation2014).
2.3. Data logging on the building management system (BMS)
Room air temperatures in different offices were logged on the building management system during summer (August 2016) at ten-minute time intervals. The BMS temperature sensors in offices are attached to the wall 1.7 m above the floor.
2.4. On-site measurements
According to literature, there are two different approaches regarding studies on thermal comfort: climate-chamber and field-study approaches, which have led to steady-state models and standards (like ASHRAE 55-1992 and ISO7730) and adaptive thermal comfort models and standards (like ASHRAE 55-2010 and EN15251), respectively. In the former, the personal parameters (metabolic rate and clothing insulation) are determined by the task and assumed to be constant and the environmental parameters are measured. In the latter, thermal comfort is studied in the real world while subjects continue their daily routine in the place. In most cases, clothing insulation and metabolic rate are recorded. Cultural and psychological parameters could also affect the studies (Taleghani, Tenpierik, Kurvers, & Dobbelsteen, Citation2013). The steady-state model based on standard ISO 7730 (ISO, 7730, Citation2005) was used to perform thermal comfort measurements in this study. This standard was developed for evaluation of moderate thermal environment and Swedish national standards organizations are bound to implement it. Thermal comfort measurements were done using the thermal comfort data logger in one of the office rooms. The equipment consisted of four transducers for measuring operative temperature, air humidity, air velocity, and air temperature, which were attached to a vertical rod at the same height. It was possible to adjust their height through the length of the rod. A logger time stamped and saved the transducers measured values and calculated the thermal comfort indices. According to ISO 7730, metabolic rate was set at 1.2 met corresponding to sedentary activity in the office and clothing insulation was determined as 0.5 clo during summer and as 1.0 clo during winter (1 met = 58.2 W/m2 and 1 clo = 0.155 m2.K/W). The technical specifications of the thermal comfort data logger as well as the transducers are presented in .
Table 1. Technical specifications of thermal comfort data logger – 1221.
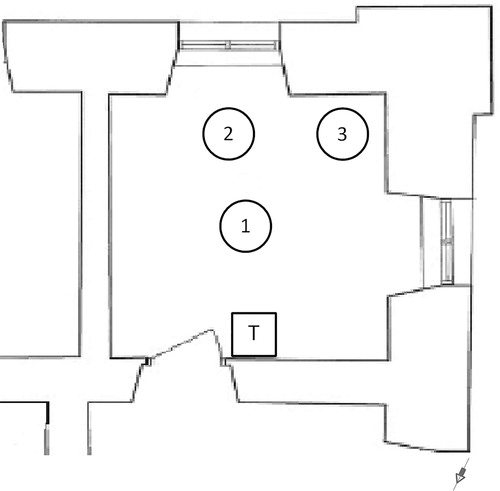
During winter, two sets of measurements were carried out. Short-term measurements with negligible contribution of direct solar radiation were done on 22 February 2017 on a cloudy day in three different locations in the room (in the middle of the room, in front of the window, at the corner of the room) at four heights (0.1 m, 0.6 m, 1.1 m, 1.7 m) and at one-second time intervals over 10 min. The different heights correspond to ankle level (0.1 m), the middle of the body while seated (0.6 m), neck level while seated as well as the middle of the body while standing (1.1 m) and neck level while standing (1.7 m). shows the three locations of measurements in the mentioned room. For locations 2 and 3, according to ISO 7730, measurements were performed 0.6 m away from wall surfaces. Long-term measurements were continuously carried out only at the corner of the room and at the height of 1.1 m at 15-minute time intervals for one week from 22 February to 1 March 2017.
Figure 3. Measurement locations in the representative room. The arrow points to the north.
Note: T represents the room thermostat.
During summer, measurements were performed in the same locations and heights in the same office room on a sunny day on 11 August 2017 at one-second time intervals over 5 min. Due to time shortage, the measurements in the middle of the room were performed on another sunny day on 14 August. To capture the difference between the operative temperature in front of the window with no internal shading (location 2 in ) and in front of the room thermostat (T in ), measurements in these two locations in that room were carried out on a sunny day on 24 May 2017. The same measurements were also done in another office room with internal shading on 11 August 2017. Finally, to investigate the difference in operative temperatures in front of the window with no internal shading (location 2 in ) in the mentioned room in two cases of sunny and cloudy weather, measurements were done in this location on a partly cloudy day on 6 June 2017.
Thermal comfort indices were calculated by thermal comfort data logger using the equations which are available in the ISO 7730 standard. Predicted Mean Vote (PMV) and Predicted Percentage Dissatisfied (PPD) were calculated for the heights of 0.6 and 1.1 m to illustrate thermal state of the body as a whole for a seated and a standing person respectively (ANSI/ASHRAE Standard 55, Citation2013).
3. Results and discussion
Based on the replies to the MM-questionnaire, the prevailing environmental disturbing factors and symptoms caused by inappropriate indoor environment in the offices compared to references 1 and 2 during summer and winter are presented in and . The dissatisfaction percentages were calculated based on the number of ‘yes, often’ responses.
Figure 4. Environmental disturbing factors during summer (upper) and winter (lower)
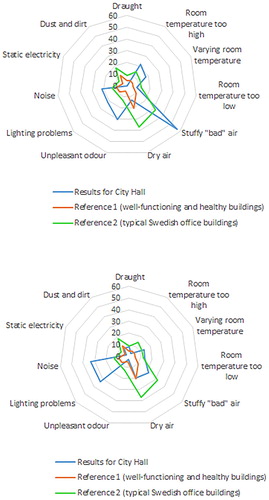
Figure 5. Symptoms caused by inappropriate indoor environment during summer (upper) and winter (lower).
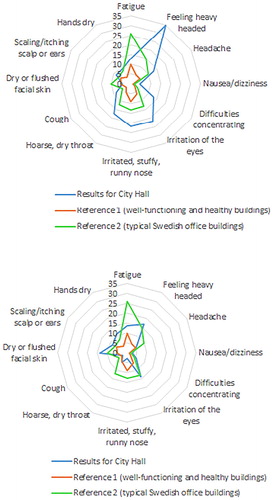
Analysis showed that complaints about stuffy ‘bad’ air, unpleasant odour and too high room temperature were reported extremely more frequently compared to reference 1 during summer. Complaints about lighting problems, noise, varying room temperature (variation over time) and too low room temperature were also respectively higher than data from reference 1. During winter, the highest percentage of complaints was about lighting problems and noise. Dissatisfaction with stuffy ‘bad’ air, varying room temperature, too low room temperature and draught were also respectively higher than data from reference 1. Regarding the present symptoms, feeling heavy headed and irritation of the eyes during summer and feeling heavy headed during winter accounted for the highest dissatisfaction percentage. Except for dry or flushed facial skin during summer and irritated, stuffy, runny nose and cough during winter, complaints about all other symptoms were higher than data from reference 1 for both periods. In comparison with typical Swedish office buildings (reference 2), the situation was similar to when comparing to reference 1 with only some differences. Percentage of complaints about too low room temperature and fatigue during summer and about draught, stuffy ‘bad’ air, fatigue, headache and dry throat during winter were acceptable by reference 2.
Complaints about unpleasant odour decreased drastically in winter to an acceptable level based on reference 1. The main reason could be water leakage in the basement during summer which was resolved before winter. One staff member also mentioned this problem in their response. Dissatisfaction with symptoms like irritated eyes, irritated/stuffy/runny nose, dry throat and cough (which are typical in winter) was surprisingly higher in summer. One reason could be that the respondents were informed about the mould problem caused by water leakage in the basement while the questionnaire related to summer period was available online and this might have affected their replies. Regarding the reasons for some symptoms, one respondent blamed the unpleasant odour and stuffy air as the cause of stuffy nose and headache during summer. Some others mentioned noise as the cause of fatigue and heavy- headed feeling and lighting problems as the reason for concentration difficulties and fatigue during winter.
In January 2017, more employees moved from another building with fairly calm surroundings to City Hall, which is affected by more noise caused by traffic. This could be one reason why complaints about noise were higher during winter. Some respondents also connected the noise problem to the fact that more than one employee works in one room in some offices. A cause for too high room temperature during summer could be that the cooling system was out of order. A main problem which was revealed through inspection of the building and also through a short interview with one staff member was that room thermostats did not work. One reason could be that the cooling system malfunctioned, but the dampers of the ventilation system also did not seem to work in all offices, most likely due to control strategy problems.
An analysis was also done for different offices. illustrates the results of this analysis. There was more dissatisfaction with draught during winter in offices facing northwest and with too high room temperature during summer in the ones facing southeast. This could be related to receiving more solar radiation on the southeast façade. The ranges of logged temperatures in different zones during August 2016 are shown in . It is shown that zones 1 and 2 experience higher room temperatures than zones 3 and 4. This confirms the results of the analysis done for various zones based on questionnaire responses.
Figure 6. Comparison between offices with different façades based on questionnaire responses.
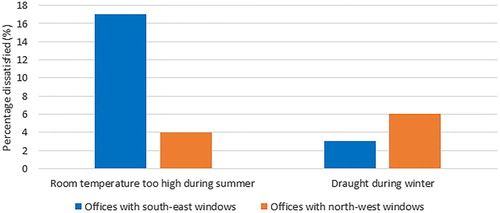
Figure 7. Ranges of logged air temperatures in different zones on BMS during August 2016.
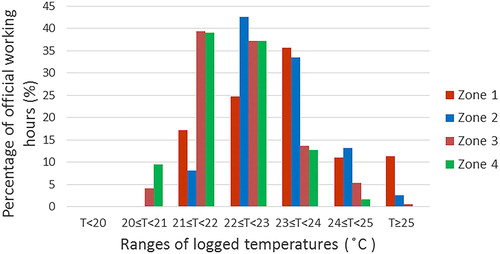
According to , air temperatures logged on BMS could reach over 25°C during some periods in some zones while it was often between 22 and 23°C in zones 1 and 2 and between 21 and 22°C in zones 3 and 4. In addition, according to thermal comfort measurement results (on-site measurements) in sunny weather in the mentioned room, operative temperature in front of the window with no internal shading was 1.3°C higher than in front of the room thermostat, while in another office with internal shading (roll screens) in sunny weather, there was almost no difference in operative temperature between these two locations. Therefore, on-site measurement results and BMS logged data do not clearly illustrate the disturbing factor of ‘Too high room temperature’. Considering that northeast windows do not have internal shading in four offices in the building, one could only argue that either office air temperatures higher than the prevailing ones in the zones (according to ) could be perceived as too high by some employees or some personnel could suffer from local too high operative temperatures as a result of solar radiation.
On-site thermal comfort measurements during the partly cloudy day in the selected room showed that operative temperature in front of the window with no shading was 1.2°C higher during sunny compared to cloudy weather. This could be a reason for complaints about varying room temperature.
BMS-Logged air temperatures of some selected rooms on 1 August 2016 between 06:00_18:00 are presented in (a–f). These are the rooms with southeast, southwest and northeast windows which tend to receive more solar radiation during summer in comparison with other rooms, leading to higher room air temperatures. The selected rooms experienced higher air temperatures on the first day of August compared to other days of the month, which is why logged data for this date are presented. The time period 06:00_18:00 was selected based on the ventilation units’ schedules according to operation description documents.
Figure 8. Logged air temperatures of selected rooms on BMS on 1 August 2016 in (a) and (b) 1st floor, (c) and (d) 2nd floor, (e) and (f) 3rd floor. ** Data is not logged on the building management system (BMS) for the room with both southeast and northeast windows in the right half of the building on the second floor (8 c).
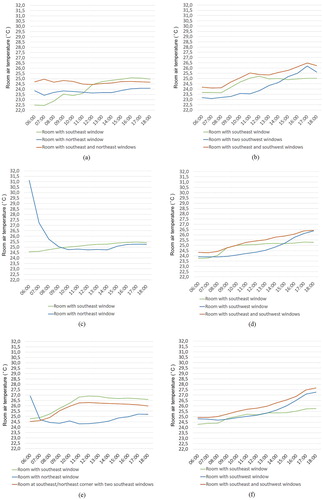
As shown in (a–f), the rooms located on the left half of the building at the southeast-southwest corners tend to have higher air temperatures in the afternoons and close to end of working hours compared to other rooms with northwest windows, due to more solar gain through southwest windows. On the third (last) floor (probably due to less shading effect from surrounding buildings as well as the impact of stratified air temperature in the building), the air temperature in the southeast-southwest corner room goes up to nearly 28°C at the end of the day. It could also be another argument for complaints about too high and varying room temperatures during summer.
According to (a), (c) and (e), rooms with only northeast windows have relatively high room air temperatures at the beginning of the day due to early morning solar gain through the window and also the fact that there is no ventilation turned on before 06:00. These air temperatures are higher in such rooms on higher floors for the same reason as mentioned previously. The air temperature in the room with only one northeast window on the second floor is surprisingly very high at the beginning of the day. It could be due to direct solar radiation hitting the room thermostat. However, following the apparent movement of the sun in the sky, the room air temperature drops quickly (after around one hour) and does not change dramatically during the day.
On the other hand, as (a–f) depict, rooms with only southeast or southwest windows have very similar (relatively low) air temperatures at the beginning of the day due to the lack of solar gain through the window, while they rise during the day as the building’s southeast and southwest façades receive solar radiation. Air temperatures in rooms with southeast windows start to rise earlier and in the rooms with southwest windows rise fast in the late afternoon. According to , probably due to stronger shading effect from the surrounding buildings, this causes more changes in the air temperature of the room with only one southeast window on the first floor. This could also be a probable reason for complaints about varying room temperatures. It goes without saying that, additionally, changes in internal loads in the rooms could also cause (especially random) changes in the room air temperatures.
The average ambient temperatures during the periods when thermal comfort measurements were carried out are presented in . The calculated PMV and PPD in the selected room for the summer period are shown in . Except for a seated person in the middle of the room, for all other cases PMV > +0.5 and PPD > 10%. Draught rate (DR) was zero in all locations for both ankle level and neck level for a seated person. Vertical air temperature differences between head and ankles are presented in .
Table 2. Average ambient temperatures during thermal comfort measurement periodsa.
Table 3. The calculated PMV and PPD in the representative room during summer.
Table 4. Vertical air temperature differences in the representative room during summer
The calculated PMV and PPD in the mentioned room for winter period are shown in . In all three locations for both a seated and a standing person, PMV > −0.5 and PPD < 10%. Draught rate (DR) at the neck level for a seated person in front of the window is 19.3% and for all other cases is zero. Vertical air temperature differences between head and ankles are presented in . The calculated PMV and PPD in the selected room for winter period during the one-week period are shown in . For a standing person at the corner of the room, PMV > −0.5 and PPD < 10. Draught rate (DR) at the neck level for the seated person at the corner of the room is zero.
Table 5. The calculated PMV and PPD in the representative room during winter.
Table 6. Vertical air temperature differences in the representative room during winter.
Table 7. The calculated PMV and PPD in the representative room during winter for one week.
ISO 7730 describes the desired thermal environment for a space as presented in . Accordingly, during summer, thermal comfort for the body as a whole is only achieved for a seated person in the middle of the room. However, there is no local discomfort in any of the three locations. During winter, thermal comfort for the body as a whole with no local discomfort is achieved for both a seated and a standing person in all three locations.
Table 8. The desired thermal environment for a space based on ISO 7730.
The environment is thermally comfortable in the selected office room during winter. However, draught rate at neck level for a seated person in front of the window had a narrow margin with the maximum acceptable draught rate (20% according to ISO 7730). Moreover, the measurements were done 1.5 m away from the window surface and seven employees worked in their offices close to the window (about 1.3 m away from the window surface). This may cause a feeling of draught for these persons. Staff might experience the same problem if they sit close to the ventilation supply devices. All in all, it is in agreement with results derived from questionnaire responses showing that only a few people complained about draught during winter.
To sum it up, the questionnaire results primarily indicate that thermal comfort problems appear during the summer season, whereas both questionnaire and measurement results point to that winter thermal comfort is satisfactory – but not exceptionally good. In a cold climate, retrofitting of historic building design focuses on the trade-off point between energy use and thermal comfort during the heating season. However, summer issues concerning large window areas, absence and prohibiting of shading devices (building code restrictions), high ambient summer temperatures might not have been foreseen as a problem, since the building is situated in a cold climate. Future research should in these cases focus on making HVAC systems more efficient and investigate how both heating and cooling loads can be reduced, independently of hot or cold climate.
Finally, a short interview with one of the employees who explained the indoor climate during summer 2017 in zones 2 and 4 on the second floor shed light on some probable reasons for some of the disturbing factors in these zones. She gave these comments:
‘In my office, the window is not properly acoustically insulated but the level of noise with the closed window is still tolerable. The main issue is the stuffy air which forces one to open the window which, in turn, exacerbates the disturbing noise from outside. Attempts to decrease the room temperature to overcome the stuffy air problem fail since adjusting the room thermostat has no effect. In the other office with two windows facing southeast and southwest, the staff suffers from too high temperature during the day even with internal shading. Due to high ceilings, proper lighting is not provided in the corridor of the zone. Finally, the City Hall in Gävle is a really beautiful historic building but with problems for the staff’s comfort!
4. Conclusion
The indoor environment in the historic City Hall in Gävle is unsatisfactory compared to well-functioning and healthy reference Swedish office buildings (according to questionnaire results). Stuffy air, too high, too low and varying room temperatures, lighting problems and noise are constant issues during both summer and winter. Though this building has been equipped with a modern mechanical ventilation system, it illustrates that the typical historic building thermal comfort issues have not completely been resolved. This also indicates that there should be possibilities for further improving thermal comfort by improved control strategies, since upgrading the building’s envelope, which risks changing the buildings external characteristics and appearance, is not permitted according to the Swedish Building Regulations in historic buildings with heritage value. The results presented particularly pertain to the summer/non-heating period, since thermal comfort during the winter period is not a problem as pointed out in both measurements and questionnaire results. This indicates that modern HVAC systems in cold climates may improve conditions concerning ‘traditional’ historic building winter problems but have summer problems since there often are no design requirements and focus on design issues during summer conditions in cold climates.
Acknowledgements
The work has been carried out under the auspices of the industrial post-graduate school Reesbe, which is financed by the Knowledge Foundation (KK-stiftelsen).
The authors would also like to thank the staff at City Hall in Gävle for their contribution to this research through their replies to the questionnaires and Eva Edlund at City Hall for the related required coordination. In addition to this, we would like to thank Elisabet Linden for her technical support at the laboratory environment at the University of Gävle and Sture Johansson and Bengt Nyman at Gavlefastigheter AB for their technical guidance about the building energy management system of the City Hall in Gävle.
Disclosure statement
No potential conflict of interest was reported by the authors.
Additional information
Funding
References
- Alev, Ü, Eskola, L., Arumägi, E., Jokisalo, J., Donarelli, A., & Siren, K. (2014). Renovation alternatives to improve energy performance of historic rural houses in the Baltic Sea region. Energy and Buildings, 77, 58–66. doi:10.1016/j. enbuild.2014.03.049
- Andersson, K. (1998). Epidemiological approach to indoor air problems. Indoor Air, Suppl.4, 32–39.
- Andersson, K., Stridh, G., Fagerlund, I., & Larsson, B. (1993). The MM questionnaire: A tool when solving indoor climate problems. Department of Occupational and Environmental Medicine, Orebro.
- ASHRAE. (2013). ANSI/ASHRAE standard 55–2013, thermal environmental conditions for human occupancy. Atlanta: American Society of Heating, Refrigerating, and Air-Conditioning Engineers, Inc.
- Auliciems, A. (1981). Towards a psycho-physical model of thermal perception. International Journal of Biometeorology, 25, 109–122.
- Balocco, C., & Calzolari, R. (2008). Natural light design for an ancient building: A case study. Journal of Cultural Heritage, 9, 172–178. doi: 10.1016/j.culher.2007.07.007
- Berge, M., & Matisen, H. M. (2016). Perceived and measured indoor climate conditions in high-performance residential buildings. Energy and Buildings, 127, 1057–1073.
- Buvik, K., Andersen, G., & Tangen, S. (2014). Ambitious renovation of a historical school building in cold climate. Energy Procedia, 48, 1442–1448. doi: 10.1016/j.egypro.2014.02.163
- Choi, J. H., & Moon, J. (2017). Impacts of human and spatial factors on user satisfaction in office environments. Building and Environment, 114, 23–35.
- de Dear, R. J., & Brager, G. S. (1998). Developing an adaptive model of thermal comfort and preference. ASHRAE Technical Data Bulletin, 14(1), 27–49.
- de Dear, R. J., & Fountain, M. E. (1994). Field experiments on occupant comfort and office thermal environments in a hot-humid climate. ASHRAE Transactions, 100(2), 457–475.
- Deuble, M. P., & de Dear, R. J. (2014). Is it hot in here or is it just me? Validating the post-occupancy evaluation. Intelligent Buildings International, 6, 112–134. doi: 10.1080/17508975.2014.883299
- Donnini, G., Molina, J., Martello, C., Lai, D. H. C., Kit, L. H., Chang, C. Y., … Haighighat, F. (1996). Field study of occupant comfort and office thermal environment in a cold climate: Final report on ASHRAE RP-821. Montreal: AND Inc.
- Humphreys, M. A. (1976). Field studies of thermal comfort compared and applied. Building Services Engineer, 44, 5–27.
- Humphreys, M. A. (1978). Outdoor temperatures and comfort indoors. Building Research and Practice (J. CIB), 6(2), 92–105.
- Humphreys, M. A. (1981). The dependence of comfortable temperature upon indoor and outdoor climate. In K. Cena, & J. A. Clark (Eds.), Bioengineering, thermal Physiology and comfort (pp. 229–250). London: Elsevier.
- Humphreys, M. A., Fergus Nicol, J., & Raja, I. A. (2007). Field studies of indoor thermal comfort and the progress of the adaptive approach. Advances in Building Energy Research, 1(1), 55–88. doi: 10.1080/17512549.2007.9687269
- Indraganti, M., Ooka, R., & Rijal, H. B. (2013). Field investigation of comfort temperature in Indian office buildings: A case of Chennai and Hyderabad. Building and Environment, 65, 195–214. doi: 10.1016/j.buildenv.2013.04.007
- INNOVA _ Air Teck Instruments, Technical Documentation. (2007, December). Retrieved from https://manualzz.com/doc/7085569/1221-thermal-comfort-data-logger?fbclid=IwAR1bvQiC9jASOQmk7VTtJsuTbLqUJG7mco9F4grhZsc2aY9emKZG6CW_GXM
- ISO 7730. (2005). Ergonomics of the thermal environment –analytical determination and interpretation of thermal comfort using calculation of the PMV and PPD indices and local thermal comfort criteria (ISO 7730:2005). Brussels: European Committee for Standardization.
- Li, Q., You, R., Chen, C., & Yang, X. (2013). A field investigation and comparative study of indoor environmental quality in heritage Chinese rural buildings with thick rammed earth wall. Energy and Buildings, 62, 286–293. doi:10.1016/ j.enbuild.2013.02.057
- LUMASENSE TECHNOLOGIES. (2007). Retrieved from http://svg-tech.com/clients/svg-tech/Downloads/MM0034_Air_Temperature_Transducer97201424352PM2.pdf & Retrieved from http://svg-tech.com/clients/svg-tech/Downloads/MM0038_Air_Velocity_Transducer97201424451PM1.pdf & Retrieved from http://svg-tech.com/clients/svg-tech/Downloads/MM0037_Humidity_Transducer97201424352PM5.pdf & Retrieved from http://svg-tech.com/clients/svg-tech/Downloads/MM0057_Dry_Heat_Loss_Transducer97201424451PM2.pdf
- Luo, M., Cao, B., Damiens, J., Lin, B., & Zhu, Y. (2014). Evaluating thermal comfort in mixed-mode buildings: A field study in a subtropical climate. Building and Environment. doi: 10.1016/j.buildenv.2014.06.019
- Martínez-Molina, A., Tort-Ausina, I., Cho, S., & Vivancos, J. L. (2016). Energy efficiency and thermal comfort in historic buildings: A review. Renewable and Sustainable Energy Reviews, 61, 70–85.
- Meir, I. A., Garb, Y., Jiao, D., & Cicelsky, A. (2009). Post-occupancy evaluation: An inevitable step toward sustainability. Advances in Building Energy Research, 3(1), 189–219. doi: 10.3763/aber.2009.0307
- The MM Questionnaires. (2014). Retrieved from http://www.mmquestionnaire.se/mmq/mmq.html
- The MM Questionnaires Manual Work Environment. (2014). Retrieved from http://www.mmquestionnaire.se/manuals/work_environment.pdf
- Moran, F., Blight, T., Natarajan, S., & Shea, A. (2014). The use of passive house planning package to reduce energy use and CO2 emissions in historic dwellings. Energy and Buildings, 75, 216–227.
- Morelli, M., Ronby, L., Mikkelsen, S. E., Minzari, M. G., Kildemoes, T., & Tommerup, H. M. (2012). Energy retrofitting of a typical old Danish multi-family building to a nearly-zero energy building based on experiences from a test apartment. Energy and Buildings, 54, 395–406.
- Morhayim, L., & Meir, I. (2008). Survey of an office and laboratory university building: An unhealthy building case study. Proceedings of Indoor Air 2008 Conference, Copenhagen, Denmark, 17–22 August, Paper ID: 933 (electronic proceedings version only).
- Rohdin, P., Dalewski, M., & Moshfegh, B. (2012). Indoor environment and energy use in historic buildings – comparing survey results with measurements and simulations. International Journal of Ventilation, 10(4), 371–382.
- Roulet, C. A., Foradini, F., Cox, C., Maroni, M., & de Oliveira Fernandez, E. (2005). Creating healthy and energy-efficient buildings: Lessons learned from the HOPE project. Proceedings of the 10th International Conference on Indoor Air Quality and Climate, Beijing, China, 4–9 September.
- Rupp, R. F., Vásquez, N. G., & Lamberts, R. (2015). A review of human thermal comfort in the built environment. Energy and Buildings, 105, 178–205.
- Schiller, G., Arens, E., Bauman, F., Benton, C., Fountain, M., & Doherty, T. (1988). A field study of thermal environments and comfort in office buildings. ASHRAE Transactions, 94(2), 280–308.
- Taleghani, M., Tenpierik, M., Kurvers, S., & Dobbelsteen, A. (2013). A review into thermal comfort in buildings. Renewable and Sustainable Energy Reviews, 26, 201–215.
- Varas-Muriel, M. J., Martínez-Garrido, M. I., & Fort, R. (2014). Monitoring the thermal– hygrometric conditions induced by traditional heating systems in a historic Spanish church (12th–16thC). Energy and Buildings, 75, 119–132. doi: 10.1016/j.enbuild.2014.01.049
- Wang, Z., de Dear, R., Luo, M., Lin, B., He, Y., Ghahramani, A., & Zhu, Y. (2018). Individual difference in thermal comfort: A literature review. Building and Environment, 138, 181–193.
- Zagreus, L., Huizenga, C., Arens, E., & Lehrer, D. (2004). Listening to the occupants: A web-based indoor environmental quality survey. Indoor Air, 14(Supplement 8), 65–74.