?Mathematical formulae have been encoded as MathML and are displayed in this HTML version using MathJax in order to improve their display. Uncheck the box to turn MathJax off. This feature requires Javascript. Click on a formula to zoom.
ABSTRACT
Indoor thermal comfort is critical to building sustainability besides improving occupants’ health, well-being and productivity. However, the applicability of the existing comfort standards within different climatic conditions and contextual settings is often in question. This study presents the findings from a longitudinal thermal comfort study conducted in low-income affordable housing in Mumbai, India. Surveys were conducted in three distinct seasons within a warm–humid climate. The linear regression method yielded a mean neutral temperature of 28.3°C and a wide comfort band ranging from 24.6°C to 32.2°C indicating high thermal adaptation among the occupants. The preferred temperature was found to be 26.3°C. Adaptive comfort standards, ASHRAE and the National Building Code of India prescribed a narrow range of comfort and were ineffective in predicting comfort conditions within affordable housing units. The role of income in shaping comfort expectations was established, lending support to the economic dimension of comfort. The results would be helpful in providing design recommendations for the future affordable housing stock and the development of an adaptive comfort model for vulnerable low-income communities.
1. Introduction
1.1. Overview
Thermal comfort is defined as ‘that condition of mind which expresses satisfaction with the thermal environment and is assessed by subjective evaluation’ (American Society of Heating Refrigerating and Air Conditioning Engineers, Citation2017). There are two widely adopted approaches to thermal comfort – heat balance approach and adaptive approach. The heat balance approach, based on laboratory studies, considers occupants as passive recipients of thermal stimuli, thus miscalculating comfort conditions for naturally ventilated buildings. On the other hand, the field study-based adaptive approach considers the influence of thermal adaptation and is deemed effective in predicting the often-wider comfort range observed in naturally ventilated buildings. However, the adaptive practice is context dependent (Nicol & Humphreys, Citation2002) and is influenced by psychological, physiological and behavioural factors (de Dear et al., Citation1997). Thus, it could be said that the perception of comfort may vary among people living in dissimilar building typologies, climate, culture or contextual settings (de Dear et al., Citation1997; Kshetrimayum et al., Citation2020). This complexity of thermal comfort perception further increases within low-income population where another degree of freedom exists in the form of socio-economic level (Pérez-Fargallo et al., Citation2018). However, till date, the issue of adaptive comfort in these vulnerable and resource-constrained communities has not been adequately addressed in scientific literature.
India’s urban housing shortage, estimated at 18.78 million, is primarily driven by economically weaker sections and low-income group population. Multiple efforts have been carried out by the Government of India to meet the burgeoning housing demand through affordable housing schemes and policy initiatives such as National Housing Policy, 1994; Jawaharlal Nehru National Urban Renewal Mission, 2005; Rajiv Awas Yojana 2013 (Reserve Bank of India, Citation2018). Pradhan Mantri Awas Yojana (PMAY), launched in 2015, is one of the significant governmental initiatives which integrates all the previous urban housing schemes (KPMG, Citation2012; Ministry of Housing & Urban Poverty Alleviation Government of India, Citation2015). PMAY aims at providing affordable ‘Housing for All’ by the year 2022 through the construction of 20 million urban housing units (Bardhan et al., Citation2020; Ministry of Housing & Urban Poverty Alleviation Government of India, Citation2015). Additionally, affordable housing demand is projected to rise to 38 million units by 2030 which would further surge the upcoming housing stock (India Brand Equity Foundation, Citation2010). Indian affordable housing sector plays a catalytic role in fulfilling the UN Sustainable Development Goals for 2030, SDG 3 (Good health and well-being), SDG 11 (Sustainable and clean cities) and SDG 13 (Climate action), besides accomplishing the climate change mitigation goals of Paris Pact and Montreal Protocol [1]. Given the centrality of affordable housing in the creation of sustainable built environment, investigating their environmental performance towards human comfort is imperative. Thermal comfort becomes a critical environmental parameter due to the magnitude of the health effects that are related to it.
1.2. Literature review
Significant research has been carried out in the context of thermal comfort improvement (Bhikhoo et al., Citation2017; Hashemi, Citation2017; Hong et al., Citation2009; Oluwafeyikemi & Julie, Citation2015), thermal performance (Ibrahim et al., Citation2014; Pignatta et al., Citation2017; Santamouris et al., Citation2014; Tinker et al., Citation2004) and adaptive comfort behaviour (Barkenbus, Citation2013; Chen et al., Citation2017; Moore et al., Citation2017) in low-income housing context, but studies exploring acceptable comfort conditions and thermal perceptions are scarce. To the authors’ knowledge, only two field studies were found in this regard. The first study, conducted by Soebarto and Bennetts (Soebarto & Bennetts, Citation2014), investigated comfort conditions within Australian affordable homes and observed a wide range of comfort temperature due to greater reliance on low-cost adaptive actions. The research concluded that affordable home owners delayed the use of air conditioners despite experiencing warmer sensations due to implications on energy bills. In another study performed within Chilean social housing (Pérez-Fargallo et al., Citation2018), a new adaptive model was developed reflecting the inhabitants’ needs and socio-economic culture. The research suggested that low-income dwellers show more tolerance to extreme temperatures and despite being out of the comfort standards’ limits, they are considered to be in thermal comfort. However, such studies have not been performed yet in Indian or the Global South, where socio-cultural complexities are critical factors in shaping comfort perception (Malik & Bardhan, Citation2020a).
Representative studies in the Global South that have tested the validity of the standards like EN 16798 (formerly 15251) and ASHRAE 55-2017 in regulating the occupant’s thermal comfort in social housing suggests that users have a high tolerance to extreme temperatures (Pérez-Fargallo et al., Citation2018). The Indian thermal comfort research is predominantly focused on naturally ventilated offices and classrooms and a few studies related to the residential building typology (Malik et al., Citation2020a). Some earlier studies in vernacular residential architecture demonstrated that design elements like high ceiling height, height of the building and nearly 40% of fenestration are critical to maintain thermally comfortable natural ventilation. Residences, especially in warm and humid climates, that emphasize on humidity removal are potentially more thermally comfortable than other buildings. Singh et al. (Citation2011) carried out a comfort survey in three different climatic zones of North-East India in four different seasons of a year concluded that the predicted mean vote (PMV) deviates from the actual mean votes by a factor of adaptive coefficient which depict the range of the adaptive actions residents undertake in different seasons to restore thermal comfort. Nguyen et al. (Citation2012) emphasize that the derived adaptive coefficient reflects the variability of the thermal comfort controls residents use and that it can be used for thermal comfort assessment of the buildings. Recent studies demonstrated that comfort temperature for the summer and winter season were within 30.6°C and 25.2°C and that the preferred level of clothing for summer and winter are 0.30 and 0.80 clo, respectively (Kumar et al., Citation2016). Most studies conducted in residential buildings in India emphasized that controlling air velocity was the most preferred method of thermal adaptation over adjusting clothing and window opening (Földváry Ličina et al., Citation2018). While these studies are more concentrated in the overall residential sector, specific studies on residential thermal comfort in the affordable housing segment remain understudied and need concentrated attention. Moreover, the applicability of the existing international and national thermal comfort standards to Indian affordable housing is also subject worthy of investigation.
1.3. Objectives
In view of the above, this study aims at exploring thermal comfort conditions within affordable housing occupied by low-income population, henceforth referred to as affordable housing. The research would rely on the field study data for apprising the comfort preferences of the occupants. The findings from this work could aid the architects and policymakers in providing comfortable environment for the future housing stock. The broader goal is to enhance occupant's health, well-being and productivity by improving upon comfort conditions of the vulnerable population. As per the authors’ knowledge, this is the first-of-its-kind study to comprehend comfort requirements and perceptions within the affordable housing of India. The major objectives of this study are:
To determine preferred temperature, thermal neutral temperature and thermal acceptability within affordable housing.
To examine the influence of psychological factors on comfort perception of low-income population.
To test the applicability of the existing comfort standards in Indian affordable housing context.
This paper is an extended version of work published in Malik and Bardhan (Citation2020b) where we discussed occupants’ thermal sensation and comfort temperature. In the present study, we have extended our previous work to occupants’ subjective comfort votes comprising humidity, air movement and overall acceptability; analysis of preferred temperature and explored the psychological aspect of comfort to understand the thermal perception of occupants. The paper is organized as follows: Section 2 introduces the study area, field study method and data analysis approach. The subsequent section presents the field study results and analyses the subjective comfort votes and comfort acceptability (CA). Comfort conditions and neutral temperature ranges are estimated thereafter in this section. Section 3 further examines the effect of psychological factors on comfort perception and investigates the performance of the existing comfort standards in the affordable housing context. Section 4 offers a discussion on the policy implications through this study and identifies the need for a novel adaptive model suitable for the low-income population. Key conclusions are presented in the closing section of this paper.
2. Materials and methods
2.1. Study area
The coastal city of Mumbai spread across 603 square kilometres is located in the southwestern part of India. The city falls within tropical savanna climate as per Koppen classification and warm–humid climate according to National Building Code of India. Mumbai has three distinct seasons: monsoon, winter and summer and experiences an average annual temperature of 27.2°C and average annual precipitation of 245.7 cm (M.C.G.M., Citation2011). Two government-provided affordable housing– a slum rehabilitation housing and an institutional staff housing, situated in administrative ward M and ward S, respectively, were selected as the field study locations. More than half of the population of selected wards M and S consist of low-income people and thus these wards are representative of the city’s low-income population (Mehrotra et al., Citation2018). The housing units comprise conventional concrete frame structure with brick in-fill walls and the floor area ranges from 22 to 26 square metres. The details related to the construction materials are listed in . The spatial configuration of the surveyed housing units is attached in the Appendix. The selected buildings were operated in free-running (fan-assisted natural ventilation) mode during the investigation. In the free-running mode, no energy is supplied for heating or cooling and the thermal environment can be controlled to an extent by opening windows or doors, using ceiling fans or curtains (Humphreys et al., Citation2007).
Table 1. Construction details of the case study buildings.
2.2. Field study
Longitudinal field study, conforming to ASHRAE Class II protocol, was conducted in three different seasons of Mumbai to understand thermal comfort conditions and preferences of the occupants. Longitudinal sampling technique has been adopted in several classical thermal comfort studies over cross-sectional method (de Dear et al., Citation1997; Humphreys et al., Citation2007; Sharma & Ali, Citation1986) because of its advantage of providing responses over an extended period, such as months or seasons, thereby ensuring diverse thermal environments. The data collection method included a thermal comfort questionnaire survey and concurrent monitoring and measurement of environmental parameters such as air temperature, relative humidity and air velocity. Ethical approval was sought and obtained from the Institute ethics committee (Proposal no: IITB-IEC/2020/016). All the participants provided a verbal consent at the beginning of the study in which they were assured that their responses would be treated confidentially and they could withdraw from the research at any stage. Longitudinal surveys require dedication on the part of the subjects, since the survey is conducted multiple times a day and across seasons. It is common that some of the subjects may lose interest leading to unequal number of surveys across the day and seasons. To minimize the loss of samples, participants were informed before the start of surveys about the timeframe and dedication required. The questionnaire was prepared in English and then translated into Hindi. Each respondent was enquired thrice a day – during morning (9:00 am−12:00 noon), afternoon (12:00 noon −5:00 pm) and evening (5:00 pm–9:00 pm) in each season. These times were chosen based on the average temperature peaks of the city. The survey screening criteria included a minimum residency of 6 months and a minimum age of 16 years.
2.2.1. Subjective measurements
The questionnaire comprised four segments: socio-demographic profiles, subjective thermal comfort votes, personal variables and adaptation controls. Socio-demographic characteristics of respondents: age, gender, height, weight, years of residency, housing unit location and appliance ownership were enquired. Subjective thermal comfort segment contained questions about thermal, humidity and air movement sensation and preference votes. A close-ended question enquiring about the overall CA was included. ASHRAE’s seven-point scale of thermal sensation and Nicol’s five-point scale of preference were used (see ).
Table 2. Sensation scales used (Humphreys et al., Citation2016).
Personal thermal comfort variables like clothing insulation and metabolic rates were enquired. Clothing insulation checklist was adopted from ASHRAE Standard 55-2010 [23] and typical Indian ensembles and garments such as saree, salwar kameez, dupatta and dhoti were added from relevant literature. Suitable chair insulation was also recorded and added to insulation values. Metabolic activity of respondents performed in the past 15 min was enquired and the corresponding metabolic rates were identified from ISO 8996 ‘Ergonomics of the thermal environment – Determination of metabolic rate’ (International Organization for Standardization, Citation2004). Adaptation controls are not within the scope of this study and have been discussed in a supplementary study (Malik et al., Citation2020b).
2.2.2. Field measurements
Outdoor environmental data comprising temperature and air relative humidity were monitored from the nearest weather stations (‘Weather Underground,’ Citation2019). Indoor environmental data were measured using research grade monitoring Testo 480 (Testo AG & Germany, Citation2018) multi-function measuring instrument comprising digital temperature, humidity and air flow meter; indoor air quality probe; globe thermometer; vane probe and lux meter (). The measuring instruments were placed close to the participant at a height equal to their working plane. depicts the glimpses from field study comprising instrumental set-up, clothing ensemble of participants and general characteristics of the housing units.
Figure 1. Glimpses from the field study.
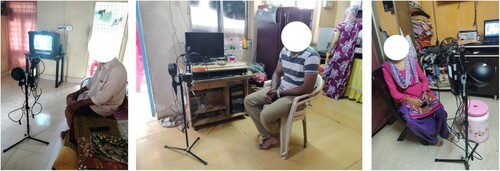
Table 3. Indoor environment measurement instruments and specifications.
2.3. Data assembly
The analysis began with compiling, coding and computing raw data obtained from different sources such as meteorological website, questionnaires and field measurements. This material was sorted and summarized into a Microsoft Excel data set and then transferred to statistical package for social sciences (SPSS) software version 24. Monitored data from Testo 480 meter, which measured the indoor thermal conditions, was downloaded through Easy climate Software into an excel spreadsheet. Data from questionnaire forms which included personal identifiers, subjective comfort votes, personal variables and behavioural adaptation were coded into excel spreadsheet at the end of each survey day. Outdoor environment data were then matched with the data obtained from the questionnaires using the date and time noted in the filled questionnaire forms. After eliminating data errors such as duplicate or missing values, the computed Excel data were converted into the SPSS file for analysis.
3. Results
3.1. Sample size description
A total of 705 set of responses were collected through the field study administered in three seasons of Mumbai. During the first phase, conducted in the monsoon months of August–September, 103 occupants participated and 277 set of responses were yielded. The second phase was administered in January, the coolest month of the year and 253 set of responses were obtained. The last phase of the survey carried out in the hottest month of May returned 175 set of responses. The sample size varied in each season depending on the participants’ availability and willingness to participate. A detailed summary of the sample size distribution is presented in .
Table 4. Sample size distribution with respect to season, gender and time of the day.
Gender distribution of thermal comfort responses informs that around three-fourth of the responses were collected from the female participants. Female members of the low-income households spend more time indoors than the male members and thus they have a larger representation. Seasonal distribution of survey responses comprises 40% in monsoon season followed by 35% and 25% in winter and summer seasons, respectively. The temporal distribution of responses consists of 17% in morning, 41% in afternoon and the rest 42% in evening hours. Measurements were not conducted during the night time (9:00 pm to 9:00 am) because of limited access to the residential units.
3.2. Personal variables: clothing insulation and metabolic rates
Occupants clothing attire encompassed of Indian ensembles such as saree, salwar kameez and lungi or western attires such as denims, trousers, shirts and trousers at the time of field enquiry. The mean clothing insulation was observed as 0.53 with a minimum value of 0.15 clo and the maximum being 1.52 clo. The seasonal variation in clothing insulation, as depicted in , was limited with no significant correlation among clothing insulation and indoor or outdoor environmental variables. Male participants witnessed a wider range of clothing insulation since they could freely adjust their clothing attire from lungi (0.15 clo) to trousers, shirt and cardigan (0.93 clo). Female members, on the contrary, could avail limited clothing adjustment opportunities because of socio-cultural conformities. Moreover, there were instances of unusually higher clothing insulation worn by females in summers (1.52 clo) due to the prevalent religious purdah system. A detailed analysis of behavioural adaptation in form of clothing adjustment with respect to gender and season has been presented in a supplementary study as Malik et al. (Citation2020b).
Table 5. Summary of clothing insulation of the surveyed subjects
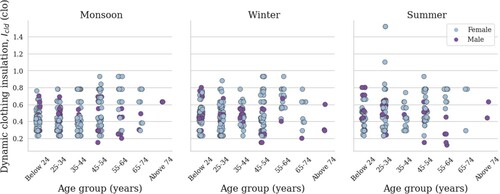
The activity levels of the respondents within the past 15 min or less were logged at the time of the enquiry. The metabolic rates ranged from 0.7 Met (sleeping) to 2.0 Met (standing working). The most occurring value was found to be 0.9 Met which corresponds to the ‘passive seated’ activity. Since about 40% of the observations recorded metabolic rate higher than 1.2 met, it was necessary to assess the clothing insulation in conjunction with activity levels. Dynamic clothing insulation which refers to the adjusted clothing insulation for occupants with dynamic activity levels (met>1.2) was considered. depicts the gender and seasonal distribution of dynamic clothing insulation worn by the participants.
Figure 2. Seasonal distribution of dynamic clothing insulation levels with occupants’ age and gender.
3.3. Appliance ownership
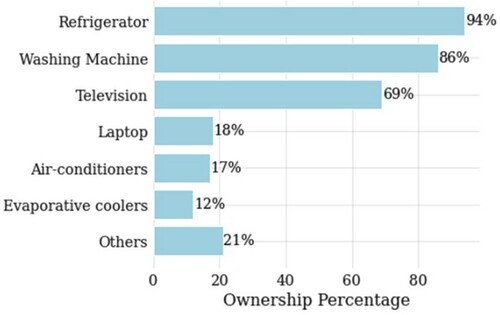
Participants were enquired about the ownership of appliances in their respective households which included white goods (Cabeza et al., Citation2018) such as refrigerators, washing machines for covering the basic needs, brown goods such as TVs, computers for fulfilling secondary needs and small appliances such as microwaves, iron etc. Appliance ownership data, depicted in , informed that refrigerators were owned by most of the households (94%) whereas washing machines ownership accounted for 70%. Space-conditioning white goods such as air conditioners (AC) and evaporative coolers (EC) had a collective ownership of 29%. Brown goods such as TVs, laptops and computers were available in 86% and 18% of the households, respectively. Additionally, the cumulative ownership of small appliances such as geyser, microwave and iron was 21%.
Figure 3. Appliance ownership within participants’ households.
3.4. Environmental conditions
Outdoor environmental conditions comprised wide-ranging temperature and relative humidity levels with a lowest daily mean temperature of 23.1°C in the coolest month of January and the highest temperature recorded at 31.4°C in the summer season in the month of May. The lowest daily mean outdoor humidity level at 39.0% was observed in the winter season, while humidity as high as 86.3% was logged during the monsoon season. presents the descriptive of daily mean outdoor temperature and daily mean outdoor air relative humidity during the survey period. Indoor environmental variables, namely indoor air temperature (Ta), globe temperature (Tg), relative humidity, air velocity (Va), carbon dioxide concentration (CO2) and illuminance levels, were recorded simultaneously while carrying out the questionnaire survey. In addition, the mean radiant temperature and operative temperature were determined using standard calculations (Humphreys et al., Citation2016). Illuminance levels analysis is not presented in this paper. Descriptive statistics of outdoor and indoor environmental conditions are described in .
Table 6. Seasonal averages of outdoor and indoor environmental data.
summarizes the strength of the relationship between indoor environmental variables logged during the field surveys. Robust positive correlations among air velocity, Va and Tair (r = 0.25, p < .001); and Rhin (r = .36, p < .001) suggest that the occupants may have adopted the use of environmental controls to improve indoor air velocity at high temperature and humidity conditions. This is in agreement with ASHRAE Standard 55 (American Society of Heating Refrigerating and Air Conditioning Engineers, Citation2017) which suggests that indoor operative temperature can be elevated above the still air limits up to a maximum of 3°C, if there are also higher air speeds ranging from 0.2 to 0.8 m/s. Previous studies have also observed that occupants make use of elevated air speeds to achieve comfort at higher indoor temperatures and humidity (Indraganti, Citation2011; Indraganti et al., Citation2015; Manu et al., Citation2014; Mustapa et al., Citation2016).
Table 7. Correlation among environmental variables.
The mean radiant temperature (Tmr) witnessed significant but moderate strength of association with Tair (r = 0.79, p < .001) indicating the presence of long-wave radiations within the indoor built environment. This could be attributed to radiant heat gain through the building materials. Further, the presence of radiation sources cannot be established with a poor negative association of Tg and CO2. This confirmation was necessary to ascertain the choice of temperature variable for carrying out analysis. Considering air temperature, Tair may be misleading due to the significance of radiant heat; operative temperature would be used for further analysis in this study.
3.5. Subjective comfort responses
3.5.1. Thermal sensation and thermal preference votes
The thermal sensation of affordable housing occupants was enquired on a seven-point scale (refer ). The seasonal distribution of thermal sensation votes (TSV), as presented in (a), reveals that 90% of the participants across all seasons voted within the comfortable range, corresponding to slightly cool (−1), neutral (0) and slighty warm (+1) sensation. Neutral sensation votes were highest in the monsoon season followed by winter and summer, respectively. Around 7.4% selected for warm (+2), 1% for hot (+3) and 1.3% for cool sensations (−2) across the three seasons. None of the participants reported cold sensation across the survey period. A mean TSV of 0.11 was observed which is close to neutrality but on the warmer side.
Figure 4. (a) Seasonal distribution of TSV. (b) Cross-tabulation of subjective thermal votes.
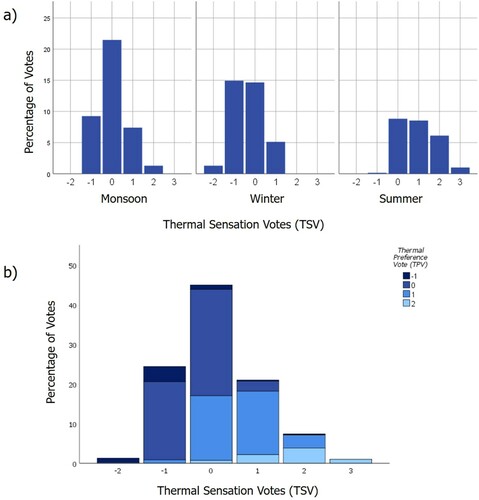
Thermal preference vote, TPV, was recorded on the five-point Nicol scale. The mean TPV was towards the cooler side of the preference scale (0.45) with a standard deviation of ±0.73. Half of the participants preferred no change (0) in their thermal environment, whereas 36% voted for a bit cooler (+1) and 8% desired a much cooler environment (+2). Only 6% of the participants preferred a bit warmer environment (−1) and most of these votes corresponded to the winter season. (b) shows the cross-tabulation of subjective thermal votes and informs that there was a stark difference in thermal sensation and preference among the occupants with only 60% of neutral sensation votes corresponding to neutral preference.
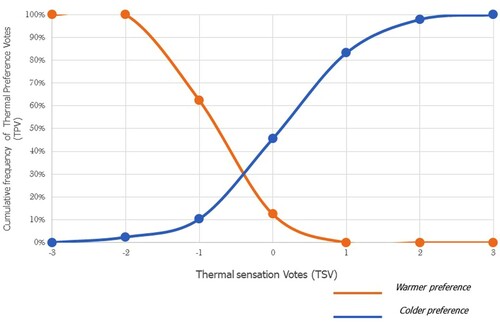
Correlation analysis among TSV and TPV yielded robust positive association (r = 0.70, p < .001). However, a moderate correlation coefficient of 0.70 necessitated to understand the relationship between the subjective thermal votes. TPV was divided into warmer and cooler sensations and plotted against the corresponding TSV, as demonstrated in . The resultant graph indicates that 17% of the participants voting neutral on the thermal sensation scale preferred a cooler environment while 1% desired a warmer environment. Further, the point of intersection of cooler and warmer preference votes is located on the cooler side of the sensation scale. This finding is supported by Damiati et al.’s observation that most people living in a hot climate have natural desire to prefer a cooler condition, although they probably accepted the prevailing environment (Damiati et al., Citation2016). Other thermal comfort studies conducted in hot and humid Asian environments observed similar inferences (Indraganti & Boussaa, Citation2017; Rijal et al., Citation2010).
Figure 5. Relationship between TSV and TPV.
3.5.2. Humidity and air movement subjective votes
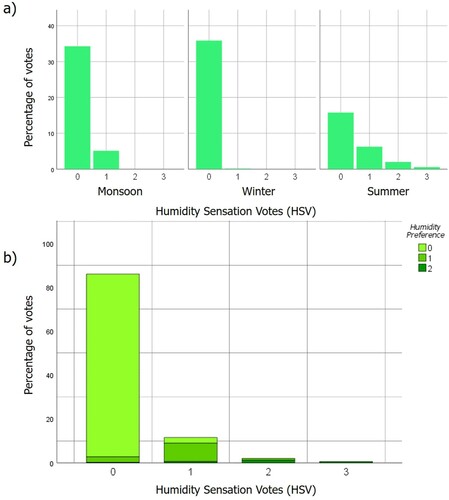
The literature suggests that relative humidity and air velocity play a significant role in thermal comfort within warm humid climate (Nicol, Citation2004). To gain a deeper insight about comfort conditions within low-income affordable housing, humidity sensation votes (HSV), humidity preference (HPV), air movement sensation (ASV) and air movement preference (APV) were enquired. The seasonal distribution of HSV is illustrated in (a). When compared with the TSV, HSV had a significantly higher share of neutral sensation (0) across the three seasons with 86% votes. The winter season demonstrated a highest neutral HSV, while the summer season recorded the lowest HSV. The summer season witnessed a highest dispersion of humidity sensation with occupants voting ‘slightly humid’ (+1) to ‘ very much humid’ (+3) sensation. None of the participants experienced drier sensations (−1 to −3) across three seasons. HPV corresponded well with HSV with 97% occupants who voted neutral on HSV preferred no change (0) in humidity levels. The mean HPV was observed to be −0.17, suggesting occupants preferred a slightly drier environment.
Figure 6. (a) Seasonal distribution of HSV. (b) Cross-tabulation of subjective humidity votes.
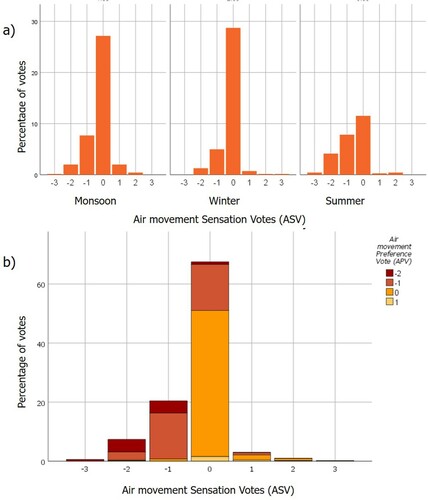
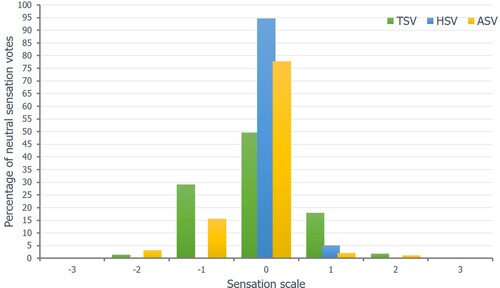
Similar to thermal and humidity sensation, a seven-point sensation scale was used to record ASV. Seasonal distribution of ASV presented in (a) is skewed towards the left side indicating most of the subjects reported neutral or lesser air speed than what they desire for thermal comfort. The mean ASV of −0.31 was observed which is towards still air movement sensation. 67.5% of the participants across the three seasons voted for neutral (0) while 28.4% percieved air to be slightly still (−1), still (−2) or very still sensations (−3). Only 4.1% of the participants voted positive on air movement sensation scale (+1 to +3). These votes corresponded to occupants residing in the corner housing units located near the arterial roads where drafts or breeze were experienced due to the built form massing. Summer season recorded maximum ASV falling on the left side because at high humidity and high temperature, occupants desire higher air velocities for evaporative cooling effect. The air movement preference votes (APV) comprised 53% occupants preferring no change (0), 35% preferring higher air movement (−1, −2) while only 2% voted for preference of lesser air movement (+1). The cross-tabulation graph of ASV and APV depicted in (b) demonstrates that out of the 65% of the participants voting for neutral sensation, only 47% preferred no change. However, the rest had varied preferences ranging from much higher air movement (−2) to lesser air movement (−1).
Figure 7. (a) Seasonal distribution of ASV. (b) Cross-tabulation of subjective air movement votes.
3.5.3. Overall comfort acceptability
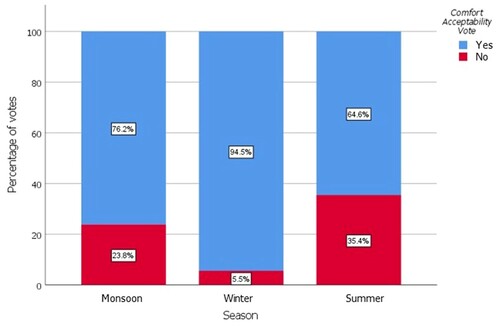
Participants were questioned about their overall CA, which is influenced by physio-psychological variables apart from the six thermal comfort parameters (Indraganti et al., Citation2014). The responses were recorded as a binary data, i.e. 0 if the environment was acceptable and 1, if unacceptable. The results, as presented in , reveal that around 80% of the participants accepted their environment, while the rest reported unacceptable environment. The seasonal distribution of CA votes informs that winter season recorded the highest percentage (94.5%) of acceptable votes, followed by monsoon (76.2%) and summer (64.6%).
Figure 8. Seasonal distribution of CA votes.
CA demonstrated moderate yet significant correlations with TSV (R = 0.48, p < .001), HSV (R = 0.43, p < .001) and ASV (R = 0.40, p < .001). Neutral sensations on the thermal sensation scale did not match with 100% acceptability votes, as shown in . Instead, CA coincided well with 95% neutral HSV and 78% neutral ASV but witnessed partial overlap with 49% neutral TSV. The analysis suggests that, in the case of warm and humid climate, humidity and air movement are important factors influencing CA other than widely accepted temperature variables. The current thermal comfort assessment models, often consider air movements effects by choosing operative temperature for analysis; however, the effects of humidity are seldom considered.
Figure 9. CA distribution over neutral sensation votes.
3.6. Thermal neutral temperature and preferred temperature
3.6.1. Thermal neutral temperature
Thermal neutrality is defined as the indoor temperature corresponding to neutral thermal sensation (de Dear et al., Citation1997). The indoor temperature variables such as air temperature (Ta), globe temperature (Tg) or operative temperature (Top) have been widely used for in thermal comfort studies. In this study, Top is adopted for analysis because it accounts for the radiant heat gain and air velocities, thus explaining the thermal sensation better. Linear regression of thermal sensation votes, TSV, upon Top was performed to identify the range of neutral temperature, Tn, over which the affordable housing occupants feel comfortable. The analysis derived the following relationship:
(1)
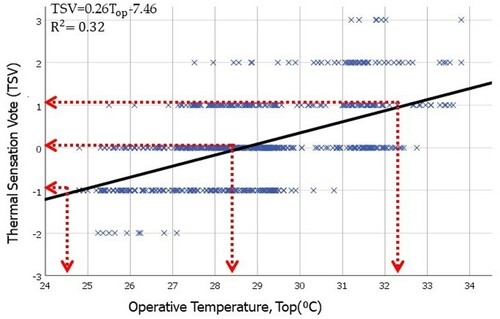
(1) The regression results yielded a significant relationship (r = 0.56, p < .001) between TSV and Top, as shown in . Tn was calculated from the resultant Equation (1) at TSV = 0 and was found to be 28.7°C. The neutral temperature band for 90% and 80% acceptability was observed as 26.5–30.2°C and 24.6–32.2°C, respectively. The slope of regression equation informs about the sensitivity of population to changes in indoor temperature. For every 3.8°C change in Top, TSV shifted one point on the sensation scale which suggests low sensitivity and in turn higher level of adaptation by occupants when compared with other relevant Indian studies (Indraganti, Citation2010; Rajasekar & Ramachandraiah, Citation2010). A slope of 0.26°C−1 suggests that occupants of affordable housing, in the absence of space-conditioning equipment due to economic constraint, may have relied on the available adaptive opportunity for restoring comfort and are hence more tolerant to high temperatures and humidity conditions. Similar inferences were drawn by Indraganti and Rao (Indraganti & Rao, Citation2010) while analysing the effect of economic group on thermal comfort for Indian residences.
Figure 10. Neutral temperature band for 80% acceptability estimated by regression analysis of TSV and Top.
3.6.2. Preferred temperature
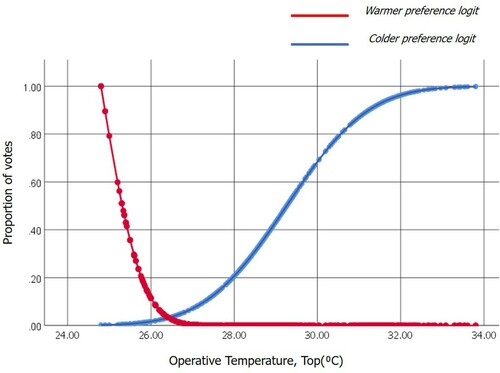
The preferred temperature (Tpref) was also analysed in this study to understand the neutral and preferred conditions of the occupants. Probit analysis was employed to calculate Tpref using the method described in Singh et al. (Citation2017). The thermal preference votes (TPV) corresponding to cooler preferences (+1 or +2) and warmer preferences (−1 or −2) were transformed into probit functions. The probability curves of prefering warmer preference (Pw) and colder preference (Pc) were plotted against operative temperature, as depicted in . The probit curves intersect the x-axis at 26.3°C indicating the preferred temperature of the occupants. Tpref is 2°C lower than the thermal neutral temperature, Tn (28.3°C), which is in agreement with the findings of Humphreys and Hancock that people may not want to feel neutral (Humphreys & Hancock, Citation2007). The difference among Tpref and Tn suggests that occupants’ may desire a different temperature than their thermal neutral temperature and supports our findings from Section 3.5.1.
Figure 11. Preferred temperature analysis.
3.7. Psychological influence on comfort perception
The comparative analysis presented in the earlier section reveals that affordable housing occupants adapt to a wider band of comfort and are consequently more satisfied with their thermal environment. Thermal adaptation within the resource-constrained low-income residences is recognized as a complex process influenced by a host of behavioural, socio-cultural, economical and contextual factors (Malik & Bardhan, Citation2020a; Pérez-Fargallo et al., Citation2018). Since the behavioural, socio-cultural and contextual aspects have been focused in supplementary studies to this paper, here we focus on the psychological aspect of thermal adaptation.
Psychological adaptation describes the extent to which expectation and habituation alter thermal perception of the occupants (de Dear et al., Citation1997). Income levels are analysed in relation to CA to understand the psychological influence of expectations on comfort perception. Ownership of appliances, as explained in Section 2, is used as an income proxy since the pilot survey reported a response bias towards questions related to household income and expenditure. The number of appliances owned by a participants’ household and the prices of those appliances are used to estimate household income score (HIS). Multiple studies have adopted this approach of using proxy indicators of income in the absence of direct measurement (Emorine et al., Citation2014; Po et al., Citation2012). The proposed index is based on a normalized score ranging from 0 to 1 such that the lesser the HIS for a participants’ household, the lower would be the income and vice versa. The distribution of HIS is shown in (a).
Figure 12. (a) Household income score distribution. (b) CA in relation to income.
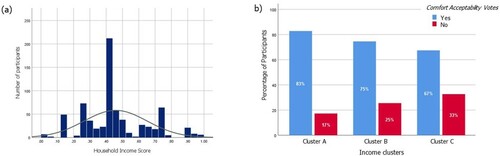
The grouping of the data set into three income clusters using k-means clustering algorithm yielded in three distinct clusters having minimum variance within groups and maximum variance between the groups. The resultant clusters: Cluster A, Cluster B and Cluster C are characterized by relatively lower, moderate and higher incomes, respectively. The lowest income group, Cluster A, has 83% occupants voting acceptable, while the acceptability decreases to 75% and 67% for Cluster B and Cluster C. (b) depicts the differences in CA votes among the income clusters reveal a clear pattern that the lower income groups have higher CA while the higher income groups have a lesser acceptance to their environment. This trend could be attributed to the occupants’ altered expectations for thermal pleasure with an increase in income levels. It is interesting to note that occupants of Cluster C own mechanical cooling devices such as air conditioners and evaporative coolers, though none of them were operational at the time of the surveys. In fact, these group of occupants are least satisifed with their thermal environment. A possible explanation of such behaviour is the gendered electricity use within low-income housing of India acknowledged in the literature. Female occupants, representing 76% of the samples, refrain from using energy-intensive electrical appliances for their own comfort practices, and only operate for the children and male occupants’ needs (Sunikka-Blank et al., Citation2019).
The analysis of the availability of adaptive controls and its relation with thermal comfort revealed the psychological modification in occupants’ comfort perception. The literature suggests that when people have an adaptive opportunity available through environmental controls to alter their thermal environment, they tend to overlook thermal inadequancies and are forgiving in nature (Deuble & de Dear, Citation2012; Kalz & Pfafferott, Citation2014). The analysis revealed no particular relationship between the available controls and neutral temperature indicating occupants perception of comfort did not change with the mere access to controls. In other words, the availability of controls such as window, exhaust fans and air conditioners does not necessarily imply that low-income occupants are exercising that control. Instead, the perceived control, which is the interaction between different degrees of available and exercised control, should be considered (Sakellaris et al., Citation2019). However, such an investigation did not form the scope of this work and needs a separate study. Our general understanding is that low-income occupants limit the exercise of available controls due to barriers in the form of high operating cost, maintenance, socio-cultural conformities, contextual setting (Malik et al., Citation2020b).
4. Comparison with existing studies and thermal comfort standards
First, we present the comparison of thermal comfort conditions from the present study with relevant Asian studies. Existing studies selected for comparison are based on their suitability with respect to the climate and ventilation mode. The estimated mean neutral temperature, 28.3°C, is slightly lower than that obtained by Indraganti (Citation2010), Rajasekar and Ramachandraiah (Citation2010) and Han et al. (Citation2007). However, the results find close match with Nguyen et al.’s adaptive model for south-east Asian naturally ventilated buildings where occupants reported comfortable at the mean neutral temperature of 28°C (Nguyen et al., Citation2012). The regression between TSV and Top yielded a small coefficient of determination, R2 value of 0.32 suggesting large deviations in subjective comfort votes due to personal differences in adaptation. Similar inferences were drawn by Jindal (Citation2018) for naturally ventilated Indian school buildings. Furthermore, the present study identifies a wider neutral temperature band of around 7.6°C for 80% acceptability in comparison to previous studies in Indian and Chinese context where a narrower band of around 5.8–6.6°C was observed (Indraganti, Citation2010; Rajasekar & Ramachandraiah, Citation2010; Zhang et al., Citation2010). These differences in comfortable conditions suggest that low-income occupants differ in their perception of comfort which could be attributed to physiological (acclimitization), behavioural adjustment (use of environmental controls, clothing adjustment etc.) or psychological (expectations) factors.
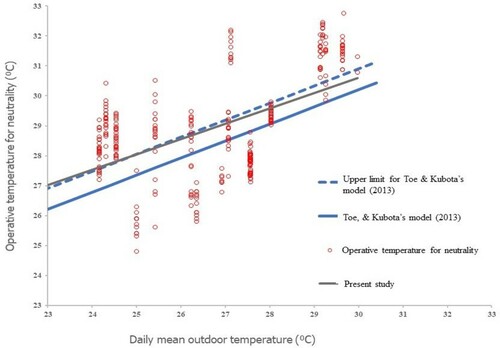
Next, a comparison with Toe and Kubota’s study (Toe & Kubota, Citation2013) for hot and humid naturally ventilated buildings was performed. Toe and Kubota’s adaptive model (TKM) uses ASHRAE RP-884 database representing the global population to predict comfort temperature as a function of outdoor temperature. Neutral operative temperatures derived from the present study were plotted against the daily mean running outdoor temperature and superimposed on TKM, as illustrated in . The resultant graph witnessed 57% of data lying above the upper limit of TKM hinting towards differences in comfort conditions between the global and Indian population. Furthermore, the present study yielded a slighly higher regression coefficient of 0.62 when compared with that of TKM (0.57) indicating that the occupants of Indian affordable housing are less sensitive to changes in outdoor temperature.
Figure 13. Comparison with Toe and Kubota’s model (Toe & Kubota, Citation2013).
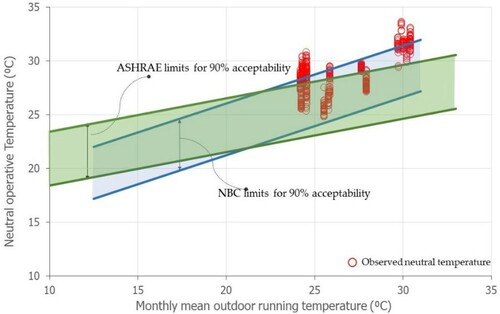
Further, we investigate the applicability of ASHRAE Standard-55 (American Society of Heating Refrigerating and Air Conditioning Engineers, Citation2017) and National Building Code (NBC) of India (Bureau of Indian Standards, Citation2016) in predicting occupant comfort within affordable housing of Mumbai. Both these standards prescribe adaptive comfort models for naturally ventilated buildings and predict indoor comfort temperature as a function of prevailing mean outdoor temperature. While ASHRAE model is derived from responses of global population located within different typologies and climatic conditions, NBC’s Indian model for Adaptive Comfort is developed from field studies conducted in office buildings located in five distinct climatic zones of India. The neutral operative temperatures obtained from the present study were plotted against the prevailing mean outdoor temperature and superimposed on the prescribed ranges by ASHRAE and NBC, as illustrated in . The resultant adaptive comfort chart informs that much of the observed neutral temperatures fall on the warmer side and above the 90% acceptability limits of thermal comfort standards. The widely adopted international standard, ASHRAE as well as the Indian standard, NBC prescribe a narrow comfort band of around 5°C while the observed neutralities are spread over a larger range (8.7°C) of operative temperatures. demonstrates that the existing standards are unable to predict comfortable temperature for affordable housing residents and there is a need for tailoring the adaptive model to suit the comfort requirements of low-income group. The overestimation of ASHRAE model for the Asian region is supported by Parkinson et al.’s (Parkinson et al., Citation2020) recent study analysing ASHRAE Global Thermal Comfort Database II. The study inferred that the Asian population is better adapted to warmer temperatures and proposed a suitable modification to the ASHRAE adaptive model for Asian region. NBC’s model, which is based on field surveys within Indian office buildings, considers the aggregated effect of thermal sensation across all the climatic zones. Additonally, the representative office population of NBC model might have a difference in the availability of adaptive opportunites, socio-economic constraints and contextual settings than the affordable housing residents, leading to significant differences in comfort perceptions and thus comfort requirements.
Figure 14. Comparison with adaptive comfort standards.
5. Discussion
A longitudinal field study was conducted in low-income affordable housing units during three seasons of Mumbai, India. Two government-provided residential neighbourhoods operating in the free-running mode were investigated yielding 705 sets of thermal comfort data. The major findings drawn from this study are as follows:
Most of the occupants reported comfortable on thermal, humidity and air movement sensation scales. Ninety per cent of TSV were within the comfortable range, while HSV and ASV corresponding to comfortable conditions were 97% and 91%, respectively. Seventeen per cent of occupants experiencing neutral TSV preferred a cooler environment suggesting a natural desire for cooler environments.
Eighty per cent of the participants reported an acceptable environment with a highest acceptability of 95% in the winter season followed by the monsoon and summer season. CA coincided well with 95% neutral HSV and 78% neutral ASV but witnessed partial overlap with 49% neutral TSV indicating the importance of all three variables in determining comfort.
Based on the linear regression analysis, a mean neutral temperature of 28.3°C was found with 80% of occupants voting comfortable within operative temperatures of 24.6–32.2°C. A slope of 0.26°C−1 suggests that affordable housing occupants experience lesser sensitivity to changes in operative temperatures and adapt to a wider range of temperature when compared with other Asian studies. The preferred temperature was observed as 26.3°C indicating that thermal neutrality may not be sufficient for identifying the thermal comfort needs of the occupants.
The effect of income levels on CA votes revealed that as income increases, satisfaction with the thermal environment decreases. This hints towards the altered comfort expectations with higher income levels. The degree of adaptive control was not found to be an influencing factor in psychological adaptation owing to a difference in available and exercised adaptive controls.
Existing comfort standards, ASHRAE and NBC were ineffective in predicting comfort conditions within affordable housing of Mumbai. The standards prescribe a narrow comfort band, while the observed neutralities are spread over a larger range of operative temperatures. Affordable housing occupants were found to be less sensitive to indoor temperatures due to the presence of high thermal adaptation.
The results presented in this paper are applicable to naturally ventilated affordable housing occupied by low-income people in warm–humid climate. The limitation of this study was related to the data collection timings. No surveys were conducted at night time (after 9:00 pm) when the adaptive opportunities such as the opening of doors and windows are not fully exercised due to safety and security concerns.
The findings from this study would aid the development of design guidelines for affordable housing within warm humid climate, thereby providing a better quality of life to the occupants. Housing stock under government policies particularly ‘Housing for All’ and ‘Slum Rehabilitation Scheme’ could be benefited from this study. The present work could be of great interest to the recently launched India Cooling Action Plan (ICAP) by the Ministry of Environment, Forest and Climate Change, Government of India which aims at reducing energy guzzling and providing ‘Comfort to all’ (MoEFCC, Citation2019). ICAP recommends certain thermal comfort strategies based on Energy Conservation Building Code (ECBC) for affordable housing policies under PMAY. However, neither ICAP nor ECBC focus upon the issue of difference in comfort perception and comfort requirements of LIG population. This matter needs to be addressed for effective implementation of ICAP and achieving building sustainability and this study is a step in that direction.
The results from this study would provide a pathway for the development of a new adaptive thermal comfort model for low-income population. Such a model, reflecting the contextual influences of psychological and behavioural factors on thermal adaptation and comfort perceptions, is critical in improving energy performance gap and contributing to sustainable thermal comfort standards. The findings also ascertain the role of income in shaping comfort expectations within resource-constrained affordable units lending support to the economic dimension of comfort. It is important to note that this study does not argue about the premise of the adaptive comfort model but rather emphasizes on the need for an advanced adaptive model considering the altered perception of comfort within low-income communities. Interdisciplinary studies should be carried out to understand the psychosocial factors and comfort affordances of the low-income population.
Apart from the policy implications related to building design and thermal comfort, the study could potentially contribute to the building energy simulation (BES) domain through the estimation of realistic comfort levels and energy use. BES software, in the absence of accurate comfort requirements of LIG occupants, often consider standard comfort models such as ASHRAE or PMV for assessing comfort conditions. This poses a serious concern on the accuracy of input assumptions, i.e. comfort assessment models, which could lead to skewed comfort levels and energy consumption results. Hence, the analysis of actual thermal comfort expectations of occupants is central to the effectiveness of BES, particularly for the special target groups such as low-income population. The comfort thresholds identified through this study should be leveraged for finding accurate comfort conditions and building energy consumption of the future low-income dwellings. Energy consumption for attaining thermal comfort within affordable housing may not seem to be significant in the present times; however, higher disposable incomes and changing lifestyle are expected to change the notion of comfort (Centre for Science and Environment, Citation2014). People in a desire for higher comfort levels are likely to shift towards energy-intensive adaptive actions, thereby consuming higher energy.
6. Conclusion
Indoor thermal comfort plays a substantial role in determining building energy but is often neglected in policies and regulations for energy efficiency. This study provides an understanding of thermal comfort requirement for affordable housing occupants which could aid in sustainability and livability within future affordable housing stock through design guidelines and recommendations. Further, it could also help in reducing the building performance gap, thereby leading to energy efficiency. As Pérez-Fargallo et al. identify comfort as an economic and cultural issue and advocates its articulation through building standards (Pérez-Fargallo et al., Citation2018), this study would serve as a stepping stone in this direction, particularly for the resource-constrained communities of Global South. The results would enable the development of a novel adaptive comfort model for low-income population in view of the socio-cultural and economic dimension of comfort. Future effort should include field studies in different low-income regions to explore the effects of fuel poverty on thermal adaptation and comfort ranges in different contextual and climatic settings.
With the recent unprecedented outbreak of COVID 19, the housing conditions and livability of low-income population have gathered substantial attention, especially in developing cities like Mumbai, Karachi and Manila (Bardhan et al., Citation2018). The city of Mumbai, housing 5.2 million people in slums for the want of affordable housing, is forecasted to register the highest cumulative residential demand growth of 23% in the affordable segment (India Brand Equity Foundation, Citation2010). The post-pandemic period would focus on integrating affordable housing policies with healthy living and ensuring thermal comfort is an important step towards that. Building resilient homes would help the urban poor in reducing vulnerabilities from energy perspective as well (Kumar et al., Citation2018). It is hoped that findings from this study would also be valuable in formulating the housing policies and guidelines for the post-pandemic era.
Acknowledgments
The authors would like to sincerely thank all the participants of the longitudinal survey for providing their valuable responses. This research was funded by the Ministry of Human Resource Development (MHRD), Government of India (GoI) project titled CoE FAST, grant number 14MHRD005 and IRCC-IIT Bombay fund, grant number 16IRCC561015. The research presented in this manuscript is a part of doctoral thesis of Malik J.
Disclosure statement
No potential conflict of interest was reported by the author(s).
Additional information
Funding
References
- American Society of Heating Refrigerating and Air Conditioning Engineers. (2017). ANSI/ASHRAE standard – 55 thermal environmental conditions for human occupancy. Author.
- Bardhan, R., Debnath, R., Jana, A., & Leslie, N. (2018). Investigating the association of healthcare-seeking behavior with the freshness of indoor spaces in low-income tenement housing in Mumbai. Habitat International, 71(January), 156–168. https://doi.org/https://doi.org/10.1016/j.habitatint.2017.12.007
- Bardhan, R., Sarkar, S., Arnab, J., & Velaga, N. (2020). Mumbai slums since independence: Evaluating the policy outcomes. Habitat International, 55(December), 1–11. https://doi.org/https://doi.org/10.1016/j.habitatint.2015.07.009
- Barkenbus, J. (2013). Indoor thermal comfort: The behavioral component. Sustainability, 5(4), 1680–1699. https://doi.org/https://doi.org/10.3390/su5041680
- Bhikhoo, N., Hashemi, A., & Cruickshank, H. (2017). Improving thermal comfort of low-income housing in Thailand through passive design strategies. Sustainability (Switzerland), 9(8), 1–23. https://doi.org/https://doi.org/10.3390/su9081440
- Bureau of Indian Standards. (2016). National building code of India, 2016. Author.
- Cabeza, L. F., Ürge-Vorsatz, D., Palacios, A., Ürge, D., Serrano, S., & Barreneche, C. (2018). Trends in penetration and ownership of household appliances. Renewable and Sustainable Energy Reviews, 82, 4044–4059. https://doi.org/https://doi.org/10.1016/j.rser.2017.10.068
- Centre for Science and Environment. (2014). Energy and buildings. Author.
- Chen, C. f., Xu, X., & Day, J. K. (2017). Thermal comfort or money saving? Exploring intentions to conserve energy among low-income households in the United States. Energy Research and Social Science, 26, 61–71. https://doi.org/https://doi.org/10.1016/j.erss.2017.01.009
- Damiati, S. A., Zaki, S. A., Rijal, H. B., & Wonorahardjo, S. (2016). Field study on adaptive thermal comfort in office buildings in Malaysia, Indonesia, Singapore, and Japan during hot and humid season. Building and Environment, 109, 208–223. https://doi.org/https://doi.org/10.1016/j.buildenv.2016.09.024
- de Dear, R., Brager, G., & Cooper, D. (1997). Developing an adaptive model of thermal comfort and preference-Final Report on RP-884. ASHRAE Transactions, 104(Part 1), 1–18.
- Deuble, M. P., & de Dear, R. J. (2012). Green occupants for green buildings: The missing link? Building and Environment, 56, 21–27. https://doi.org/https://doi.org/10.1016/j.buildenv.2012.02.029
- Emorine, M., Anh, L. H., Lamballe, Y., Oudin, X., & Vass, I. R. D. (2014). Using an Asset Index to analyse Governance in Vietnam (No. 27).
- Földváry Ličina, V., Cheung, T., Zhang, H., de Dear, R., Parkinson, T., Arens, E., Chun, C., Schiavon, S., Luo, M., Brager, G., Li, P., Kaam, S., Adebamowo, M. A., Andamon, M. M., Babich, F., Bouden, C., Bukovianska, H., Candido, C., Cao, B., … Zhou, X. (2018). Development of the ASHRAE Global Thermal Comfort Database II. Building and Environment, 142(June), 502–512. https://doi.org/https://doi.org/10.1016/j.buildenv.2018.06.022
- Han, J., Zhang, G., Zhang, Q., Zhang, J., Liu, J., & Tian, L. (2007). Field study on occupants’ thermal comfort and residential thermal environment in a hot-humid climate of China. Building and Environment, 42(12), 4043–4050. https://doi.org/https://doi.org/10.1016/j.buildenv.2006.06.028
- Hashemi, A. (2017). Effects of thermal insulation on thermal comfort in low-income tropical housing. Energy Procedia, 134, 815–824. https://doi.org/https://doi.org/10.1016/j.egypro.2017.09.535
- Hong, S. H., Gilbertson, J., Oreszczyn, T., Green, G., & Ridley, I. (2009). A field study of thermal comfort in low-income dwellings in England before and after energy efficient refurbishment. Building and Environment, 44(6), 1228–1236. https://doi.org/https://doi.org/10.1016/j.buildenv.2008.09.003
- Humphreys, M. A., & Hancock, M. (2007). Do people like to feel “neutral”?. Exploring the variation of the desired thermal sensation on the ASHRAE scale. Energy and Buildings, 39(7), 867–874. https://doi.org/https://doi.org/10.1016/j.enbuild.2007.02.014
- Humphreys, M., Nicol, J. F., & Raja, I. A. (2007). Field studies of indoor thermal comfort and the progress of the adaptive approach. Advances in Building Energy Research, 1(1), 55–88. https://doi.org/https://doi.org/10.1080/17512549.2007.9687269
- Humphreys, M., Nicol, J. F., & Roaf, S. (2016). Adaptive thermal comfort: Foundations and analysis (1st ed). Routledge.
- Ibrahim, S. H., Baharun, A., Mohd Nawi, M. N., & Junaidi, E. (2014). Analytical studies on levels of thermal comfort in typical low-income houses design. Journal of Civil Engineering, Science and Technology, 5(1), 28–33. https://doi.org/https://doi.org/10.33736/jcest.130.2014
- India Brand Equity Foundation. (2010). Affordable housing in India: Budding, expanding, compelling. Author.
- Indraganti, M. (2010). Using the adaptive model of thermal comfort for obtaining indoor neutral temperature: Findings from a field study in Hyderabad, India. Building and Environment, 45(3), 519–536. https://doi.org/https://doi.org/10.1016/j.buildenv.2009.07.006
- Indraganti, M. (2011). Thermal comfort in apartments in India: Adaptive use of environmental controls and hindrances. Renewable Energy, 36(4), 1182–1189. https://doi.org/https://doi.org/10.1016/j.renene.2010.10.002
- Indraganti, M., & Boussaa, D. (2017). Comfort temperature and occupant adaptive behavior in offices in Qatar during summer. Energy and Buildings, 150, 23–36. https://doi.org/https://doi.org/10.1016/j.enbuild.2017.05.063
- Indraganti, M., Ooka, R., & Rijal, H. B. (2015). Thermal comfort in offices in India: Behavioral adaptation and the effect of age and gender. Energy and Buildings, 103(September), 284–295. https://doi.org/https://doi.org/10.1016/j.enbuild.2015.05.042
- Indraganti, M., Ooka, R., Rijal, H. B., & Brager, G. S. (2014). Adaptive model of thermal comfort for offices in hot and humid climates of India. Building and Environment, 74, 39–53. https://doi.org/https://doi.org/10.1016/j.buildenv.2014.01.002
- Indraganti, M., & Rao, K. D. (2010). Effect of age, gender, economic group and tenure on thermal comfort: A field study in residential buildings in hot and dry climate with seasonal variations. Energy and Buildings, 42(3), 273–281. https://doi.org/https://doi.org/10.1016/j.enbuild.2009.09.003
- International Organization for Standardization. (2004). ISO 8996:2004 Ergonomics of the thermal environment – Determination of metabolic rate. BSI.
- Jindal, A. (2018). Thermal comfort study in naturally ventilated school classrooms in composite climate of India. Building and Environment, 142, 34–46. https://doi.org/https://doi.org/10.1016/j.buildenv.2018.05.051
- Kalz, D. E., & Pfafferott, J. (2014). Thermal comfort and energy-efficient cooling of non residential buildings. Springer. https://doi.org/https://doi.org/10.1007/978-3-319-04582-5
- KPMG. (2012). Bridging the urban housing shortage in India foreword from KPMG in India (pp. 1–16). Author.
- Kshetrimayum, B., Bardhan, R., & Kubota, T. (2020). Factors affecting residential satisfaction in slum rehabilitation housing in Mumbai. Sustainability, 12(6), 2344. https://doi.org/https://doi.org/10.3390/su12062344
- Kumar, S., Singh, M., Chandiwala, S., Sneha, S., & George, G. (2018). Mainstreaming thermal comfort for all and resource efficiency in affordable housing. Alliance for Energy Efficient Economy.
- Kumar, S., Singh, M. K., Loftness, V., Mathur, J., & Mathur, S. (2016). Thermal comfort assessment and characteristics of occupant’s behaviour in naturally ventilated buildings in composite climate of India. Energy for Sustainable Development, 33, 108–121. https://doi.org/https://doi.org/10.1016/j.esd.2016.06.002
- Malik, J., & Bardhan, R. (2020a). Energy target pinch analysis for optimising thermal comfort in low-income dwellings. Journal of Building Engineering, 28, 101045. https://doi.org/https://doi.org/10.1016/j.jobe.2019.101045
- Malik, J., & Bardhan, R. (2020b). Thermal comfort in affordable housing of mumbai, India. In Alliance for an Energy Efficient Economy (AEEE) (Ed.), Energise-energy innovation for a sustainbale economy (pp. 66–74). Alliance for an Energy Efficient Economy.
- Malik, J., Bardhan, R., & Banerji, P. (2020a). Rethinking indoor thermal comfort in the era of rebound & pre-bound effect for the developing world: A systematic review. Indoor Air, 30(3)), 377–395. https://doi.org/https://doi.org/10.1111/INA.12664
- Malik, J., Bardhan, R., Hong, T., Piette, M. A., & Ann, M. (2020b). Contextualising adaptive comfort behaviour within low-income housing of Mumbai, India. Building and Environment, 177(April), 106877. https://doi.org/https://doi.org/10.1016/j.buildenv.2020.106877
- Manu, S., Shukla, Y., Rawal, R., Thomas, L. E., de Dear, R., Dave, M., & Vakharia, M. (2014, December 16). Assessment of air velocity preferences and satisfaction for naturally ventilated office buildings in India. PLEA 2014: 30th conference on passive and low energy architecture, 12, Ahmedabad, India. https://doi.org/https://doi.org/10.13140/RG.2.1.3059.9768
- M.C.G.M. (2011). Mumbai DRMMP. Author.
- Mehrotra, S., Bardhan, R., & Ramamritham, K. (2018). Urban informal housing and surface Urban Heat Island intensity: Exploring spatial association in the city of Mumbai. 1–20. https://doi.org/https://doi.org/10.1177/0975425318783548
- Ministry of Housing & Urban Poverty Alleviation Government of India. (2015). Pradhan Mantri Awas Yojana – Housing for all (urban) – scheme guidelines 2015. 1–62.
- MoEFCC. (2019). India cooling action plan.
- Moore, T., Ridley, I., Strengers, Y., Maller, C., & Horne, R. (2017). Dwelling performance and adaptive summer comfort in low-income Australian households. Building Research and Information, 45(4), 443–456. https://doi.org/https://doi.org/10.1080/09613218.2016.1139906
- Mustapa, M. S., Zaki, S. A., Rijal, H. B., Hagishima, A., & Ali, M. S. M. (2016). Thermal comfort and occupant adaptive behaviour in Japanese university buildings with free running and cooling mode offices during summer. Building and Environment, 105, 332–342. https://doi.org/https://doi.org/10.1016/j.buildenv.2016.06.014
- Nguyen, A. T., Singh, M. K., & Reiter, S. (2012). An adaptive thermal comfort model for hot humid South-East Asia. Building and Environment, 56, 291–300. https://doi.org/https://doi.org/10.1016/j.buildenv.2012.03.021
- Nicol, F. (2004). Adaptive thermal comfort standards in the hot-humid tropics. Energy and Buildings, 36(7), 628–637. https://doi.org/https://doi.org/10.1016/j.enbuild.2004.01.016
- Nicol, J. F., & Humphreys, M. A. (2002). Adaptive thermal comfort and sustainable thermal standards for buildings. Energy and Buildings, 34(6), 563–572. https://doi.org/https://doi.org/10.1016/S0378-7788(02)00006-3
- Oluwafeyikemi, A., & Julie, G. (2015). Evaluating the impact of vertical greening systems on thermal comfort in low income residences in Lagos, Nigeria. Procedia Engineering, 118, 420–433. https://doi.org/https://doi.org/10.1016/j.proeng.2015.08.443
- Parkinson, T., de Dear, R., & Brager, G. (2020). Nudging the adaptive thermal comfort model. Energy and Buildings, 206, 109559. https://doi.org/https://doi.org/10.1016/j.enbuild.2019.109559
- Pérez-Fargallo, A., Pulido-Arcas, J. A., Rubio-Bellido, C., Trebilcock, M., Piderit, B., & Attia, S. (2018). Development of a new adaptive comfort model for low income housing in the central-south of Chile. Energy and Buildings, 178, 94–106. https://doi.org/https://doi.org/10.1016/j.enbuild.2018.08.030
- Pignatta, G., Chatzinikola, C., Artopoulos, G., Papanicolas, C. N., & Serghides, D. K. (2017). Analysis of the indoor thermal quality in low income Cypriot households during winter. Energy and Buildings, 152, 766–775. https://doi.org/https://doi.org/10.1016/j.enbuild.2016.11.006
- Po, J. Y. T., Finlay, J. E., Brewster, M. B., & Canning, D. (2012). Estimating household permanent income from ownership of physical assets (No. 97).
- Rajasekar, E., & Ramachandraiah, A. (2010, April 9–11). Adaptive comfort and thermal expectations – a subjective evaluation in hot humid climate. Proceedings of conference: Adapting to change: New thinking on comfort, Windsor, UK. London: Network for Comfort and Energy Use in Buildings. http://nceub.org.uk
- RBI. (2018, January). Affordable housing in India, RBI bulletin (13–25). https://rbidocs.rbi.org.in/rdocs/Bulletin/PDFs/AFFORDABLE609D506CB8C247DAB526C40DAF461881.PDF
- Rijal, H. B., Yoshida, H., & Umemiya, N. (2010). Seasonal and regional differences in neutral temperatures in Nepalese traditional vernacular houses. Building and Environment, 45(12), 2743–2753. https://doi.org/https://doi.org/10.1016/j.buildenv.2010.06.002
- Sakellaris, I., Saraga, D., Mandin, C., de Kluizenaar, Y., Fossati, S., Spinazzè, A., Cattaneo, A., Szigeti, T., Mihucz, V., de Oliveira Fernandes, E., Kalimeri, K., Carrer, P., & Bartzis, J. (2019). Personal control of the indoor environment in offices: Relations with building characteristics, influence on occupant perception and reported symptoms related to the building-the officair project. Applied Sciences (Switzerland), 9(16), 3227. https://doi.org/https://doi.org/10.3390/app9163227
- Santamouris, M., Alevizos, S. M., Aslanoglou, L., Mantzios, D., Milonas, P., Sarelli, I., Karatasoub, S., Cartalis, K., & Paravantis, J. A. (2014). Freezing the poor – indoor environmental quality in low and very low income households during the winter period in Athens. Energy and Buildings, 70, 61–70. https://doi.org/https://doi.org/10.1016/j.enbuild.2013.11.074
- Sharma, M. R., & Ali, S. (1986). Tropical summer index – a study of thermal comfort of Indian subjects. Building and Environment, 21(1), 11–24. https://doi.org/https://doi.org/10.1016/0360-1323(86)90004-1
- Singh, M. K., Mahapatra, S., & Atreya, S. K. (2011). Adaptive thermal comfort model for different climatic zones of North-East India. Applied Energy, 88(7), 2420–2428. https://doi.org/https://doi.org/10.1016/j.apenergy.2011.01.019
- Singh, M. K., Ooka, R., Rijal, H. B., & Takasu, M. (2017). Adaptive thermal comfort in the offices of North-East India in autumn season. Building and Environment, 124, 14–30. https://doi.org/https://doi.org/10.1016/j.buildenv.2017.07.037
- Soebarto, V., & Bennetts, H. (2014). Thermal comfort and occupant responses during summer in a low to middle income housing development in South Australia. Building and Environment, 75, 19–29. https://doi.org/https://doi.org/10.1016/j.buildenv.2014.01.013
- Sunikka-Blank, M., Bardhan, R., & Haque, A. N. (2019). Gender, domestic energy and design of inclusive low-income habitats: A case of slum rehabilitation housing in Mumbai, India. Energy Research and Social Science, 49(October 2018), 53–67. https://doi.org/https://doi.org/10.1016/j.erss.2018.10.020
- Testo AG, & Germany. (2018). Testo 480 Meter.
- Tinker, J. A., Ibrahim, S. H., & Ghisi, E. (2004, October, 1–10). An evaluation of thermal comfort in typical modern low-income housing in Malaysia. Ashrae. https://web.ornl.gov/sci/buildings/conf-archive/2004%20B9%20papers/161_Tinker.pdf
- Toe, D. H. C., & Kubota, T. (2013). Development of an adaptive thermal comfort equation for naturally ventilated buildings in hot-humid climates using ASHRAE RP-884 database. Frontiers of Architectural Research, 2(3), 278–291. https://doi.org/https://doi.org/10.1016/j.foar.2013.06.003
- TWC Product and Technology LLC 2014, 2021. (2019). Weather undeground. https://www.wunderground.com/
- Zhang, Y., Wang, J., Chen, H., Zhang, J., & Meng, Q. (2010). Thermal comfort in naturally ventilated buildings in hot-humid area of China. Building and Environment, 45(11), 2562–2570. https://doi.org/https://doi.org/10.1016/j.buildenv.2010.05.024
Appendix: Floor plans