
 ?Mathematical formulae have been encoded as MathML and are displayed in this HTML version using MathJax in order to improve their display. Uncheck the box to turn MathJax off. This feature requires Javascript. Click on a formula to zoom.
ABSTRACT
Patient warming is an efficient approach to preventing hypothermia during surgeries. Hypothermia increases the risk of postoperative infections, bleeding, transfusion demand, prolonging postoperative recovery, drug metabolism duration and vasoconstriction. Although the use of warming blankets addresses the problem of a decrease in a patient’s core body temperature, concern remains that the heat emitted by these warming blankets can disturb the supplied clean air by the ventilation system and thus increase the contamination level of airborne particles.
The main purpose of this study is to numerically investigate the impact of using warming blankets on the performance of two common ventilation systems – unidirectional flow and mixing ventilation – in an operating room. The effect of using forced-air and conductive warming blankets on the distribution of bacteria-carrying particles and airflow behaviour were simulated in the operating room. The results showed that applying the forced-air warming blanket considerably increased the average air temperature at the wound area and under the surgical drape. Thus, the forced-air warming blanket can be more effective than the conductive blankets in warming the patient during the surgery. However, using the contaminated forced-air warming blanket resulted in a considerable increase in the contamination concentration at the wound surface.
Nomenclature
Abbreviations
| BCP | = | bacteria-carrying particle |
| CFD | = | computational fluid dynamics |
| CFU | = | colony-forming unit |
| DPM | = | discrete phase model |
| DRW | = | discrete random walk |
| FAW | = | Forced-air warming |
| LPT | = | Lagrangian particle tracking |
| OR | = | operating room |
| PSI-C | = | particle source in-cell |
| UDF | = | Unidirectional airflow |
| SIMPLE | = | |
| SSI | = | surgical site infection |
Latin letters
| = | additional forces per unit particle mass (m/s2) | |
| = | drag factor (s−1) | |
| g | = | gravitational acceleration (m/s2) |
| = | turbulent kinetic energy (m/s2) | |
| = | source term | |
| = | time (s) | |
| = | fluid velocity (m/s) | |
| = | particle velocity (m/s) | |
| = | velocity (m/s) | |
| = | non-dimensional wall distance |
Greek letters
| = | diffusion coefficient | |
| = | turbulence dissipation rate (m2/s3) | |
| = | fluid density (kg/m3) | |
| = | particle density (kg/m3) | |
| = | transported quantity |
1. Introduction
Controlling and reducing contaminant level in operating rooms (ORs) is crucial for preventing postoperative infections and reducing surgical patients’ mortality rate (Gundtoft et al., Citation2017). One of the main causes of surgical site infections (SSIs) is bacteria-carrying particles (BCPs), which include microbial laden dust, skin fragments, lint and respiratory droplets (Albrecht, Gauthier, & Leaper, Citation2009). Surgical team members are the main sources of contamination in the surgical zone as they shed skin scales in the OR environment. A healthy person may release up to 104 particles per minute, although only about 5–10% of these fragments are contaminated with microorganisms (Hambraeus, Citation1988; Memarzadeh, Citation2003). These particles have various sizes, ranging from 5 µm to 60 µm, with an average size of 12 µm (Noble, Citation1975; Noble et al., Citation1963). The BCPs can increase the infection risk through two main mechanisms: pathogenic contaminants can directly result in wound contamination; non-pathogenic contaminates can ease the pathogen attachment to the wound (Mangram et al., Citation2000).
Ventilation systems are the main tools used today in the ORs to dilute and remove contamination from the surgical patient zone. Various strategies have been implemented to design and improve the performance of ventilation systems. Among all ventilation airflow patterns and strategies, fully mixed and laminar airflow regimes are commonly used in OR. The mixing concept reduces the airborne particle concentration through rapid dilution. Unidirectional Flow (UDF) ventilation moderates the contamination concentration by providing an extensive volume of clean airflow from the diffusers toward the operating table. UDF systems have been considered as a strategy to prevent SSIs since the 1960s, although the use of these systems is costly than mixing system(Kolokotsa et al., Citation2012; Sadrizadeh, Holmberg, & Tammelin, Citation2014a).
Since UDF systems ventilate a high volume of cold air to the surgical area, they can increase the risk of patient hypothermia in the OR equipped with UDF (Yang et al., Citation2015). The patient's core body temperature decreases during the major surgery, which can lead to increased risk of bleeding, transfusion demand, postoperative recovery, drug metabolism duration, and vasoconstriction (Leslie et al., Citation1995; Rajagopalan et al., Citation2008; Sessler et al., Citation2011). Hypothermia may occur during a given surgery due to low operating room temperature if the patient body core temperature drops 2˚C below normal. Under such conditions, the patient’s body heat loss is more than its heat production (Monteiro et al., Citation2018). Vasoconstriction, one of the consequences of hypothermia, results in reducing oxygen partial pressure in tissues and increases the risk of infections.
The patient warming method is commonly applied for preventing hypothermia and thus reducing the risk of infections (Sessler et al., Citation2011). The double-blind study by Kurz et al. (Kurz et al., Citation1996) showed that 2 ˚C reductions in core body temperature of a patient could triple the wound infection risks and increase the hospitalization rate by 20%. Moreover, upper body warming systems have been reported to be more efficient than underbody warming systems in the prevention of hypothermia in patients during endovascular surgeries (Monteiro et al., Citation2018).
The two most common forms of patient warming systems are forced-air and conductive heating blankets (Dasari et al., Citation2012). The forced-air warming (FAW) blanket delivers warm airflow through the blanket pores, which face the patient’s body. The conductive warming blanket maintains the patient’s body temperature through a heated pad covering the body. Both approaches are effective in preventing hypothermia; however, it has been reported that using the FAW blanket results in a considerable air temperature increase above the patient compared with the conductive warming blanket (Dasari et al., Citation2012).
Since warming blankets were introduced to ORs, several studies have sought to discover whether there is a relationship between the risk of postoperative infections and the warming therapy. Zink et al. (Zink & Iaizzo, Citation1993) investigated the impact of using the FAW blanket on wound contamination among eight healthy male volunteers during a three-week experiment. The results showed no increase in the risk of infections among the surgical patients upon proper implementation of such blankets. Huang et al. (Huang et al., Citation2003) studied 16 patients during abdominal aortic surgery and took air samples while the FAW blanket was used for the upper body. The researchers concluded that the FAW blanket did not increase the wound and graft infections as no colony-forming unit (CFU) was found either at the wound area or at the forced-air hose. Conversely, various clinical studies have reported increases in contamination levels during the application of FAW blankets (Kellam et al., Citation2013; Kümin et al., Citation2019; Memarzadeh, Citation2010; Moretti et al., Citation2009; Sessler et al., Citation2011; Tumia & Ashcroft, Citation2002). However, these rises were far below the recommended maximum of 10 CFU/m3 (Friberg et al., Citation1999).
While several studies have shown that FAW blankets limit significantly the risk of hypothermia in patients without increasing SSIs, the presence of pathogenic organisms was reported in the hoses of these warming devices (Avidan et al., Citation1997; Baker et al., Citation2002; Bernards et al., Citation2004). In order to prevent the suspended BCPs from penetrating the warming devices, a microbial filter with 0.2 µm pore size is implemented in the FAW device. Albrecht et al. (Albrecht et al., Citation2009) took samples from 25 FAW devices during surgeries. The sampling results showed 89% of the warming devices had bacterial contamination on their hose surfaces. Moreover, 32% of the devices had a reduction in the filtration efficiency of the BCPs with the size of 0.5–5 µm. Overall, microbes were detected on air path surfaces of 94% of the warming blankets. Baker et al. (Citation2002) also reported heavy contamination levels at the exterior and interior of the FAW blanket. Consequently, the implemented filters and distal end of the hose can also be a source of contamination in the operating room (Bernards et al., Citation2004).
The emitted heat from warming blankets can raise the average temperature of the air above the patient, which might disrupt the clean airflow supplied by the ventilation systems and cause an increase in the contamination level at the open-wound area during the surgery (Sadrizadeh, Tammelin, Ekolind, & Holmberg, Citation2014b). McGovern et al. (Citation2011) studied experimentally the effect of using warming blankets on the airflow behaviour around the patient in an OR equipped with the UDF ventilation system. The airflow pattern was visualized through buoyant detergent bubbles above the patient. The bubble count results revealed that the FAW blanket made the under-drape airflow pass the surgery drape and enter the surgical site, while this phenomenon did not occur with the conductive warming blanket. Moreover, a higher incidence of SSI was reported for patients who had hip and knee replacement surgeries with the FAW blankets compared to conductive blankets. The experimental results of Legg et al. (Citation2012) also confirmed that applying the FAW blanket can considerably increase the air temperature and the concentration of BCPs at the surgical area. Furthermore, a clinical study on the infection risks due to warming of 1437 patients by the FAW blanket showed a remarkable rise in periprosthetic joint infections (Wood et al., Citation2014).
Almost all of the aforementioned studies have been accomplished experimentally, either through a field or laboratory measurement in operating rooms that having complete control on boundary conditions and background factors is challenging. However, it is also possible to investigate the effect of warming blankets by using numerical calculations, such as the computational fluid dynamics (CFD) technique. CFD requires less cost and time to model complicated case studies, have access to all parameters of interest and avoids having to deal with ethical issues, as in studies including patients. Various numerical studies have been conducted to evaluate the impact of disruptive factors such as staff behaviour and heat loads on the performance of ventilation systems in the ORs during the surgeries (Memarzadeh & Manning, Citation2002; Mousavi & Grosskopf, Citation2020; Sadrizadeh et al., 2014; Sadrizadeh & Holmberg, Citation2014; Wang et al., Citation2018). He et al. (He et al., Citation2018) modelled the FAW blanket in an OR equipped by UDF ventilation. Their numerical results demonstrated that the rising thermal plumes from the warming blanket affected both the airflow behaviour and concentration of BCPs. Conversely, the numerical results obtained by Memarzadeh (2010) showed that the FAW blankets had no significant impact on the increase of SSIs.
To the authors’ best knowledge, a few numerical research studies have investigated warming blankets, and some clinical works had contradictory results with other clinical studies. Thus, it remains undecided whether using such blankets is a safe approach for the patient. Therefore, the main objective of the present study is to investigate the impact of applying warming blankets on the performance of UDF and mixing ventilation systems in the ORs. In this regard, the CFD technique was used to model both airflow behaviour and the distribution of BCPs. In the coming sections, the physical models are represented and the numerical models were validated by comparing the results of an experimental study with the numerical results.
2. Methodology
2.1. Case description
The impact of the patient-warming blankets on the airflow field and distribution of particles was investigated numerically in an OR with dimensions of 8.5 m long, 7.7 m wide and 3.2 m high that is a replica of an operating room in a hospital in Stockholm, Sweden. The configuration of the simulated OR is shown in . The OR was equipped once with a UDF ventilation system ((a)) and once with mixing ventilation ((b)).
Figure 1. Configuration of the simulated OR: (a) UDF ventilation system (b) mixing ventilation system
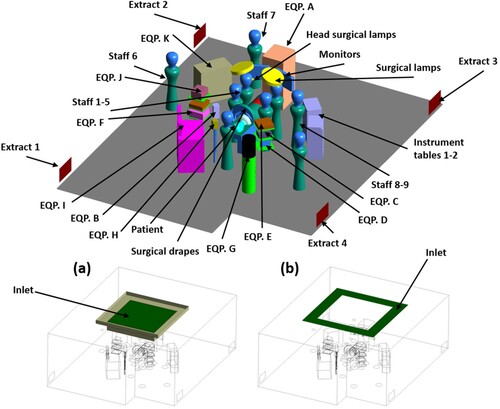
The ceiling diffuser of the UDF ventilation had a dimension of 2.8 m × 2.8 m and the clean air was supplied with the air change rate of 70 h−1 and temperature of 20 ˚C. The partial walls were used to fortify the unidirectional airflow, supplied by the UDF ventilation (Wang et al., Citation2018). The air was ventilated with an air change rate of 42 h−1 and temperature of 20 ˚C through the diffusers of the mixing ventilation. These diffusers were located above the operating table and had an overall area of 8.64 m2 ((b)). Four low-level extraction grills were installed on the two opposite walls.
In order to consider thermal plumes and BCPs release from the surgical staff, nine mannequins were located in the OR. The constant heat flux of 150 W/m2 from the head and 50 W/m2 from the rest of the body were assumed for each surgical staff (Holmer & Nilsson, Citation1995; Oguro, Citation1997). Surgical clothing can reduce the BCPs release from the surgical team bodies to an acceptable level. Therefore, a source strength of 4 CFU/s from the head and neck part was adopted for each mannequin (Sadrizadeh, et al., 2014b; SIS-TS Citation39:Citation2015, n.d.). Moreover, the heat generation and BCPs release from the patient was also considered in all simulations, the same values as surgical staff. The particle release from the patient was applied in the current study since the FAW blanket blew air to the patient body that might affect the contamination risks. The BCPs had a spherical shape, with a diameter of 12 µm and 1000 kg/m3 density (Sadeghian et al., Citation2020; Sadrizadeh et al., Citation2016).
In order to simulate a real case condition, the list of required medical devices containing heat loads, dimensions and models required for an orthopaedic surgery was provided by Danderyd Hospital, Stockholm, Sweden. The details of the medical devices’ specifications are listed in .
Table 1. Details of the simulated medical devices’ specifications
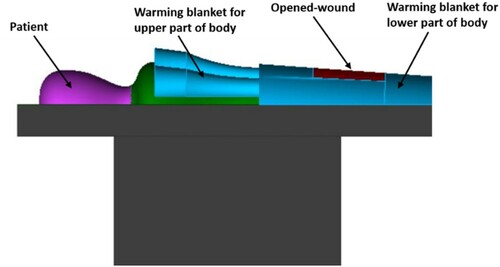
An operating table was exactly positioned below the inlet diffuser in the centre of the OR, with dimensions of 2.0 m long, 0.52 m wide and 0.89 m high. On one side of the operating table were two instrument tables, with a size of 0.6 m × 0.4 m × 1.0 m. Surgical drapes that covered the patient during the surgery were also considered. Moreover, it was assumed that the surgery was on the lower part of the patient’s body, as shown in . Warming blankets of both types (forced-air and conductive warming) have different designs and sizes. The current study used a model that covered both the upper and lower part of the patient’s body (). Both warming blankets had the same physical geometry. The specifications of both types of warming blankets are detailed in . Warming blanket 1, the FAW blanket, blows airflow with a temperature of 43 ˚C through the surface that faced the patient’s body. However, warming blanket 2, the conductive-warming blanket, increased the temperature of the patient’s body by maintaining a temperature of 43 ˚C at all surfaces. In order to model the contaminated FAW blanket, the concentration of the BCPs at the equipment table located on the left side of the operating table was used.
Figure 2. Isometric view of the patient covering with the warming blanket
2.2. Numerical models
2.2.1. Fluid flow modelling
The Reynolds-Averaged Navier-Stokes approach was adopted for modelling the steady-state airflow field in the OR. In order to predict the turbulent behaviour of indoor airflow, the two-equation Realizable k-ϵ turbulence model was used, which has better performance than the Standard k-ϵ turbulence model (Van Maele & Merci, Citation2006). This turbulence model developed by Shih et al. (Shih et al., Citation1994) applies different equations for both the eddy viscosity and turbulent dissipation rate that results in the realizability of the model. Previous research has shown that the Realizable k-ϵ model can accurately simulate the airflow (Maele & Merci, 2006; Zhang et al., Citation2007), in addition to requiring less computational time than the RNG k-ϵ model because it deals with the swirl effect on turbulence. The governing equations of mass, momentum and energy were solved for modelling the airflow behaviour in the OR that can be expressed as
(1)
(1) Where
is the transport quantity,
represents the air velocity vector,
is the air density that is considered an incompressible idea gas,
is the effective diffusivity and
is the source term.
All of the simulations were performed using the commercial software ANSYS Fluent 19.2. The discretization method for the convection terms was second-order upwind; moreover, the pressure and velocity were coupled by applying the SIMPLE algorithm. The convergence criteria were 1×10⁻⁶ for the root-mean-square residuals of all the solved equations. To guarantee the convergence, the value of the pre-specified variables was tracked at six selected points. The turbulent airflow properties at the boundary layer were treated by using the Enhanced Wall Treatment (Chen & Patel, Citation1988). The no-slip boundary condition was assigned for simulating velocity at all solid walls. A constant heat flux boundary condition was used for simulating the emitted heat from all the surfaces releasing heat, including the medical devices, surgical staff and patient. All OR walls had the adiabatic wall condition.
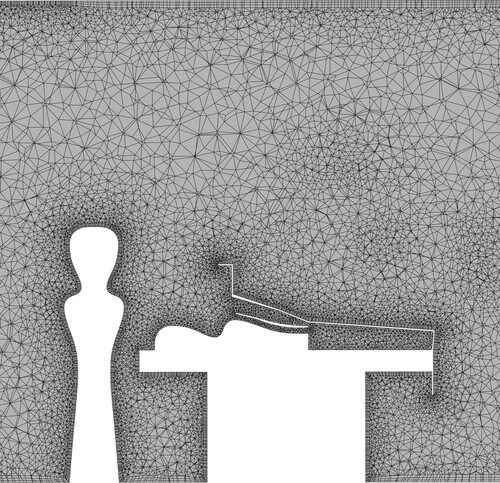
ICEM CFD was used to subdivide the computational domain into approximately six million unstructured tetrahedral cells. The local grid refinement was performed near the walls and areas with high velocity and temperature gradients, as a result the y+ below 5 was obtained. Moreover, a three-inflation boundary layer were used for the walls. The final applied mesh model is presented at a cut plan passing the centre of the OR in .
Figure 3. Applied mesh model for the simulations
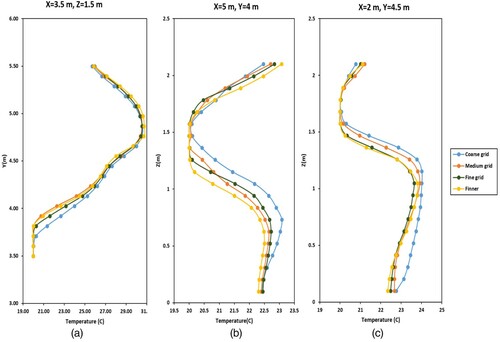
The four following grid resolutions were considered for the grid independence study: coarse (3.57 million), medium (6 million), fine (9.4 million) and finer (11.5 million). The values of the temperature and velocity were compared at 100 points in the OR for coarse, medium, fine and finer grid resolutions. shows the temperature values at different location in the room, including above the operating table ((a)) for all grid resolutions. Since there were no considerable differences between medium, fine and finer grid resolutions in the prediction of airflow behaviour in the OR, the medium one was used to reduce the computational time.
Figure 4. Comparison between temperature values of coarse, medium, fine and finer grid resolutions at (a) X = 3.5 m, Y = 1.5 m (above the operating table); (b) X = 5 m, Y = 4 m and (c) X = 2 m, Y = 4.5 m
2.2.2. Particle tracking model
In order to model the particle transport in the indoor environment, the Lagrangian particle tracking (LPT) and Eulerian-Eulerian modelling methods are widely used. Recent research studies have reported that the LPT method has the potential to predict the pollutant distribution more accurately than the Eulerian-Eulerian modelling (Loomans & Lemaire, Citation2002; Zhang & Chen, Citation2006). Here, the LPT method was employed, where the trajectory of the particle is calculated by integrating the below equation:
![]()
The left-hand side of Equation 2 shows the inertial force acting on the unit mass of a particle, where ρp presents a particle density and ρ is the fluid density. ![]() is the drag force, and the second term on the right-hand side of Eq. 2 represents the buoyant force.
is the drag force, and the second term on the right-hand side of Eq. 2 represents the buoyant force. ![]() stands for all additional forces (per unit mass), including Saffman’s lift force, pressure gradient, virtual mass and the Basset history. In the current study, the Basset history, virtual mass and the pressure gradient are insignificant compared with the drag force (Mchugh et al., Citation2014; Whitcomb & Clapper, Citation1966). Although the value of the Saffman’s lift force is about two orders of magnitude smaller than the drag force in the current application (Zhang & Chen, Citation2006), the magnitude of this force might become considerable in the turbulent boundary layer (Li & Ahmadi, Citation1992) and influence the deposition process (McLaughlin, Citation1989; Rizk & Elghobashi, Citation1985). Therefore, we adopted Saffman’s lift force.
stands for all additional forces (per unit mass), including Saffman’s lift force, pressure gradient, virtual mass and the Basset history. In the current study, the Basset history, virtual mass and the pressure gradient are insignificant compared with the drag force (Mchugh et al., Citation2014; Whitcomb & Clapper, Citation1966). Although the value of the Saffman’s lift force is about two orders of magnitude smaller than the drag force in the current application (Zhang & Chen, Citation2006), the magnitude of this force might become considerable in the turbulent boundary layer (Li & Ahmadi, Citation1992) and influence the deposition process (McLaughlin, Citation1989; Rizk & Elghobashi, Citation1985). Therefore, we adopted Saffman’s lift force.
The discrete random walk (DRW) model was used to simulate the turbulent dispersion of particles. This model assumes that velocity fluctuations follow a Gaussian probability distribution. The stochastic nature of turbulent velocity fluctuations and particle dispersion caused remarkable uncertainty in the prediction of the concentration. Consequently, an adequate number of trajectories are required in order to obtain statistically reliable results (Zhang & Chen, Citation2006). Performing a sensitivity test showed that the results became stable at 4 × 10⁶ trajectories. The one-way coupling was used for considering the interaction between the particles and fluid flow due to low particle concentration. Thus, the particle injection was performed after reaching a converged steady-state airflow field. The transient particle tracking model in Fluent was adopted for the simulations with time step of 0.001s.
The ‘escape’ boundary condition was adopted for the OR exhaust vents that the particles escaped from the domain and the trajectories finished. The ‘trapped’ boundary condition was used for rigid surfaces since particles usually cannot accumulate enough energy to overcome the surface adhesion and rebound from the object (Hinds, Citation1982). The particle source in-cell method was applied for converting particle trajectories to the particle number concentration (Zhang & Chen, Citation2006). The passive air sampling method (the surface concentration of particles - BCP/m2.h) was extracted from the simulated results to investigate the contamination level in the OR.
3. Validation of CFD model
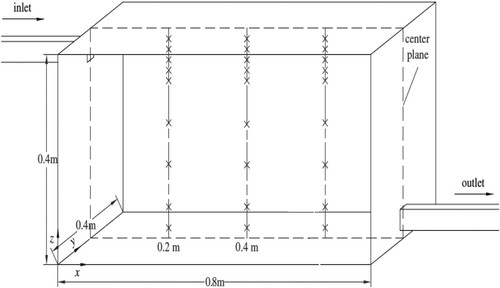
In this study, the experimental results by Chen et al. (Citation2006) were used to validate the numerical models for both airflow and particle tracking. The same mesh generation method was used for both validation case and OR model. Since controlling boundary conditions in on-site or full-scale lab works is very difficult, we used high-quality experimental data measured in a controlled environment to validate our CFD simulations. This experimental work reported the particle distribution and deposition in a room with the size of 0.8 m wide, 0.4 m long and 0.4 m high, as shown in . Both the inlet and extract vent had the same dimensions of 0.04 m × 0.04 m and were located symmetrically with the centre plane. The supplied air velocity was 0.225 m/s. The tested particles’ diameter was 10 µm with a density of 1400 kg/m3. The particle distribution and airflow velocity were measured at three different locations in the room. Moreover, the particle concentrations were normalized with inlet concentration; therefore, the value of the inlet concentration of the particles was 1.
Figure 5. Schematic of the experimental study for the validation of the numerical models (Chen et al., Citation2006)
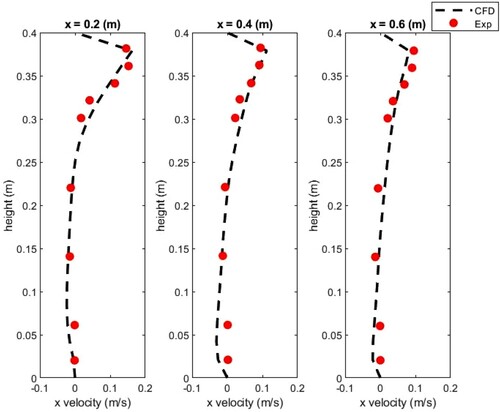
The simulated x-direction velocity of the airflow was compared with the experimental results as presented in . The simulated results of the velocity agreed well with the measurement data () that shows the present toll capture accurately the physics of interest.
Figure 6. Comparison of the simulated and experimental x-direction velocity
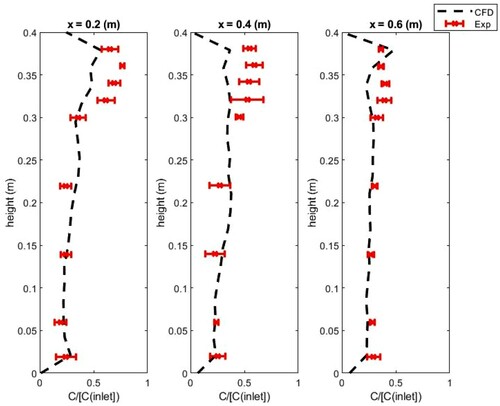
shows the comparison of the simulated and measurement normalized particle concentration at three different locations in the room. The Lagrangian DRW model showed good agreement with the experimental results, except at points close to the ceiling; this deviation was below 15%. This level of departure for particle concentration is common (Zhao et al., Citation2008). This relates to the uncertainty regarding the boundary conditions (Thermal boundary conditions, variation in inlet flowrate and leakage to the room) during the measurement. Therefore, we considered that the present simulation strategy is adequate for investigating the operative effect of the blanket during the surgery.
Figure 7. Comparison of the simulated and experimental normalized particle concentration
4. Results
Four different cases were simulated to investigate the impact of using warming blankets on the performance of both mixing and UDF ventilation systems. The first case simulated the OR without using the warming blanket; the second one modelled the conductive warming blanket; in the third one, the FAW blanket was used; and the fourth case considered the FAW blanket that blew contaminated air (see ). Moreover, the results of a case study that excludes local heat loads (for example, surgical headlamps, monitors and the warming blanket) were not presented here since the airflow behaviour and particle distribution showed insignificant differences with the case without the warming blanket.
Table 2. The boundary condition of the warming blanket in all simulated cases
4.1. Mixing ventilation system
4.1.1. Forced-air warming blanket
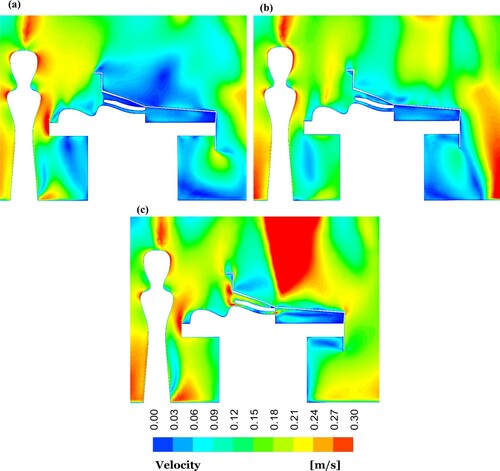
The distribution of the airflow velocity at a cut plane passing the centre of the OR equipped by the mixing ventilation system is presented in for different cases. Since the FAW blanket blew air to the patient, the maximum average velocity of 0.2 m/s was obtained below the surgical drape, where the patient was located. In the case without the warming blanket, by contrast, the velocity was almost zero ((a)).
Figure 8. Velocity contour plots at centre-plane of the OR equipped with mixing ventilation for the cases: (a) without the warming blanket; (b) with the conductive warming blanket; and (c) with the FAW blanket
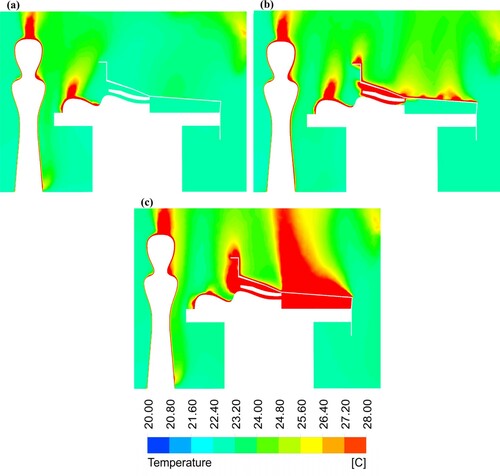
shows the temperature contour plots at the centre of the OR using a mixing ventilation system for all simulated cases. Using the FAW blanket, the third case resulted in a 7.4 ˚C increase in the temperature close to the open wound ((c)). Moreover, the airflow reached to a maximum temperature of 43 ˚C below the surgical drape in the third case, although the air temperature was 22.6 ˚C in the first case ((a)).
Figure 9. Temperature contour plots at the centre-plane of the OR equipped with mixing ventilation for the cases: (a) without a warming blanket; (b) with the conductive warming blanket; and (c) with the FAW blanket
The surface concentration of the BCPs is displayed in for all the simulated cases in the OR using a mixing ventilation system during one hour at three different locations, wound surface and top surfaces of both instrument tables. In the case with the FAW blanket, the concentration of BCPs reduced to 26 BCP/m2.h at the wound surface, which was a considerable reduction compared with the case without the blanket. Previous research studies (Avidan et al., Citation1997; Baker et al., Citation2002; Bernards et al., Citation2004) reported a considerable level of contamination inside the FAW device, so a contaminated FAW blanket was also considered. The particle tracking simulations demonstrated that using the contaminated FAW blanket resulted in 55 BCP/m2.h at the wound surface.
Figure 10. Surface BCPs concentration [BCP/m2.h] in the OR equipped with the mixing ventilation
![Figure 10. Surface BCPs concentration [BCP/m2.h] in the OR equipped with the mixing ventilation](/cms/asset/d0242ce7-0cbd-479f-b9ab-31c8470ad89b/taer_a_2009911_f0010_oc.jpg)
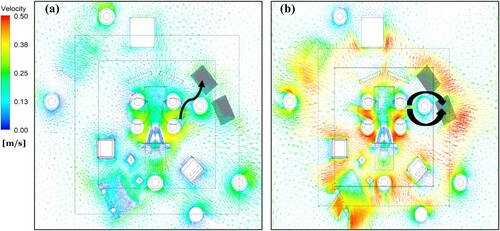
Using the FAW blanket reduced the concentration of BCPs from 390 particle/m2.h (second case) to 240 particle/m2.h (third case) at the upper surface of the instrument (see ). The contamination level at both instrument tables showed a considerable increase at instrument . As presented in (a), the direction of the velocity vectors was mainly from the operating table toward the instrument . This flow direction may justify a higher concentration of BCPs on this instrument table.
Figure 11. The velocity vector contour plots at Z = 1.1 m for the case using the FAW blanket equipped with (a) mixing and (b) UDF ventilation system
4.1.2. Conductive warming blanket
Analysing the airflow behaviour above the patient in the OR using mixing ventilation showed that the conductive blanket ((b)) had no significant impact on the airflow field in comparison with the case with FAW blanket ((c)). In the OR using the mixing ventilation system, the conductive blanket increased the average air temperature under the surgical drape by about 4 ˚C. The average air temperature above the wound was 24 ˚C for the second scenario, while it was 22.6 ˚C for the first case, as shown in . Comparing BCPs concentration for the case applying the conductive blanket with the case without blanket demonstrated that using this blanket reduced the BCPs level from 46 (first case) to 34 BCP/m2.h (second case).
4.2. UDF ventilation system
4.2.1. Forced-air warming blanket
In the third case, in which the FAW blanket was used, the airflow behaviour above the patient showed an upward flow compared to the case without a warming blanket in the OR equipped with a UDF ventilation system, as demonstrated in .
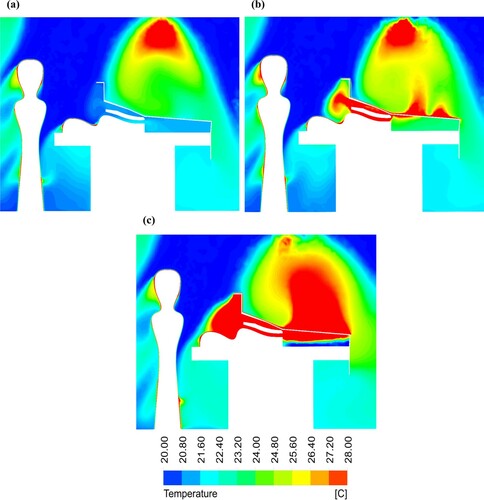
The air average temperature of 22 ˚C was obtained for the case without a blanket ((a)). However, this value was about 27˚C adjacent to the wound, as displayed in (c) when the FAW blanket was used. The airflow temperature reached a maximum value of 43 ˚C below the surgical drape for the third case (FAW blanket), while for the first case (without blanket) the obtained temperature was 21.6 ˚C.
The BCP level in the OR using the UDF ventilation system was computed for different cases as presented in . Using the contaminated FAW blanket increased the BCPs concentration by about 50% at the wound area compared with the non-contaminated case. The BCPs levels were 115 and 947 BCP/m2.h at instrument and , respectively, in the third case. (b) shows that the airflow direction was mainly from the staff around the operating table to the instrument , which might cause a considerable increase in the contamination level. Moreover, this instrument table was not located below the UDF ventilation diffusers, affecting the contamination level.
Figure 14. Surface BCP concentration [BCP/m2.h] in the OR equipped with UDF ventilation
![Figure 14. Surface BCP concentration [BCP/m2.h] in the OR equipped with UDF ventilation](/cms/asset/14bb9699-5feb-43df-a46f-98978705787a/taer_a_2009911_f0014_oc.jpg)
4.2.2. Conductive warming blanket
The velocity contour plots in demonstrate that the conductive warming blanket had an insignificant disruption effect on the airflow patterns at an open wound in the OR equipped with UDF ventilation. The air temperature adjacent to the wound area was 23.3 ˚C in the conductive blanket case and 22˚C for the case without the blanket, as shown in . Thus, using a conductive blanket had an insignificant impact on the air average temperature above the patient. In the second case, the concentration of BCPs at the wound area was almost at the same level as the case with the FAW blanket. However, the contamination level increased by approximately 70% at the surgical site in the case with the contaminated FAW blanket compared with the conductive one.
Figure 12. Velocity contour plots at the centre-plane of the OR equipped with UDF ventilation for the cases: (a) without a warming blanket; (b) with the conductive warming blanket; (c) with the FAW blanket
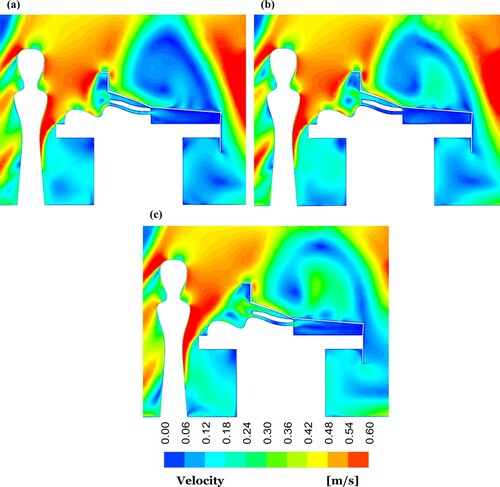
Figure 13. Temperature contour plots at the centre-plane of the OR equipped with UDF ventilation for the cases: (a) without a warming blanket; (b) with the conductive warming blanket; (c) with the FAW blanket
5. Discussion
The FAW blanket significantly increased the air average temperature under the surgical drape compared with a conductive blanket in both ORs equipped by mixing and UDF ventilation. This increase indicated that using a FAW blanket can be more efficient in warming the patient and preventing hypothermia. The presence of a FAW blanket resulted in a 33% and 23% increase in the air average temperature above the wound area in the OR using mixing and UDF ventilation, respectively. However, using a conductive blanket showed a rise in the air average temperature of about 5.5% with UDF and 1.4% for the mixing ventilation in the OR. It is interesting to note that the results obtained for the air temperature distribution were in agreement with the previous experimental work accomplished by Legg et al. (Citation2012). Consequently, using the FAW blanket had a considerable influence on increasing the air temperature both over the surgical site and under the surgical drape comparison with a conductive blanket.
The BCP distribution results demonstrated that using the FAW warming blanket reduced the contamination level at the wound area compared to the case without the blanket. The upward convective flow created by heat emitted from this warming blanket might reduce the BCP level at the wound area. Consequently, using FAW warming blankets had no significant impact on increasing contamination at the wound area; these results follow those of previous experimental works(Huang et al., Citation2003; Moretti et al., Citation2009; Sessler et al., Citation2011).
Since contamination has been reported on the exterior and interior of FAW devices (Avidan et al., Citation1997; Baker et al., Citation2002; Bernards et al., Citation2004), the present study investigated the impact of using the contaminated FAW blanket on the contamination level. The simulated results of the FAW blanket that blew contaminated air resulted in 50% and 100% increases in the BCP level at the wound area in the ORs equipped by UDF and mixing ventilation, respectively. Our results confirmed a high risk of BCP level if a FAW blanket hose was contaminated. Thus, a bacteria sampling from the internal part of this device is recommended before use during surgery. The advantages and disadvantages of both FAW and conductive warming blankets are compared in , based on the obtained results in the current work and previous studies.
Table 3. The comparison of advantages and disadvantages of both warming blankets
Comparison of the BCP level at both instrument tables in all simulated cases showed a considerable difference due to various airflow patterns around these tables. Accordingly, locating the instrument tables in the proper places is indispensable since SSIs may occur through the surgical instrument being contaminated by a few pathogenic organisms.
6. Conclusion
This paper studied the influence of using warming blankets on the airflow behaviour and distribution of BCPs in the OR under both mixing and UDF ventilations. The simulated results for the cases using FAW and conductive blankets were compared with the case without the blanket. Moreover, the impact of using the FAW blanket that blew the contaminated air with pathogenic particles was investigated.
Using warming blankets raised the air average temperature, both adjacent to the wound area and below the surgical drape where the patient was located. However, the FAW blanket showed a considerable increase in the air average temperature at those areas compared with the conductive blanket in the OR for both ventilation systems. In the case with the FAW blanket, the BCP level was reduced at the wound area, which might result from an upward convective flow generated by the emitted heat by the blanket. However, using a contaminated FAW blanket resulted in a considerable increase in the concentration of BCPs in the wound area. Consequently, the FAW blanket can increase the infection risks if the FAW hose is contaminated; therefore, hose bacteria sampling is recommended. There is a need for further research to confirm the optimal temperature and airflow rate of the FAW device.
Acknowledgement
This research study was financially supported by the Swedish Research Council Formas (2017- 01088). The calculations were made using resources provided by the Swedish National Infrastructure for Computing (SNIC) at PDC (funded by the Swedish Research Council (2018-05973)).
Disclosure statement
No potential competing interest was reported by the authors.
Additional information
Funding
References
- Albrecht, M., Gauthier, R., & Leaper, D. (2009). Forced-air warming: A source of airborne contamination in the operating room? Orthopedic Reviews, 1(1), 1–28. https://doi.org/10.4081/or.2009.e28
- Avidan, M. S., Jones, N., Ing, R., Khoosal, M., Lundgren, C., & Morrell, D. F. (1997). Convection warmers - Not just hot air. Anaesthesia, 52(11), 1073–1076. https://doi.org/10.1111/j.1365-2044.1997.250-az0384.x
- Baker, N., King, D., & Smith, E. G. (2002). Infection control hazards of intraoperative forced air warming [6]. Journal of Hospital Infection, 51(2), 153–154. https://doi.org/10.1053/jhin.2002.1226
- Bernards, A. T., Harinck, H. I. J., Dijkshoorn, L., van der Reijden, T. J. K., & van den Broek, P. J. (2004). Persistent acinetobacter baumannii? Look Inside Your Medical Equipment. Infection Control & Hospital Epidemiology, 25(11), 1002–1004. https://doi.org/10.1086/502335
- Chen, F., Yu, S. C. M., & Lai, A. C. K. (2006). Modeling particle distribution and deposition in indoor environments with a new drift-flux model. Atmospheric Environment, 40(2), 357–367. https://doi.org/10.1016/j.atmosenv.2005.09.044
- Chen, H. C., & Patel, V. C. (1988). Near-wall turbulence models for complex flows including separation. AIAA Journal, 26(6), 641–648. https://doi.org/10.2514/3.9948
- Dasari, K. B., Albrecht, M., & Harper, M. (2012). Effect of forced-air warming on the performance of operating theatre laminar flow ventilation. Anaesthesia, 67(3), 244–249. https://doi.org/10.1111/j.1365-2044.2011.06983.x
- Friberg, B., Friberg, S., & Burman, L. G. (1999). Inconsistent correlation between aerobic bacterial surface and air counts in operating rooms with ultra clean laminar air flows : proposal of a new bacteriological standard for surface contamination. Journal of Hospital Infection, 42(March), 287–293. https://doi.org/10.1053/jhin.1998.0598
- Gundtoft, P. H., Pedersen, A. B., Varnum, C., & Overgaard, S. (2017). Increased mortality after prosthetic Joint infection in primary THA. Clinical Orthopaedics and Related Research, 475(11), 2623–2631. https://doi.org/10.1007/s11999-017-5289-6
- Hambraeus, A. (1988). Aerobiology in the operating room—a review. Journal of Hospital Infection, 11(Supplement A), 68–76. https://doi.org/10.1016/0195-6701(88)90169-7
- He, X., Karra, S., Pakseresht, P., Apte, S. V., & Elghobashi, S. (2018). Effect of heated-air blanket on the dispersion of squames in an operating room. International Journal for Numerical Methods in Biomedical Engineering, 34(5), 1–24. https://doi.org/10.1002/cnm.2960
- Hinds, W. C. (1982). Aerosol technology: properties, behaviour, and measurement of airborne particles.
- Holmer, I., & Nilsson, H. (1995). Heated manikins as a tool for evaluating clothing. The Annals of Occupational Hygiene, 39(6), 809–818. https://doi.org/10.1016/0003-4878(95)00041-0
- Huang, J. K. C., Shah, E. F., Vinodkumar, N., Hegarty, M. A., & Greatorex, R. A. (2003). The Bair Hugger patient warming system in prolonged vascular surgery: An infection risk? Critical Care (London, England), 7(3), R13–R16. https://doi.org/10.1186/cc1888
- Kellam, M. D., Dieckmann, L. S., & Austin, P. N. (2013). Forced-Air warming devices and the risk ofSurgical site infections. Association of Registered Nurses, 98(4), 353–369. https://doi.org/10.1016/j.aorn.2013.08.001
- Kolokotsa, D., Tsoutsos, T., & Papantoniou, S. (2012). Energy conservation techniques for hospital buildings. Advances in Building Energy Research, 6(1), 159–172. https://doi.org/10.1080/17512549.2012.672007
- Kurz, A., Sessler, D. I., & Lenhardt, R. (1996). Perioperative normothermia to reduce the incidence of surgical-wound infection and shorten hospitalization. New England Journal of Medicine, 334(19), 1209–1215. https://doi.org/10.1056/NEJM199605093341901
- Kümin, M., Deery, J., Turney, S., Price, C., Vinayakam, P., Smith, A., Filippa, A., Wilkinson-Guy, L., Moore, F., O’Sullivan, M., Dunbar, M., Gaylard, J., Newman, J., Harper, C. M., Minney, D., Parkin, C., Mew, L., Pearce, O., Third, K., … Scarborough, M. (2019). Reducing implant infection in Orthopaedics (RIIiO): results of a pilot study comparing the influence of forced air and resistive fabric warming technologies on postoperative infections following orthopaedic implant surgery. Journal of Hospital Infection, 103(4), 412–419. https://doi.org/10.1016/j.jhin.2019.08.019
- Legg, A. J., Cannon, T., & Hamer, A. J. (2012). Do forced air patient-warming devices disrupt unidirectional downward airflow? Journal of Bone and Joint Surgery - Series B, 94 B(2), 254–256. https://doi.org/10.1302/0301-620X.94B2.27562
- Leslie, K., Sessler, D. I., Bjorksten, A. R., & Moayeri, A. (1995). Mild hypothermia alters propofol pharmacokinetics and increases the duration of action of atracurium. Anesthesia and Analgesia, 80(5), 1007–1014. https://doi.org/10.1213/00000539-199505000-00027
- Li, A., & Ahmadi, G. (1992). Dispersion and deposition of spherical particles from point sources in a turbulent channel flow. Aerosol Science and Technology, 16(4), 209–226. https://doi.org/10.1080/02786829208959550
- Loomans, M., & Lemaire, T. (2002). Particle concentration calculations using CFD. Modelling Techniques, 5, 153–156.
- Mangram, A. J., Horan, T. C., Pearson, M. L., Silver, L. C., & William, R. (2000). Guideline for prevention of surgical site infection. Bulletin of the American College of Surgeons, 85(7), 23–29.
- McGovern, P. D., Albrecht, M., Belani, K. G., Nachtsheim, C., Partington, P. F., Carluke, I., & Reed, M. R. (2011). Forced-air warming and ultra-clean ventilation do not mix: An investigation of theatre ventilation, patient warming and joint replacement infection in orthopaedics. Journal of Bone and Joint Surgery - Series B, 93 B(11), 1537–1544. https://doi.org/10.1302/0301-620X.93B11.27124
- Mchugh, S. M., Hill, A. D. K., & Humphreys, H. (2014). Laminar airflow and the prevention of surgical site infection. More harm than good ? The Surgeon, Journal of the Royal Colleges of Surgeons of Edinburgh and Ireland, 13(1), 52–58. https://doi.org/10.1016/j.surge.2014.10.003
- McLaughlin, J. B. (1989). Aerosol particle deposition in numerically simulated channel flow. Physics of Fluids A, 1(7), 1211–1224. https://doi.org/10.1063/1.857344
- Memarzadeh, F. (2010). Active warming systems to maintain perioperative normothermia in hip replacement surgery. Journal of Hospital Infection, 75(4), 332–333. https://doi.org/10.1016/j.jhin.2010.02.006
- Memarzadeh, F. (2003). Reducing Risk of Surgery. February.
- Memarzadeh, F., & Manning, A. P. (2002). Comparison of operating room ventilation systems in the protection of the surgical site. ASHRAE Transactions, 108(PART 2), 3–15.
- Monteiro, F. L. J., Halpern, H., Bortoli, F., Kataoka, L., Marumo, C., Ribeiro, M., Castellassi, M., Mendes, C., & Wolosker, N. (2018). Forced-Air warming in patients undergoing endovascular procedures: Comparison between 2 thermal blanket models. Annals of Vascular Surgery, 47(September 2017), 98–103. https://doi.org/10.1016/j.avsg.2017.08.001
- Moretti, B., Larocca, A. M. V., Napoli, C., Martinelli, D., Paolillo, L., Cassano, M., Notarnicola, A., Moretti, L., & Pesce, V. (2009). Active warming systems to maintain perioperative normothermia in hip replacement surgery: A therapeutic aid or a vector of infection? Journal of Hospital Infection, 73(1), 58–63. https://doi.org/10.1016/j.jhin.2009.06.006
- Mousavi, E. S., & Grosskopf, K. R. (2020). Renovation in hospitals: A case study of source control ventilation in work zones. Advances in Building Energy Research, 14(1), 115–128. https://doi.org/10.1080/17512549.2018.1502683
- Noble, W. C. (1975). Dispersal of skin microorganisms. British Journal of Dermatology, 93(4), 477–485. https://doi.org/10.1111/j.1365-2133.1975.tb06527.x
- Noble, W. C., Lidwell, O. M., & Kingston, D. (1963). The size distribution of airborne particles carrying microorganisms. Journal of Hygiene, 61(4), 385–391. https://doi.org/10.1017/S0022172400020994
- Oguro, M. (1997). Convective and radiative heat transfer coefficients for individual human body segments. International Journal of Biometeorology, 40(3), 141–156. https://doi.org/10.1007/s004840050035
- Rajagopalan, S., Mascha, E., Na, J., & Sessler, D. I. (2008). The effects of mild perioperative hypothermia on blood loss and transfusion requirement. Anesthesiology, 108(1), 71–77. https://doi.org/10.1097/01.anes.0000296719.73450.52
- Rizk, M. A., & Elghobashi, S. E. (1985). The motion of a spherical particle suspended in a turbulent flow near a plane wall. Physics of Fluids, 28(3), 806–817. https://doi.org/10.1063/1.865048
- Sadeghian, P., Wang, C., Duwig, C., & Sadrizadeh, S. (2020). Impact of surgical lamp design on the risk of surgical site infections in operating rooms with mixing and unidirectional airflow ventilation: A numerical study. Journal of Building Engineering, 31(April), 101423. https://doi.org/10.1016/j.jobe.2020.101423
- Sadrizadeh, S., Afshari, A., Karimipanah, T., Håkansson, U., & Nielsen, P. V. (2016). Numerical simulation of the impact of surgeon posture on airborne particle distribution in a turbulent mixing operating theatre. Building and Environment, 110, 140–147. https://doi.org/10.1016/j.buildenv.2016.10.005
- Sadrizadeh, S., & Holmberg, S. (2014). Surgical clothing systems in laminarairflow operating room: A numerical assessment. Journal of Infection and Public Health, 7(6), 508–516. https://doi.org/10.1016/j.jiph.2014.07.011
- Sadrizadeh, S., Holmberg, S., & Tammelin, A. (2014a). A numerical investigation of vertical and horizontal laminar airflow ventilation in an operating room. Building and Environment, 82, 517–525. https://doi.org/10.1016/j.buildenv.2014.09.013
- Sadrizadeh, S., Tammelin, A., Ekolind, P., & Holmberg, S. (2014b). Influence of staff number and internal constellation on surgical site infection in an operating room. Particuology, 13(1), 42–51. https://doi.org/10.1016/j.partic.2013.10.006
- Sessler, D. I., Olmsted, R. N., & Kuelpmann, R. (2011). Forced-air warming does not worsen air quality in laminar flow operating rooms. Anesthesia and Analgesia, 113(6), 1416–1421. https://doi.org/10.1213/ANE.0b013e318230b3cc
- Shih, T., Liou, W., Shabbir, A., Yang, Z., & Zhu, J. (1994). A New k-e Eddy Viscosity Model for High Reynolds Number Turbulent Flows-Model Development and Validation. NASA Technical Memorandum.
- SIS-TS 39:2015. (n.d.). Microbiological cleanliness in the operating room - Preventing airborne contamination - Guidance and fundamental requirements. 143444, 2015.
- Tumia, N., & Ashcroft, G. P. (2002). Convection warmers - A possible source of contamination in laminar airflow operating theatres? Journal of Hospital Infection, 52(3), 171–174. https://doi.org/10.1053/jhin.2002.1297
- Van Maele, K., & Merci, B. (2006). Application of two buoyancy-modified k-ϵ turbulence models to different types of buoyant plumes. Fire Safety Journal, 41(2), 122–138. https://doi.org/10.1016/j.firesaf.2005.11.003
- Wang, C., Holmberg, S., & Sadrizadeh, S. (2018). Numerical study of temperature-controlled airflow in comparison with turbulent mixing and laminar airflow for operating room ventilation. Building and Environment, 144(June), 45–56. https://doi.org/10.1016/j.buildenv.2018.08.010
- Whitcomb, J. G., & Clapper, W. E. (1966). Ultraclean operating room. The American Journal of Surgery, 112(5), 681–685. https://doi.org/10.1016/0002-9610(66)90104-8
- Wood, A. M., Moss, C., Keenan, A., Reed, M. R., & Leaper, D. J. (2014). Infection control hazards associated with the use of forced-air warming in operating theatres. Journal of Hospital Infection, 88(3), 132–140. https://doi.org/10.1016/j.jhin.2014.07.010
- Yang, L., Huang, C. Y., Zhou, Z., Bin, W., Zhang, Z. S., Liu, G. R., & Huang, K. X., & Q, W. (2015). Risk factors for hypothermia in patients under general anesthesia: Is there a drawback of laminar airflow operating rooms? A prospective cohort study. International Journal of Surgery, 21, 14–17. https://doi.org/10.1016/j.ijsu.2015.06.079
- Zhang, Z., & Chen, Q. (2006). Experimental measurements and numerical simulations of particle transport and distribution in ventilated rooms. Journal of Atmospheric Environment, 40(18), 3396–3408. https://doi.org/10.1016/j.atmosenv.2006.01.014
- Zhang, Z., Zhang, W., Zhai, Z. J., & Chen, Q. Y. (2007). Evaluation of various turbulence models in predicting airflow and turbulence in enclosed environments by CFD: Part 2—comparison with experimental data from literature. HVAC and R Research, 13(6), 871–886. https://doi.org/10.1080/10789669.2007.10391460
- Zhao, B., Yang, C., Yang, X., & Liu, S. (2008). Particle dispersion and deposition in ventilated rooms: Testing and evaluation of different Eulerian and Lagrangian models. Building and Environment, 43(4), 388–397. https://doi.org/10.1016/j.buildenv.2007.01.005
- Zink, R. S., & Iaizzo, P. A. (1993). Convective warming therapy does not increase the risk of wound contamination in the operating room. Anesthesia and Analgesia, 76(1), 50–53. https://doi.org/10.1213/00000539-199301000-00009