
Abstract
Visualization is an important tool for teaching abstract subjects such as mathematics and for processing and expressing thoughts, also in art. Blind individuals cannot obtain information from two-dimensional visualizations, but they can touch structured surfaces with their fingers. To aid visually impaired students in creating and reading tangible, 3D printable visualizations, we have developed a generator that produces three-dimensional reliefs of images through techniques used by artists to make artwork more tangible. Our research includes interviews with visually impaired individuals to uncover new approaches and improve our touchable 3D visualizations. Additionally, we asked over 30 pre-service mathematics teachers through an open questionnaire whether 3D printing offers educational benefits for students to find potential connections between 3D printing and STEM education. Our findings hint towards opportunities for STEM education for both visually impaired and non-impaired students.
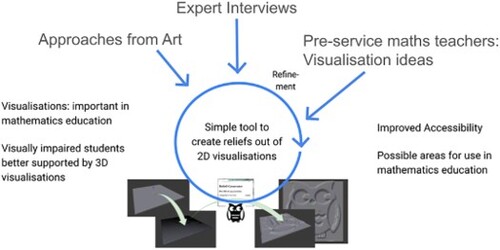
GRAPHICAL ABSTRACT
Introduction
The Swiss mathematician Leonhard Euler, who lost his eyesight during his career, remained highly active and productive. Despite his vision loss, he continued to work on algebra and is said to have dictated his work to an assistant to test its comprehensibility and accuracy. Today, visualizations play a critical role in mathematics education and have a long-standing tradition of communicating mathematical concepts. This is especially important as mathematics is built around virtual thought models and ideas, and students need a way to validate their accurate understanding of these concepts, while teachers need to be able to assess student comprehension. Visualizations can take many forms, such as graphs, visual proofs, and symbols that can be very simple but might also be complex. Blind students are unable to perceive visualizations through their eyesight and visually impaired students may struggle with depth perception or distinguishing contrasts in visualizations (Lamoureux et al., Citation2010). Explaining complex visualizations orally in particular might be a challenge and could lead to misconceptions. In such cases, a more tangible representation of the information could be beneficial and it is possible that tangible visualizations might also hold value for students without visual impairments. We therefore wonder about how tangible visualizations can be modified or adapted to benefit visually impaired individuals, how creating such visualizations can be supported technologically and whether non-impaired students could also profit from self-created 3D visualizations by using 3D printing (3DP) and collecting opinions from visually impaired people.
Studies show that 3D representations can increase blind students’ motivation to learn STEM subjects (Skawinski et al., Citation1994). To support people with visual impairments, some projects aim to bring art and science closer to them. For instance, Garber (Citation2019) highlighted that 3D printed models can attract visually impaired audiences to visit museums by adapting artworks based on blind peoples’ needs (Garber, Citation2019) and could serve as an opportunity to teach science as well. For example, if we consider the visualizations of the algebraic structures known as groups offered in Campbell (Citation2017), then, instead of using colours to denote different elements in a given group, one could instead associate physical objects such as sculptures of different heights, so as to allow a ‘haptic’ way of experiencing the structure of a group, without visualization. This article explores similar ideas, using tangible ways of communicating mathematical ideas to blind people. Some geometrical objects might best be visualized in 3D such as hyperbolic honeycombs by Nelson and Segerman (Citation2017) that correspond with Schläfli-symbols and therefore, such visualizations hold value for both visually impaired and non-blind students. Other visualizations need to be altered and slightly changed in their encoding of information for that.
As many mathematical visualizations are complex, we apply concepts from artists to make paintings or drawings more tangible. Technologies such as text messengers or social media are more and more used between students or teachers and sometimes, visualizations with high complexity are sent. Approaches used in art, which often visualizes complex forms in artwork using a large variety of colours, can be used to balance complexity and simplification. Many representations of mathematics in artwork throughout history visualize not only mathematical concepts but also transport information on how mathematics was perceived at this point in time giving an additional cultural context. Artists often had to understand the world around them and often crossed the line to science or mathematics, geometric figures are widely used in Islamic cultures, artists such as Kandinsky and Mondrian used mathematical concepts as part of their art (Coolidge, Citation1963; Dalfó et al., Citation2021; Kattchee, Citation2013; Özdural, Citation2000). Some approaches to make such paintings semi-3D by 3D printing are used in our context.
State of the art
To learn about how issues of visualizations for mathematics can be addressed, we first look at literature indicating attributes of traditional 2D visualizations and steps from 2D to 3D representations. We then present approaches by artists related to creating more tangible representations, also going from 2D to 3D representations, to draw from their ideas later.
Mathematical visualizations in 3D
Duval (Citation1998) explains that, for example, geometrical reasoning consists of three cognitive processes: the construction process of creating a visualization using tools, leading to the visualization process of for example a geometrical statement or a situation in 2D or 3D, and the reasoning process explaining a visualization. Each creating, visualizing, and reasoning process can be performed separately by a student while still being connected to and being dependent on the other two steps. In educational settings, these processes should be developed separately - visualization processes and reasoning processes should be differentiated in the curriculum which would lead to coordination of the processes (Duval, Citation1998).
As described by Gutiérrez (Citation1996), textbooks usually use plane representations in a perspectivist projection but due to the rise of visualization software, students would be able to see visualizations in different positions and thus would be able to create and enhance dynamic mental images. Gutiérrez (Citation1996) argues that geometrical object visualizations on screens, rendered by algorithms, might be useful for students as they would need to slowly and controlled manipulate such rendered images. Nakamura (Citation2021) looked at Kleinian groups and thus hyperbolic geometry in an artistic way rendering them iteratively in 3D using software. This strengthens the idea that geometry in particular provides a wide field of visualizations and this in particular could help students understand the concept of infinity, iteration, and irrational numbers.
However, such visualizations are still two-dimensional as they appear on a screen and thus are not tangible. For visually impaired students, two-dimensional visualizations are usually of little use as they have trouble perceiving them so visualizations need to be turned three-dimensional. They would have to be created as objects in the real world or at least the image on screen would have to be tangible to be accessible for blind students. Osinga and Krauskopf (Citation2007) attempted to visualize the Lorentz Manifold by crochet stitches and simulating the behaviour with actual crocheted objects. This would be more tangible for blind students but without guidance from teachers, the students might be prone to misconceptions from incorrectly handling the crocheted piece. Vectors and matrices can be also visualized in 2D and, of course, in 3D (Campbell, Citation2020; Griffith, Citation2021) and many 3D models consist entirely of triangles pointing in a direction by a vector. Such 3D models can also be 3D printed and made accessible for visually impaired and blind students.
Artistic approaches from 2D to 3D
Creating three-dimensional versions of two-dimensional art is an idea that was addressed by several artists and scientists, usually in a fully manual or semi-automatic way. Volpe and colleagues (Citation2014) argue that tactile exploration creates a mental image of visualization by first getting an overview and then finding details. Some museums provide tangible representations of two-dimensional artwork often created out of clay or bronze but seldomly using technologies requiring artists for the process and therefore limit the number of tangible visualizations and each process takes a long time (Volpe et al., Citation2014). For example, the artist Martina Singer reproduced a picture of an artwork that was created in 1566 by the older Pieter Brueghel named the Census at Bethlehem. This new version contains a three-dimensional scene and allows museum visitors to experience it (Praske, Citation2019). To add one more dimension, the scenery needed to be adjusted by Martina Singer. She needed to model clay and had to leave out details due to the information density and it took a long time to complete.
Semi-automatic support can reduce the time for creating such a 3D model. For example, the Minolta technique describes paper with an imprint derived from many details creating a so-called tactile diagram which is often used with a verbal narration (Volpe et al., Citation2014). The American Foundation for the Blind (AFB, Citationn.d.) provides guidelines about how images should be turned into tactile visualizations: 3D visualizations should have simple outlines, clear shapes, and thick lines should emphasize objects closest to the viewer. They should not be over complex and if needed, divided into more than one diagram and while complex parts might be enlarged.
This resembles the approaches of the artist and researcher Lichtenegger (Citation2019). Taking inspiration from Impressionist painters, she developed a technique to create light paintings by combining the traditional oil technique with mathematical strategies and the latest technology focusing on creating 3D printable versions. Lichtenegger produces a translucent plane that is backlighted, varies its thickness and contains many different layers. The approach to create such ‘lithophane’ panels was used in the early 1800s using different kinds of materials. In the past decade, there has been interest in using the 3DP technology to create similar effects and construct a model with several layers (Lithophane, Citation2019; Yuan and Bourell, Citation2014). Lichtenegger used one of many freely available tools (see Lithophane, Citation2019) to produce a file that can be 3D printed. However, visually impaired or blind people cannot sufficiently experience these light paintings without seeing the light that is shining through the material. Nevertheless, these three-dimensional portraits that are shaped in layers of variable thickness can offer an interesting further starting point for creating works for visually impaired people. Although the online tool Lithophane (Citation2019) is not complex, it does not provide an optimized UI interface and does not always create printable files. This shows the obstacle for visually impaired and blind users to create their own touchable portraits because they do not have easy access to software transforming visual data into 3D printable models in a short amount of time.
This could be an opportunity for STEM classroom activities to learn the complexity of visualization and the science behind the 3DP process. Creating models with students in classrooms could nurture their knowledge of technology and science as well as make them more compassionate to blind students. Furthermore, involving blind students in the process could contribute to educational sensibility and develop knowledge in the scientific process of visualization and the particularities of 3DP and the used techniques. Some research, however, concludes that 3D printers can be perceived as complicated to apply and can require a lot of technical knowledge which is the reason why this technology is still rarely used as a production method for objects in the field of education for blind people (Jafri & Ali, Citation2015). This might hinder blind students from creating tangible visualizations.
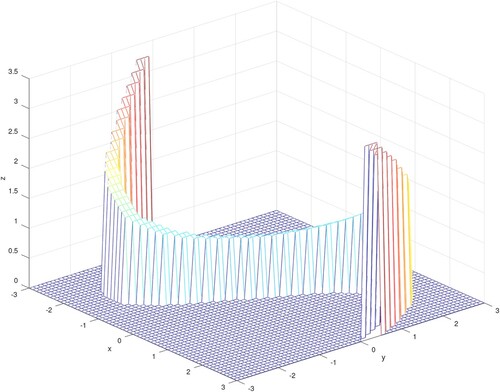
Not only for blind students can a tool creating 3D visualization out of 2D images be of value in terms of teaching subjects such as mathematics. For example, a drawn function could be turned into touchable reliefs which could help all students to more appropriately understand aspects of maths by perceiving the function with multiple senses, enriched with additional context information. A function’s gradient can be drawn in a different shade of grey or colours, the image then can be processed by a relief generator and rising functions could be embossed while falling parts of functions could be imprinted providing an additional information channel as seen in Figure . This can add additional information on other perceivable attributes such as volume or pitch of a soundwave.
Figure 1. Showing the rise and fall depending on colour.
Methodology
We collected data following a qualitative approach for a broad view of this topic. After creating a technological solution taking into account the guidelines of the American Foundation for the Blind (AFB, Citationn.d.), we asked experts for opinions and remarks. We conducted interviews to investigate blind peoples’ ideas about 3D printed models as visualizations in general. For that, we needed the opinions of experts on the needs of visually impaired people with education exceeding primary who also have experience working with technology. Our case study included two participants, one male and one female for a broad view, from the Council of the blind of Montenegro. Both people were blind without any light perception and studied at the Law faculty at the University of Montenegro. Andy, 28 is employed as a lawyer while Sonja is 26 years old and is employed as an administration officer. We decided to gather data with interviews because open interviews are an appropriate method for obtaining first impressions not limiting responses and oral data collection was chosen due to their disability (Rubin & Rubin, Citation1995). Also, we focused on the general usability of 3D printed visualizations for the visually impaired first and later looked into possible concepts for mathematics. Apart from general information about their education, sex, age and occupation, the questions consisted of 5 open questions. Each interview was conducted individually asking (i) whether they had experience with the tactile sensual perception of 3D models, (ii) about which requirements a useful 3D model should fulfil, (iii) in which areas 3D printed models could be used by blind people to learn, (iv) what their opinion was on photos turned to 3D models, and (v) what their thoughts were about using 3DP in the education of blind students.
To learn in which mathematical areas such visualization approaches could be applied and whether this could be also useful for students without visual impairment, we then asked 33 Austrian pre-service mathematics teachers after a 3DP beginners course to write down answers to open-ended questions of which three asked about possible benefits, one directed at possible general improvements maths lessons, one asking about benefits for students and another question about benefits for teachers. These questions and the codebook derived from 20 leading questions from interviewing teachers and the then developed codebook (Anđić et al., Citation2022). We chose to analyze the answers to the aforementioned questions only as the other questions were directed at learning about other issues than visualizations of mathematics. The used codes were categorized into the areas ‘Financial, Curricular, Educational Knowledge, Learning/Education for Teachers, Learning/Teaching Quality, Representation and Visualisation, Technical, Time, Teaching Modernisation’. We adapted the codebook searching for mentions of representations and visualizations, tangibility, mathematical concepts that could be transported and general benefits of creating 3D visualizations. An example paragraph following the question of general benefits using 3D visualizations contains mentioning benefits of visualizing complex topics, an example of a net structure being modifiable in 3D, the benefit of tangibility, learning about technical processes, and avoiding wrong concepts by modelling:
3D modelling can be effectively used in mathematics lessons by making complex topics visual. For example, the surface area of a cube can be modelled in three dimensions so that students can see how the net can be dynamically opened and closed. This can be printed using a 3D printer, as we have seen in the course, and is advantageous because the net can be touched. Other possibilities of 3D modelling and 3D printing are to bring the modelling and printing process itself closer to the students. The detailed processes can help the students understand the technology. The modelling also helps prevent misconceptions and helps to reinforce the students’ basic concepts. (Translated from German by the authors)
Opinions from blind users
Both blind participants explained that they never explored or sensually perceived such 3D-printed models prior. They stated that they did have the opportunity to experience existing 3D models but never created such pieces by themselves. Their answers are in correlation with other research concluding that 3D printers were rare in educational and public institutions in the past due to their price. However, in the past years, the decline in prices of 3D printers caused an increase in their usage (Szulżyk-Cieplak et al., Citation2014). This hints towards 3DP holding possibilities and might be more available for blind students in the future. Asking the participants about the requirements 3D printed models should fulfil, the 3D print size was addressed:
Andy: They should be large enough to allow perception of all parts, but not huge because if the model is too large it is hard to handle. The model should enlarge important parts, but also give an overview of the rest which is an important part of things the model represents. Sonja agreed and added: It’s really important that every part of the model makes a correlation with others and they should be represented in the right proportions ratio.
Both participants never heard about the possibilities on how to produce three-dimensional photos using 3D printers. They mentioned however that they did believe 3D printed photography with tactile reliefs could be rather expensive. They stated that 3D printed photography could support blind people to perceive scientific processes, historical moments, the face of scientists as well as politicians, but also photos of peers, teachers and more.
Opinions from pre-service mathematics teachers
Ten of the pre-service mathematics teachers mentioned the tactile and haptic qualities as being valuable and adding another sensational dimension. The haptic quality, therefore, could be important for blind, visually impaired and non impaired students. Connected described benefits of tangible visualizations were creating objects that can be manipulated by students, as seen above, and preventing misconceptions. Examples and amounts can be found in Table .
Table 1. Amounts of mentioned terms and examples, translated from German by the authors.
One pre-service teacher referred to the E-I-S principle of Bruner (Citation1966), which discusses enactive, iconic, and symbolic representations that vary throughout the development and age of students. Dilling (Citation2019) uses the E-I-S principle explaining connections between 3DP and virtual and physical models of concepts by comparing them. Pre-service teachers mentioned the potential for visualizations for the following concepts: forms, bodies, volumes, diagrams, geometric drawing, pythagorean principles and proofs, probability, the Thales theorem, mathematical modelling, geometrical thinking, seeing mathematics in use, symmetries, triangles, negative numbers, and in the possibility to make mathematics more playful. One also mentioned the interdisciplinarity of the approach: ‘Interdisciplinary teaching: e.g. a model for biology is designed in maths’. This points to a broad palette of possible benefits from 3D visualizations also for non-visually impaired students. Others mentioned the process itself of creating a visualization could be beneficial to apply mathematics and concepts from other STEM subjects: ‘3D printing leads to students applying knowledge they have learnt in a construction process’. STEAM, integrating Arts to STEM was mentioned twice explicitly: ‘3D printing can increase the STEAM competences - i.e. the combination of maths and art, technology’, ‘It promotes the students’ STEAM skills’.
Results of the technical solution
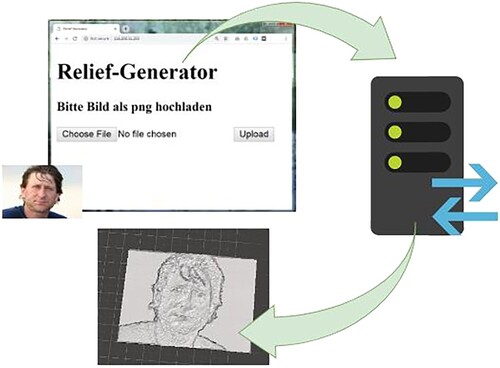
For producing printable visualizations, a tool was created by the authors addressing the need for details in photographs and helping blind people access them in case they are capable of using simple websites. In contrast to current systems for embossing images on paper, this tool does not need image preprocessing and the result is not only embossed but also imprinted for more information density. An upload of an image generates a printable 3D relief for download. The 3D models for printing are created by the following workflow: (i) uploading and adjusting a picture, (ii) generating and downloading its 3D model as a relief. The relief creation is sketched out in Figure . Following the guidelines of the AFB, a simplified user interface was created for the upload of images and adjusting the displacement of light and dark parts on a square plate. After uploading an image, a square base is created, subdivided, and colour intensities are transformed into adjustable depth information. The base is levelled accordingly creating a 3D printable model.
Figure 2. Workflow of the relief generator.
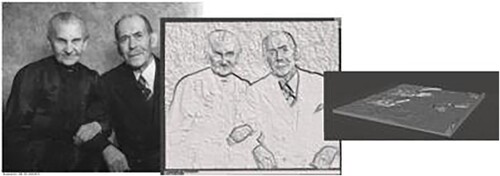
A displacement modifier uses the intensity of the colour or grayscale information to make lighter areas higher and dark areas darker, similar to the Lithophane approach to create a 3D relief based on the image colour intensity values which can range from 0 to 255 from white to black. This relief is post-processed automatically, smoothing the edges. Black-and-white images create sharp edges as on Figure which is mentioned in the suggestions by the AFB, visualizations with colours return reliefs with a much wider depth variety.
Figure 3. An old couple in grayscales preserved by the ‘Bundesarchiv’ Germany turned into a relief for 3DP.
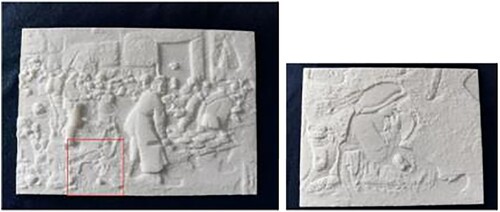
Since Brueghel was used by Singer, we created our own approach in the direction of perceiving the art of Brueghel (see Figure ). The picture has a large density of details, many colours and we used the picture to see whether too many details would be left out as this was a struggle of Singer. We first created a relief from the picture ‘Bauernhochzeit’ and then a detail at the edge of the picture, following the suggestions of the AFB for an overview- and detail images. Our relief approach is a negative of the Lithophanes used by Lichtenegger, dark areas are deeper and light areas are further out using Lithophanes while darker areas in everyday life are usually in the background, we chose dark to be lower and light to be higher.
Figure 4. A picture of Pieter Brueghel and a small detail of the picture print out.
Based on the feedback from the interviews with blind experts, we made several improvements to our 3D visualization generator. For instance, we simplified the user interface to make it more accessible for visually impaired users. Additionally, we enhanced the resolution, reliability and speed to generate 3D models to provide more detailed and tactilely perceivable visualizations, overcoming the limitations of the tool used by Lichtenegger. We also worked on a better balance between sharpening and smoothing the relief edges. The opinions of the blind experts are in line with research such as from Jafri and Ali (Citation2015) and Buehler et al. (Citation2016). Their remarks also correlate with the suggestions of the American Foundation for the Blind (AFB, Citationn.d.) and point towards more fields of application than mathematics.
Regarding the two experts’ concerns about costs related to tangible visualizations we translated this to the necessary time for producing a visualization since certain types of printers and their materials have become more affordable for educational institutions over the years. The size of visualizations was chosen to be 10 times 10 cm as it easily fits into a student’s hand, fulfilling the suggestion of a practical size of one of the experts. Moreover, by this size, 3D reliefs can be created in a reasonable amount of time and can be produced by most 3D printers.
Considering the experts remark about mostly larger tourist attractions being accessible to blind people we believe this is also the case regarding visualizations in education. Some general cases might be available as models in mathematics but personalized, quickly generated visualizations for example needed for homework or mathematics tests, might be beneficial. This might also be true for visualizations in STEM fields such as molecules apart from ethanol in chemistry and biology, drawings of resistances in electronics or slopes and forces in physics, mechanisms in engineering and general motivation to use technology, of course, mathematics in a broad variety of fields, and in arts and culture generating a connection to STEM.
One drawback of the technical solution is that light intensity is not always accurately describing a three-dimensional object since usually the light source is not positioned in front of people but merely at the side. In artwork, this is often even more confusing since especially in old drawings, perspective and light do not always follow the real world. These limitations might be less important for mathematical visualizations since these are often less detailed. Thus, created 3D models are only a first and rough version of an accurate 3D representation. The print itself feels sufficiently edgy to be recognized by the touch by seeing people who are able to feel general shapes. Blind people are expected to derive even more information from touching a print. Adjustment of the height of such a tangible visualization can improve visualization readability and could be used as a collaborative exercise for visually impaired and non-impaired students.
Possible areas of application
The teachers gave many comments about when they believed 3DP to lead to useful visualizations. They mentioned geometrical concepts such as forms investigating their volumes or sides by 3D printed foldable nets, showcasing probability using unfair dice or visualizing fractions by creating objects that can be disassembled: ‘3D printing can be used to make maths lessons “tangible": you can print solids, surfaces, nets … But also aids such as coordinate systems, triangles for the Pythagorean theorem, etc … Pupils can make connections between concepts and link them together’. One example could be to help understand analytical geometry by first drawing an exercise using pen and paper using the proposed method creating a 3D relief, then 3D model a larger model using CAD programs to 3D print it and finally calculating the exercise analytically to compare results. This could help investigate whether students’ calculations are similar to 2D and 3D constructions, creating multiple representations of the same object derived from different mathematical approaches. The calculated result, the result from construction in 2D visualized by the developed tool as well as 3D model could be compared, offering a tangible visualization to foster reasoning processes as described by Duval (Citation1998).
This approach can also contribute to STEM education integrating technologies students use in their daily lives such as images from text messengers and social media apps to share ideas during projects creating semi-3D illustrations for collaborations. Pre-service teachers indicated that the process of creating a 3D visualization can hold possibilities to foster STEM skills such as digital literacy, apply mathematical knowledge during the construction process and even STEAM skills were explicitly named, combining maths, art, and technology or combining subjects like biology and mathematics. This connects well to the 3D printing process requiring knowledge of many subjects including design decisions, cultural aspects, digital literacy and knowledge about computers as well as maths or physics considerations. Maths for example is not only necessary to understand the geometry of a model but also considering painting time, filament consumption, volume estimation, crossing boundaries to physics for time-to-volume or density correlations.
Summary and outlook
In this paper, we use techniques from artists to create tangible visualizations in 3D by creating a tool to help visually impaired students to experience images or drawings. We then asked pre-service mathematics teachers about their opinions of 3DP to learn about possible benefits for students and areas where such visualizations could be applied. In the past, different kinds of techniques and materials were used to create visualizations by artists which inspired us to learn from them. Approaches were made to make visualizations experienceable for visually impaired people by, for example in arts, manually producing 3D replications of pictures and paintings with clay or bronze creating reliefs. We apply these ideas inspired by Lithophanes, paintings turned into reliefs using light and shadow, to create tangible image visualizations. A self-created tool offers possibilities to quickly generate moderately sized 3D models which then can be produced with common 3D printers. Based on the opinions of blind experts, we adapted our 3D visualization generator to improve usability and accessibility. Specifically, we simplified the user interface, enhanced the resolution of the generated models, and increased the processing speed. These changes were made to ensure that the models are detailed enough to be useful for educational purposes and easily perceivable through touch.
Using tangible visualizations can be useful for blind, visually impaired, and also for non-impaired students. 33 pre-service mathematics teachers gave their opinions about the possible benefits of 3DP hinting towards tangible objects as being useful as they could be manually manipulated or help understanding concepts. Moreover, by self-creating models, students would have a variety of possibilities to train STEM subjects, problem-based learning and they point to motivational aspects according to them. Mathematical topics from a wide variety were named as possible fields of application such as geometry and more. Creating tangible visualizations could help blind students create mental images of abstract concepts used in STEM and Arts such as mathematics or with images of objects that are too large or too small to be investigated by touch such as human cells or large trees. This could also contribute to students’ personalization of learning processes and help create meaningful activities fostering STEM skills.
In the future, additional research will be needed to further evaluate whether or not visually impaired people have a more accurate concept perception with longer periods of working time on a subject through the creation of 3D printable models. Additional investigation will reveal whether blind students benefit from 3D visualizations in the way pre-service mathematics teachers anticipate applications for their students without disabilities and might bring forth which benefits in detail students can derive from the use of a tool turning 2D representations into 3D objects and at which step certain skills can be trained. This process could initiate further developments in STEM education for the blind and could be utilized to foster STEM skills for all students. Finding exercises that all students can do in similar ways collaboratively such as creating tangible visualizations together in mathematics in settings crossing subject boundaries could be beneficial, incorporating cultural and artistic aspects which could lead to STEAM skills. The creation of such exercises for the suggested mathematical concepts could lead to improved support for both visually impaired students and such students without disabilities.
The authors conducted the research reported in this article in accordance with the ethical standards and principles for conducting research at the School of Education, Johannes Kepler University Linz, Austria. The authors declare that research participants’ informed consent to the publication of findings – including photos, videos and any personal or identifiable information – was secured prior to publication.
Disclosure statement
No potential conflict of interest was reported by the authors.
References
- AFB style guidelines. (n.d.). The American foundation for the blind. Retrieved February 1, 2023, from https://www.afb.org/publications/jvib/jvib-authors/afb-style-guidelines.
- Anđić, B., Ulbrich, E., Dana-Picard, T., Cvjetićanin, S., Petrović, F., Lavicza, Z., & Maričić, M. (2022). A phenomenography study of STEM teachers’ conceptions of using three-dimensional modeling and printing (3DMP) in teaching. Journal of Science Education and Technology, 32(1), 45–60. https://doi.org/10.1007/s10956-022-10005-0
- Bruner, J. (1966). Toward a theory of instruction. Harvard University Press.
- Buehler, E., Comrie, N., Hofmann, M., McDonald, S., & Hurst, A. (2016). Investigating the implications of 3d printing in special education. ACM Transactions on Accessible Computing (TACCESS), 8(3), 1–28. https://doi.org/10.1145/2870640
- Campbell, J. M. (2017). Visualizing large-order groups with computer-generated Cayley tables. Journal of Mathematics and the Arts, 11(2), 67–99. https://doi.org/10.1080/17513472.2017.1318511
- Campbell, J. M. (2020). On the visualization of large-order graph distance matrices. Journal of Mathematics and the Arts, 14(4), 297–330. https://doi.org/10.1080/17513472.2020.1766348
- Coolidge, J. L. (1963). The mathematics of great amateurs.
- Dalfó, C., Fiol, M., & López, N. (2021). New results for the Mondrian art problem. Discrete Applied Mathematics, 293, 64–73. https://doi.org/10.1016/j.dam.2021.01.016
- Dilling, F. (2019). Einordnung der 3D-Druck-Technologie in die fachdidaktische Forschung. In Der Einsatz der 3D-Druck-Technologie im Mathematikunterricht (pp. 5–38). Wiesbaden: Springer Spektrum. https://doi.org/10.1007/978-3-658-24986-1_3
- Duval, R. (1998). Geometry from a cognitive point of view. In C. Mammana & V. Villani (Eds.), Perspectives on the teaching of geometry for the 21st century (pp. 37–52). Dordrecht: Kluwer.
- Garber, M. (2019, January 22). The uncanny face model they made with Richard III's skull... and it was made by, yep, a 3D printer. The Atlantic. Accessed from https://www.theatlantic.com/technology/archive/2013/05/theuncannyface-model-they-made-with-richard-iiisskull/275965/.
- Griffith, D. A. (2021). Eigenvector visualization and art. Journal of Mathematics and the Arts, 15(2), 170–187. https://doi.org/10.1080/17513472.2021.1922239
- Gutiérrez, A. (1996). Visualization in 3-dimensional geometry: In search of a framework. In L. Puig & A. Gutiérrez (Eds.), Proceedings of the 20th conference of the international group for the psychology of mathematics education (pp. 3–19). Universidad de Valencia.
- Jafri, R., & Ali, S. A. (2015). Utilizing 3D printing to assist the blind. In 2015 International Conference on Health Informatics and Medical Systems Hims (pp. 55–61).
- Kattchee, K. (2013). Kandinsky, math artist. In Proceedings of Bridges 2013.
- Lamoureux, E., Gadgil, S., Pesudovs, K., Keeffe, J., Fenwick, E., Dirani, M., Salonen, S., & Rees, G. (2010). The relationship between visual function, duration and main causes of vision loss and falls in older people with low vision. Graefe's Archive for Clinical and Experimental Ophthalmology, 248(4), 527–533. https://doi.org/10.1007/s00417-009-1260-x
- Lichtenegger, B. (2019). Light painting: Visualization with and through Light, Bridges Proceeding (submitted).
- Lithophane. (2019, February 6). Online tool. http://3dp.rocks/lithophane/.
- Nakamura, K. (2021). Iterated inversion system: An algorithm for efficiently visualizing Kleinian groups and extending the possibilities of fractal art. Journal of Mathematics and the Arts, 15(2), 106–136. https://doi.org/10.1080/17513472.2021.1943998
- Nelson, R., & Segerman, H. (2017). Visualizing hyperbolic honeycombs. Journal of Mathematics and the Arts, 11(1), 4–39. https://doi.org/10.1080/17513472.2016.1263789
- Osinga, H. M., & Krauskopf, B. (2007). Visualizing curvature on the Lorenz manifold. Journal of Mathematics and the Arts, 1(2), 113–123. https://doi.org/10.1080/17513470701503632
- Özdural, A. (2000). Mathematics and arts: Connections between theory and practice in the medieval Islamic world. Historia Mathematica, 27(2), 171–201. https://doi.org/10.1006/hmat.1999.2274
- Praske, T. (2019). Pieter Brueghel in 3D – die “Volkszählung zu Bethlehem” neu interpretiert (2019, January 16). https://www.tanjapraske.de/kulturerleben/kunstblick/pieter-brueghel-3d-volkszaehlung-bethlehem-martina-singer/
- Rubin, H., & Rubin, I. (1995). Qualitative interviewing: The art of hearing data. Sage.
- Skawinski, W. J., Busanic, T. J., Ofsievich, A. D., Luzhkow, V. B., Venanzi, C. A., & Venanzi, T. J. (1994). The use of laser stereolighography to produce three-dimensional tactile molecular models for blind and visually impaired scientists and students. Information Technology and Disabilities E-Journal, 1(4). https://easi.cc/itd/volume1/number4/article6.html.
- Szulżyk-Cieplak, J., Duda, A., & Sidor, B. (2014). 3D printers – New possibilities in education. Advances in Science and Technology Research Journal, 8(24), 96–101. https://doi.org/10.12913/22998624/575
- Volpe, Y., Furferi, R., Governi, L., & Tennirelli, G. (2014). Computer-based methodologies for semi-automatic 3D model generation from paintings. International Journal of Computer Aided Engineering and Technology, 6(1), 88. https://doi.org/10.1504/IJCAET.2014.058012
- Yuan, M., & Bourell, D. L. (2014). Fundamental issues for additive manufacturing of lithophanes. In 6th International Conference on Advanced Research and Rapid Prototyping. Taylor & Francis.