Abstract
We will investigate the stability and invariant manifolds of a new discrete host-parasitoid model. It is a generalization of the Beddington–Nicholson–Bailey model. Our study establishes analytically, for the first time, the stability of the coexistence fixed point.
1. Introduction
Ecological systems and their component biological populations exhibit a broad spectrum of non-equilibrium dynamics ranging from characteristic natural cycles to more complex chaotic oscillations. One of the most well-known models for many experimental and theoretical investigations in ecology is Nicholson–Bailey host-parasitoid model [Citation4,Citation11–13]. This is a discrete-time model of a biological system involved two insects, a parasitoid and its host. Nicholson and Bailey developed the model (1935) and applied it to the parasitoid, Encarsia formosa, and the host, Trialeurodes vaporariorum. The term ‘parasitoid’ refers to a parasite which is free living as an adult but lays eggs in the larvae or pupae of the host. Hosts that are not parasitized give rise to their own progeny. Hosts that are successfully parasitized die but the eggs laid by the parasitoid may survive to be the next generation of parasitoids.
For the host-parasitoid model of Nicholson–Bailey, the basic variables and parameters are defined as follows:
of host species in generation t.
r=number of eggs laid by a host that survive through the larvae, pupae, and adult stages.
e=number of eggs laid by a parasitoid on a single host that survive through larvae, pupae, and adult stages.
The parameter r and e are positive. Applying these definitions, the general host-parasitoid model has the form:
The function f can be interpreted as the probability that each individual host escapes the parasites, so that the complementary term 1−f in the second equation is the probability of being parasitized. Note that if Nt=0, then Pt=0 that is the parasitoid cannot survive without the host. That is why parasitoids are good biological control agents.
Nicholson and Bailey model assumes a simple functional form for f(Nt, Pt). f depends on the searching behaviour of the parasitoid. The number of encounters of the parasitoids Pt with the hosts Nt is directly proportional to the host density Nt and thus follows the law of mass action aNt Pt. The parameter a is the searching efficiency of the parasitoid which is the probability that a given parasitoid will encounter a given host during its searching lifetime. Since the number of encounters are distributed randomly among the available hosts Nicholson and Bailey used the Poisson distribution: where n is the number of encounters and μ is the mean of encounters per host in one generation. Once the host is parasitized, it will not be parasitized again. Host with no encounters p(0), are separated from those with more than one encounter, 1−p(0). The probability of encounters of the host by parasitoid represents the fraction of hosts that are not parasitized, that is,
, where
, thus
:
Hone et al. [Citation8] have studied the following predator-prey system, which generalizes the model in Equation (1):
Notice that in Equation (4), when a=b we obtain the Beddington model. With unlimited capacity, for which the term Nt/K vanishes, Equation (4) becomes the model discussed by Hone et al. Further, if a=b and the capacity is unlimited, we have Nicholson–Bailey model.
Now, we eliminate some of the parameters by changing the variables. Taking xt=Nt/K, and yt=bPt, we obtain
All the procedures we maintain for the case a≠b in this paper can be done for the case a=b by taking q=1.
2. Equilibrium points
The fixed points of the discrete system () are obtained:
lemma 2.1
For the system given in (),
(a) if μ≤1, then there exist two non-negative fixed points which are (0, 0) and (1, 0).
(b) if μ>1, there exist three fixed points which are (0, 0), (1, 0) and
Proof To find the fixed points of the system given in (), the following system of equations must be solved:
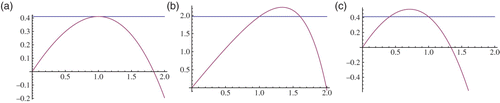
(a) If μ=1, then F′(1)=0 and the only intersection point is at x=1. From Equations (6) we obtain y=0. Hence, the fixed points are (0, 0) and (1, 0). There are no positive fixed points for this case ((a)). If μ<1, then F′(1)>0. We know that F″(x)<0 and
(b) If μ>1, then F′(1)<0. We know that F″(x)<0 for all x and F′(0)>0. Hence, there exists another fixed point which is different from (1, 0). Let us denote the x-component of this fixed point by x=ℓ. Then ℓ<1 and hence
Figure 1. z=F(x), z=r: (a) μ=1, (b) μ<1, and (c) μ>1.
Note that it is not possible to have an explicit expression of the coexistence fixed point . However, in order to compute the stability region, we need to approximate it. The remainder of the section will be devoted to estimate the coexistence fixed point and to prepare the ground work needed to estimate the stability region.
lemma 2.2
Let be in C2 where f′(x)>0, f″(x)<0 for all
and let
where
and α<0. Furthermore, assume that y=f(x) and y=g(x) have an intersection point at
(Note that, there is not another intersection point.). Take any point (x0, y0) on the curve y=f(x) such that
.
Then, the line tangent to the curve y=f(x) at the point (x0, y0) intersects g(x) at the point (x1, y1) where .
Proof Firstly, let us define the regions
. By using the monotonicity of the functions, it is easy to show that every point on the curve y=f(x) lay in the set
. Similarly, the line y=g(x) lays in the set
. Take any point (x0, y0) on the curve y=f(x) such that
Since f″(x)<0, except the tangent point, every point of the tangent line at (x0, y0) is above the curve y=f(x). The tangent line and the line y=g(x) intersect at some point (xg, y1) since the slopes of the lines have different signs. The point (xg, y1) is above the function y=f(x). The points on the line y=g(x) which are above the curve y=f(x) must be in the set R1. Hence, the intersection occurs in that region which guaranties that
And, since the tangent line is monotonically increasing, xg<x0 implies y1<y0. So, we have the desired result,
().
Figure 2. Regions R1, R2, R3, and R4.
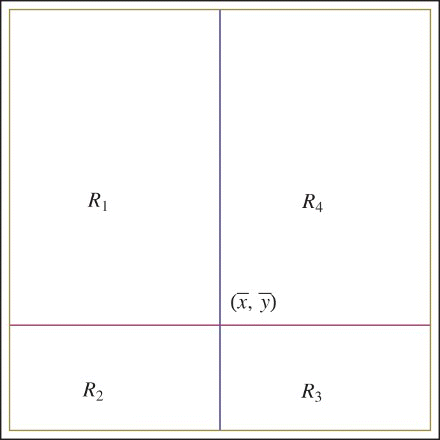
Figure 3. f(x), g(x).
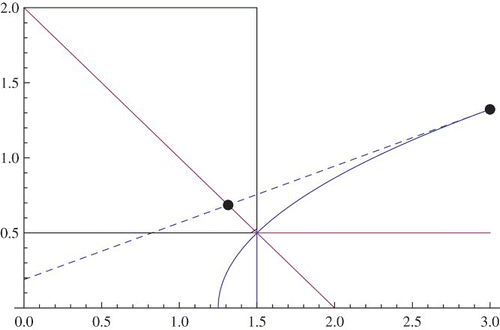
Now we construct an iteration in order to approach the intersection point of the graphs of the two functions in Lemma 2.2.
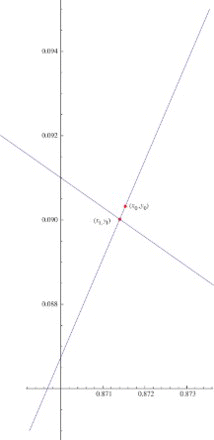
Let (x0, y0) be a point in the region R4. Now, the tangent line to the curve y=f(x) and passing through the point (x0, y0) will intersect the line y=g(x) at a point, let us call it (x1g, y1). Now the horizontal line passing through the point (x1g, y1) will intersect the curve y=f(x) at a point which will be denoted by (x1, y1). Next we find the point of intersection of the tangent line to y=f(x) passing through the point (x1, y1) and the line y=g(x) and we call this point (x2g, y2). Now the horizontal line through (x2g, y2) will intersect y=f(x) at the point (x2, y2). Hence, iteratively we construct a sequence of points on the curve y=f(x) in which every point (xt, yt) lies in the Region R4. Consequently, we have a monotonically decreasing sequences
and
. Moreover, one may show that
Theorem 2.3
Let be in C2 where f′(x)>0, f″(x)<0 for all
. Consider
where
and α<0. Furthermore, assume that f and g intersect at the point
. If
then for any initial value y0=f(x0),
is the only fixed point of the difference equation
where u=f−1. Moreover{\rm,} this fixed point is asymptotically stable.
Proof In order to find the fixed points we solve the following equation:
Hence, we obtain
Now, we are ready to focus on the isoclines of system ():
Figure 4. yt+1=G(yt) where μ=2.1, r=2.7, and q=1.2.
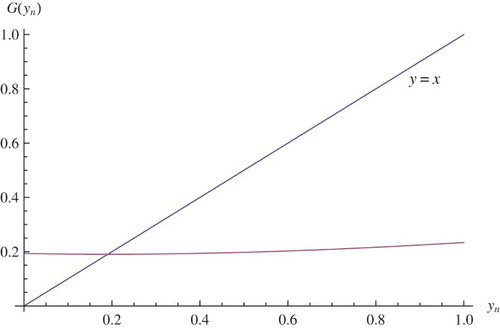
The iteration is shown in .
Figure 5. Isoclines and the iterations of yt=G(yt).
The iteration in Equation (12) gives rise to the sequence with Yt>y*, where y* is the y-component of the coexistence fixed point of the system (
). We now create a new sequence
, where Yt˜ is the y-component of the point on the isocline
with the x-component equals to Xt.
Now . Hence, the equation for Yt˜ is given by
So for Y0>y*, we have
3. Stability of system ()
3.1 Stability of extinction and exclusion fixed points
Theorem 3.1
For system (), the following statements hold true:
(a) (0, 0) is unstable.
(b) (1, 0) is asymptotically stable if 0<μ<1 and 0<r≤2 or 0<μ≤1 and 0<r<2.
Proof The Jacobian matrix of the map
is
(a) The Jacobian evaluated at the point (0, 0) is
(b) The Jacobian evaluated at (1, 0) is
The Jacobian of the planar map given in Equations (14) iswhereThus on the center manifold u=h(v) we have the following map:where
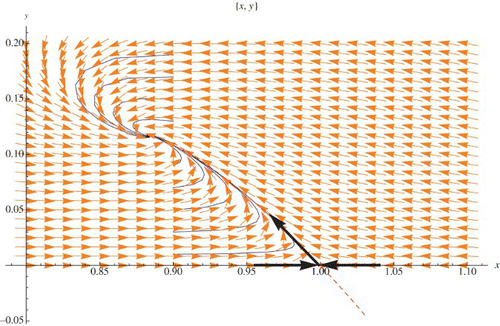
Figure 6. The map P on the center manifold u=h(v) where μ=1, q=1.6, and r=.8.
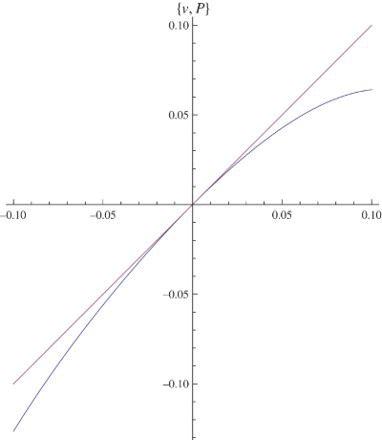
Figure 7. The center manifold u=h(v) (the dashed curve) when μ=1, q=1.6, and r=.8.
3.2 The estimation of the stability region of the coexistence fixed point in the parameter space
In this section, the estimation of the stability region of the coexistence fixed point in r-μ parameter space is presented.
lemma 3.2
For the functions let
If
and
for all
then
Proof For , it is trivial. Now let
. Take
Then
Hence,
from which we conclude that
Thus,
In Section 2, we give a symbolic approximation of the coexistence fixed point. To obtain the stability region for the fixed point, we use Equation (13), Lemma 3.2 and the following Trace-Determinant Formula [Citation5]:
where J* is the Jacobian matrix evaluated at the coexistence fixed point.
It is equivalent to
Firstly, we convert the Jacobian of the system at the coexistence fixed point (x*, y*) to the following form in which, x* is eliminated:
The determinant and the trace of J* are
3.2.1 Case 1. Det(J*)<1
The region on r-μ parameter space for the condition is given by
Let
3.2.2 Case 2. Tr (J*)<1+Det(J*)
By using the similar idea as Case 1, we convert this inequality to the form where both sides are monotonic functions with respect to y* and use the bounds in Equation (13) to obtain the region
3.2.3 Case 3.−1−Det(J*)<Tr (J*)
For this case, similarly we obtain the region
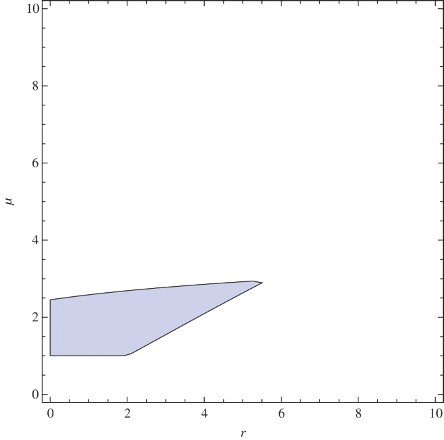
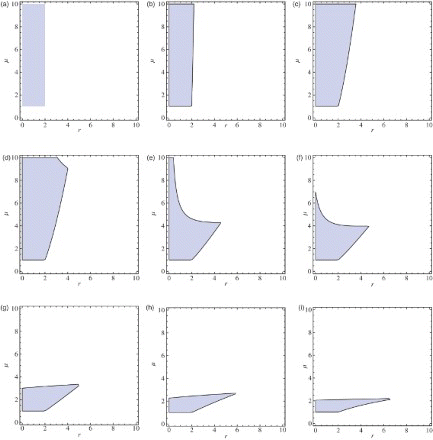
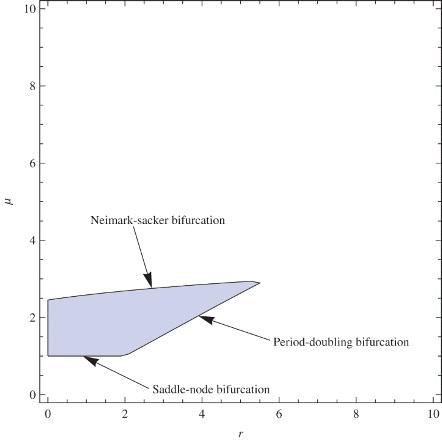
In order to obtain the stability region in the (r, μ) plane, let us take q=1.6. By numeric computations, we obtain the regions A5, B5, and C5 which are subsets of the regions satisfying ,
and
, respectively. Since the intersection of the sets A5, B5, and C5 is a subset of the stability region, finally, we obtain the approximated stability region of the coexistence fixed point. Furthermore, on the borderline of the stability region, we have Neimark-Sacker bifurcation when
; saddle-node bifurcation when
and period-doubling bifurcation when
. In , the approximated stability region and the types of bifurcation appearing on the borderline of the region is presented.
Figure 8. A5∩B5∩C5: approximated stability region for coexistence fixed point, where q=1.6.
The approximated stability region for some particular values of parameter q is given in . Note that, when q=1, which is the case a=b, is the region given in [Citation12].
Figure 9. Approximated stability region for coexistence fixed point: (a) q=.00001, (b) q=.01, (c) q=.1, (d) q=.15, (e) q=.5, (f) q=.6, (g) q=1, (h) q=2.4, and (i) q=10.
4. Stable and unstable manifolds
4.1 The extinction and exclusion fixed points
For the point (0, 0), since and
, the extinction fixed point is a saddle for all values of the parameters r and μ. For this point, the x-axis is the unstable manifold and the y-axis is the stable manifold.
Now, let us focus on the exclusion fixed point, (1, 0): by using a similar procedure to that used for the center manifold in the proof of Lemma 3.1, we obtain the stable and unstable manifolds which are locally defined. In model (), the saddle scenario for the exclusion fixed point occurs when r>2, μ<1, or r<2, μ>1.
4.1.1 Case 1. r>2 and μ<1
Shifting the exclusion fixed point from (1, 0) to (0, 0) we have the following Jacobian matrix:
Now we can write the equations in system (14) as
The function h must satisfy the equation
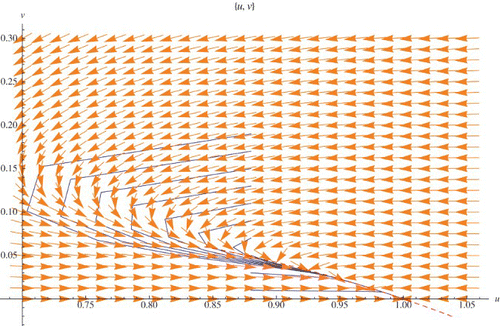
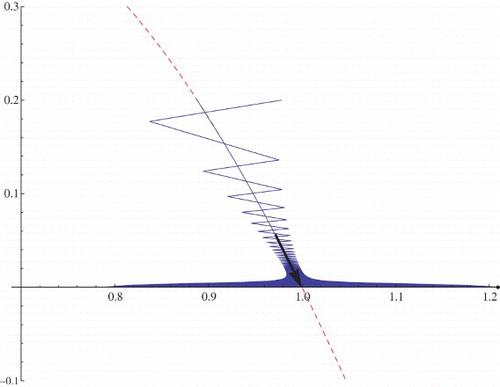
In order to solve the functional equation, the Taylor series expansions of required functions are calculated and solving the system we get α and β which locally determine the stable manifold u=h(v) for the exclusion fixed points. Due to the big size of the formulas for the constants α and β we omit them. In , the stable manifold is presented. There are two orbits with initial points (.888,.2) and (.98,.2). The first initial point is on the stable manifold.
Figure 10. Stable manifold for the exclusion fixed point (1, 0) (the dashed curve). r=2.03>2, μ=.9<1, and q=1.2.
In order to find the unstable manifold for the exclusion fixed point, we use the same idea. However, we assume here that the map h takes the form
We obtain that α=0 and β=0.
When yt=0 in Equation (), the dynamics of population xn is determined by the one-dimensional Ricker map. If 2<r<r2, where
, the fixed point (1, 0) loses its stability and a new asymptotically periodic orbit
of period 2 is born. the unstable manifold is the open interval
that lies on the x-axis. As r increases, period-doubling bifurcation occurs until
, after which we enter the chaotic region. Hence, the boundary of the unstable manifold shrinks to 0 as r>2 increases. More details on the periodic points of the Ricker map and the basin of attractions of its periodic orbits may be found in [Citation6].
4.1.2 Case 2. r<2 and μ>1
In order to find the unstable manifold for this case, let us assume that the map h takes the form
Since μ>1, the unstable manifold is tangent to the corresponding eigenvector at the fixed point.
Since the method we use for this case is the same as in the previous case, we omit the details.
In order to find the stable manifold for the exclusion fixed point, we assume that the map h takes the form
.
Figure 11. Stable and unstable manifolds for the exclusion fixed point (1, 0). μ=1.2>1, r=.5<2, and q=.5
5. Bifurcation scenarios
In this section, a bifurcation diagram for the positive fixed point is presented. In , Tr–Det Diagram for a general system is shown. We give the corresponding regions for system () in : Bi is the corresponding region for Ai.
Figure 12. Tr–Det diagram for general two-dimensional discrete-time system.
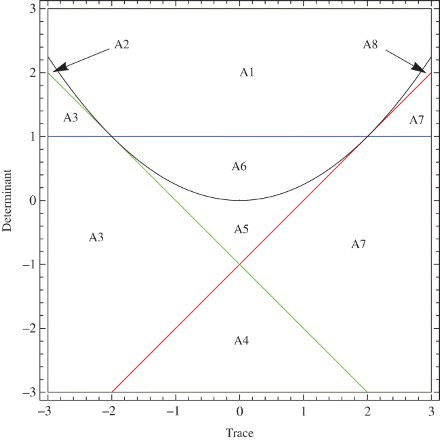
Figure 13. Corresponding regions for system ().
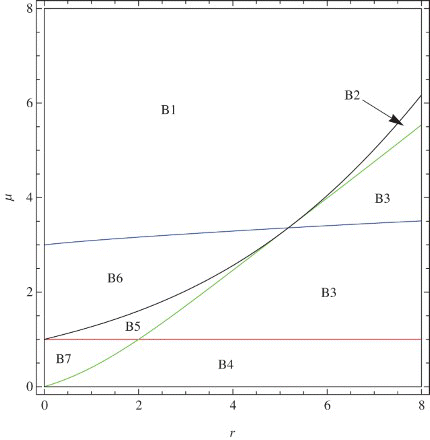
We can see from these figures that on the border between the stability region and region B3, we have period-doubling bifurcation. The saddle-node bifurcation occurs when the point (r, μ) moves from the stability region to region B7. We find that the map u=P(v) obtained by the center manifold theorem satisfies the conditions and
, where μ*=1 and v*=0 for the case. Hence, this bifurcation is a transcritical bifurcation [Citation5].
The system also possesses a Neimark-Sacker bifurcation [Citation5] when the parameters are on the border between the stability region and region B1. as shown in .
Figure 14. Types of bifurcation on the borderline of the stability region q=1.6.
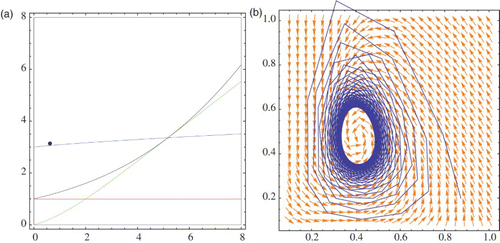
depicts the phase-space diagram and regions in the parameter space when (r, μ) is in the stability region and close to the border of the Neimark-Sacker bifurcation. The case when the point (r, μ) passes the bifurcation curve is given in . The black points in Figures 15(a) and 16(a) represent the point (r, μ).
Figure 15. (r, μ) is inside the stability region: (a) bifurcation diagram, (b) phase diagram.
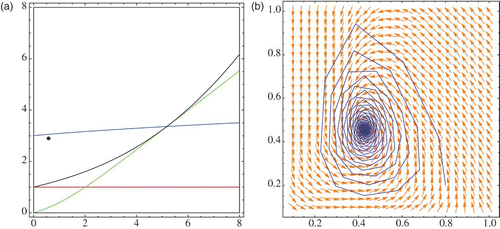
Figure 16. (r, μ) is outside the stability region: (a) bifurcation diagram, (b) phase diagram.
6. Conclusions
In this paper, we investigated the stability and bifurcation of a generalized Beddington host-parasitoid model. We were able to study the stability of the coexistence fixed point without actually computing it. This is accomplished by using upper and lower sequences approaching the coexistence fixed point. By this, we have established the mathematical analysis and provided novel tools to study the stability of of models where there is no explicit formula for the fixed points. Our results confirmed the known results in the literature for the special case a=b that were obtained via simulation. The invariant manifolds for the extinction and exclusion fixed points were obtained. Due to the lack of an explicit formula of the coexistence fixed point, we were not able to investigate the Neimark-Sacker bifurcation and the other types of bifurcations. The presence of Sacker-Neimark bifurcation was shown via numerical simulations. Moreover, the global dynamics of the system has not been determined and needs further study. Future research will include the investigation of the global stability of our system via the newly established tools and techniques that have been recently developed by Balreira et al. [Citation1]. It is expected that for certain values of the parameters, our system is monotone. In that case, one may utilize the theory of monotone dynamical systems developed by Smith [Citation14] to determine global stability.
Future research may also include a deeper discussion and analytic results on the various bifurcation scenarios. Another direction would be the study of systems with the Allee effect [Citation9].
From the biological perspective, we have established all the possible scenarios of the dynamics of both host and parasitoid. We have shown that under no circumstances would both host and parasitoid go to extinction. However, it is possible that parasitization of the host would fail. Moreover, we have established ecological conditions under which both host and parasitoid tend to a stable equilibrium state.
Now outside the stability region in the parameter space (), the three bifurcation scenarios indicate the possible dynamics of both host and parasitoid. Crossing the saddle-node bifurcation line (0<μ<1 and 0<r<2), the parasitoid will go to extinction. Moreover, crossing the period-doubling bifurcation line, both populations will undergo periodic fluctuation in this sizes which may lead to erratic and chaotic fluctuations. However, crossing the Neimark-Sacker bifurcation line, the populations will spiral and tend towards a closed invariant curve. The oscillation is caused by having a pair of complex conjugate eigenvalues of the Jacobian of our plane maps.
In conclusion, parasitization succeeds and both species persist under most ecological conditions.
Acknowledgements
The first author thanks the financial support from TUBITAK for his stay at Trinity University during the period this paper was written.
Funding
This work was supported by the Scientific & Technological Research Council of Turkey (TUBITAK).
References
- E. Balreira, S. Elaydi, and R. Luis, Local stability implies global stability for the planar Ricker competition model, preprint (2013).
- J.R. Beddington, C.A. Free, and J.H. Lawton, Dynamic complexity in predator-prey models framed in difference equations, Nature 225 (1975), pp. 58–60. doi: 10.1038/255058a0
- J. Carr, Application of Center Manifolds Theory, Applied Mathematical Sciences, 3rd ed., Springer-Verlag, New York, 1981.
- S. Elaydi, An Introduction to Difference Equations, Springer, New York, 2005.
- S. Elaydi, Discrete Chaos: With Applications in Science and Engineering, 2nd ed., Chapman and Hall/CRC, London, 2008.
- S. Elaydi and R. Sacker, Basin of attraction of periodic orbits of maps on the real line, J. Differ. Equ. Appl. 10(10) (2004).
- M. Guzowska, R. Luis, and S. Elaydi, Bifurcation and invariant manifolds of the logistic competition model, J. Differ. Equ. Appl. 17(12) (2010), pp. 1851–1872. doi: 10.1080/10236198.2010.504377
- A.N.W. Hone, M.V. Irle, and G.W. Thurura, On the Neimark–Sacker bifurcation in a discrete predator-prey system, J. Biol. Dyn. 4(6) (2010), pp. 594–606. doi: 10.1080/17513750903528192
- S.R.-J. Jang and S.L. Diamond, A host-parasitoid interaction with Allee effects on the host, Comput. Math. Appl. 53 (2007), pp. 89–103. doi: 10.1016/j.camwa.2006.12.013
- R. Luís, S. Elaydi, and S. Oliveira, Stability of Ricker-type competition model and the competitive exclusion principle, J. Biol. Dyn. 5(6) (2011), pp. 636–660. doi: 10.1080/17513758.2011.581764
- J.D. Murray, Mathematical Biology, Vol. 5, Springer, New York, 2002, pp. 636–660.
- M.G. Neubert and M. Kot, The subcritical collapse of predator populations in discrete-time predator-prey models, Math. Biosci. 110 (1992), pp. 45–66, ISSN 0025-5564, doi: 10.1016/0025-5564(92)90014-N.
- A. Nicholson and V. Bailey, The balance of animal population, Proc. Zool. Soc. Lond. 3 (1935), pp. 551–598.
- H. Smith, Planar competitive and cooperative difference equations, J. Differ. Equ. Appl. 3(5–6) (1998), pp. 335–357. doi: 10.1080/10236199708808108