
Abstract
In this paper, we consider a continuous mathematically tractable model and its discrete analogue for the tumour growth. The model formulation is based on stoichiometric principles considering tumour-immune cell interactions in potassium (K +)-limited environment. Our both continuous and discrete models illustrate ‘cancer immunoediting’ as a dynamic process having all three phases namely elimination, equilibrium and escape. The stoichiometric principles introduced into the model allow us to study its dynamics with the variation in the total potassium in the surrounding of the tumour region. It is found that an increase in the total potassium may help the patient fight the disease for a longer period of time. This result seems to be in line with the protective role of the potassium against the risk of pancreatic cancer as has been reported by Bravi et al. [Dietary intake of selected micronutrients and risk of pancreatic cancer: An Italian case-control study, Ann. Oncol. 22 (2011), pp. 202–206].
1. Introduction
The evidence accumulated in the past decade indicates that the immune system can recognize and eliminate malignant tumours in a process termed ‘cancer immunosurveillance’ [Citation7,Citation22,Citation34]. The work from many laboratories has validated the concept of cancer immunosurveillance, demonstrating that immune system can indeed protect mice from outgrowth of tumours [Citation11,Citation15,Citation30,Citation32,Citation33,Citation39]. The current view on the host immune system is conflicted by evidence for antitumour effects as well as evidence for tumour-favouring actions [Citation39–41]. ‘Cancer immunoediting’ is the term used in the literature for this dual action of the host immune system [Citation39].
The immune system mostly consists of white blood cells, especially T lymphocytes (usually CD8+ and CD4+ T cells along with their characteristically produced cytokine IFN-γ), natural killer cells and macrophages. The lymphocytes are used to detect any foreign or non-self cells in the body known as antigens. It has been shown experimentally that these immune cells can lyse tumour cells very effectively [Citation7,Citation26]. Tumour associated macrophages or myeloid-derived suppressive cells, CD4+ Foxp3+ Treg cells and Th17 cells and their associated cytokines Il-6, TNF, IL-1β, IL-23 and TGF-β are generally recognized as dominant tumour-promoting forces [Citation41].
Evidence indicates that a healthy immune system is necessary for control of malignant disease. One of the common factors that have been associated with pronounced abnormalities in the immune system is poor nutrition [Citation23,Citation25]. The convincing evidence exists that individuals who have been on immune-suppressive medications for longer periods of time, or have autoimmune disease or chronic infection (such as AIDS) are particularly at risk of malignancy [Citation24,Citation25]. The chronic inflammation, previous viral infections such as EBV, Hepatitis B and C, herpes virus or HIV are also significant factors that hamper proper functioning of immune system and lead to development of various cancers [Citation12,Citation24,Citation27,Citation31]. Failure of intact immune responses, such as immunosurveillance or immunoediting, has also been associated with evasion or immune-suppression activities of cancer [Citation28,Citation29]. Tumours often avoid detection by Killer T cells by having a reduced number of MHC class I molecules on their surface [Citation10]. Some tumours release products, such as cytokine TGF-β, which suppress the activity of macrophages and lymphocytes [Citation10].
In a recently reported study, Bravi et al. [Citation2] considered the role of 15 selected vitamins and carotenoids and 6 minerals including potassium in the protection against pancreatic cancer. Analysing separate role of different minerals, they found significant inverse trends in pancreatic cancer risk for increasing intake of potassium. Prior to Bravi et al. ’s [Citation2] work, two studies of Jansson [Citation13,Citation14] regarding the colorectal cancer risk in the USA also hinted at the possible role of electrolytes sodium and potassium in cancer etiology. In its simpler form Jansson studies attempted to suggest that intracellular and dietary potassium (K +) protects against cancer and intracellular and dietary sodium (Na) increases the risk of cancer. It can be mentioned here that all studies such as mentioned above have been of the suggestive nature for the positive role of electrolyte potassium against the risk of cancer. Unfortunately there are neither direct cell-biology-based investigations nor biological data available in the literature that support or negate the role of potassium against cancer risk.
We focus in this paper on the suggestive prediction of the above studies especially the work of Bravi et al. [Citation2] regarding the positive role of potassium against the cancer risk. To this end, we formulate a tractable mathematical model based on the principles of stoichiometry to represent interactions of cancer and immune cells in (K +)-limited environment using the structure of the Kuang–Huisman–Elser (KHE) model [Citation16]. We modify this model and incorporate in it the coercing of the surrounding immune cells by cancer cells and a medical treatment strategy that may help add immune cells in the body by a constant rate.
We structure the paper as follows. The continuous model formulation is given in Section 2. The results for boundedness of the continuous model solution and local stability of its equilibriums are given in Section 3. The discrete analogue of the continuous model and the local stability results of its equilibriums are discussed in Section 4. Numerically drawn bifurcation diagrams illustrating the positive role of potassium against the cancer are given in Section 5. This section also shows the possibility of chaotic dynamics in the discrete model. Section 6 contains discussion and conclusions.
2. Model formulation based on stoichiometric principles
For the theory of ecological stoichiometry, one may consult the masterpiece from Sterner and Elser [Citation35]. According to Sui et al. [Citation37], ‘ecological stoichiometry is the study of the balance of energy and multiple chemical resources (usually elements) in ecological interactions’. In this section, we formulate a mathematically tractable model that specifically deals with the dynamics of cancer-immune cell interactions in closed potassium (K +)-limited environment. The above definition of ecological stoichiometry when applied to our problem can be restated as ‘cellular stoichiometry is the study of the balance of energy and multiple chemical resources (such as carbon (C) and potassium (K +)) in cancer-immune cell interactions’. The greatest advantage of applying stoichiometry principles to our problem is that it allows us to employ the variability in the K + content of the cancer cell using the Droop equation for its growth.
The concept of immune-surveillance hypothesis that immune system is capable of inhibiting the growth of very small tumours and eliminating them before they become clinically evident motivates the derivation of our mathematical model of the interactions between tumour cells and immune cells. Our immune cell population may represent any of the cytotoxic immune cells (also called effector cells) such as CD8+ or CD4+ T Cells [Citation1] of the adaptive immune system. Since adaptive immune system's effector cells proliferate in response to antigenic stimulation and kill the tumour cells, we assume that our effector cell population interacts with tumour cells in a predator–prey relationship [Citation9,Citation20] where immune cells play the role of the predator and the tumour cells that of prey. Without stoichiometric considerations, such a model, in a general setting, can be expressed as
While incorporating stoichiometric reality into model (1), we concentrate on two important substances, carbon and potassium. We assume that all other substances required for proliferation of both tumour and immune cells are abundant in the system. Since the bulk of dry weight of most organisms is carbon, we express biomass of populations in carbon terms. Our model formulation approach in introducing stoichiometric considerations in model (1) follows same steps as for the KHE model in [Citation16,Citation37] but for suitably modifying the main assumptions of the KHE model to suit our requirements. We begin with the following assumptions:
A0. All cells are assumed to be made of carbon (C)
The total mass of the potassium Kt in the entire system is fixed; i.e. the system is closed for potassium.
Stoichiometry of the immune cells is relatively stable compared with stoichiometry of the tumour cells. Thus it is assumed, that the potassium to carbon ratio
in the tumour cells varies, but it never falls below a minimum
All potassium in the system is divided into three pools: potassium in the tumour cells, potassium in the immune cells, and free potassium in the blood stream in the surrounding.
If Kc, Ki<0 and Kf denote the potassium in cancer cells, potassium in immune cells, and the free potassium in the blood stream in the surrounding, then . Let Q=Q(t) be the tumour cell's quota for K +, then Kc=Qx, Ki=θ y. Hence
As mentioned above, denoting the tumour cell's minimal quota for potassium by q, the tumour's true maximal growth rate by μm, its death rate by D, and the tumour cell's rate of killing by immune system by f(x); and using the variable-internal-stores model based on the Droop [Citation3,Citation4] equation that relates growth rate to the internal cell quota (also see [Citation5,Citation16,Citation37]), the growth rate of the tumour cells is assumed to be governed by
As for the dynamics of Q (the tumour's cell quota for K +), it is assumed that Q’s recruitment comes proportionally from the free potassium (, α being the proportionality constant) and it is depleted by
because of cell growth. This results in the following simple equation
. It can be verified that Q(t)≥q for all t>0 since Q(0)≥q.
Since the cell metabolic process operates in a much faster pace than the growth of total biomass of either cell species, the quasi-steady-state argument allows us to approximate Q(t) by the solution of . It gives
We let e measure the addition rate of immune cells into the system when the tumour cells are K +-rich (when Q≥θ). If the tumour cells are K +-poor (when Q<θ), then we assume that the addition rate suffers a reduction, and it becomes eQ/θ. This approach follows Liebig's [Citation17] minimum principle and has been used in [Citation18] model formulation. Thus, we have the following growth equation for immune cells:
In Equation (7), parameter d represents the natural death rate of the immune cells.
Up till now, we considered potassium only. Now we include the possibility that carbon may also be a potentially limiting factor. It can be simply incorporated by assuming that if carbon acquisition limits the growth of the cancer cells then its population dynamics is governed by the classical logistic equation. Applying Liebig's minimum principle to potassium versus carbon limitation of the tumour cells and accordingly modifying Equation (6) and then combining it with Equation (7), we obtain the following tumour-immune cell growth model:
Remark 2.1 Model (8) is indeed the model that has been referred to and studied as the KHE model in the literature (see [Citation16,Citation37]) for the growth dynamics of plant and herbivore under ecological stoichiometric principles. We have simply reinterpreted it for the tumour and immune cell interactions in potassium (K +)-limited environment.
We modify model (8) to consider the following model for the growth dynamics of tumour and immune cell system as our main model.
In Equation (9b), the term (−lxy) represents the coercing of surrounding immune cells by tumour cells into a servile role in the tumour stroma and the term (u) may denote a medical treatment term or any antitumour activity that may help add immune cells in the body at a constant rate.
Now the two models (1) and (9) may be compared easily. It can be seen that incorporation of stoichiometry concepts in model (1) brings in two significant changes as given below:
(a) Unlike Equation (1a) where the carrying capacity of the tumour cells is L (constant), the carrying capacity of the tumour cells in Equation (9a) based on stoichiometry principles depends on total potassium Kt as well as on the biomass or density of the immune cells.
(b) The production efficiency of the immune cells in Equation (1b) is considered a constant e whereas in Equation (9b) it depends on the ratio of the cell quota of potassium of cancer cells and immune cells.
Likewise [Citation18], we assume that the function f(x) (in Equations (9)) that denotes the rate of killing of tumour cells by immune cells is a bounded smooth function such that
It follows from the appendix in [Citation18] that the function P(x)=f(x)/x has the following properties:
For facilitation of analysis, another version of model (9) will also be used in this paper given as
Here p denotes the maximal immune cells’ density allowed by the total potassium in the system and s is a dimensionless constant equal to the tumour cells minimal divided by the constant immune cell's
. Model (10) is different from model (9) in that in Equations (10), θ is scaled out while all other parameters are retained.
The following theorem gives sufficient conditions that ensure that the solution of the model (10) (or model (9)) remains bounded.
Theorem 2.1
Let . Solutions with initial conditions in the open trapezoid (or triangle if
remain there for all forward times provided
.
We relegate the proof of this theorem to the appendix. This result becomes important in that it gives bounds on u such that if u is chosen within these bounds then it guarantees that the solution of model (10) (or model (9)) remains bounded. As remarked above, the term (u) may easily be treated as the control parameter for the tumour and directly be related to the dose of the medicine to the patient during the course of his/her treatment.
Remark 2.2 Model (9) is a generalization of the KHE model (2.1) in [Citation37] as it reduces to it when l=0 and u=0. The noticeable difference between the KHE model and model (9) is that they have different boundary equilibriums. While boundary equilibriums for the KHE model (or model (8) of this paper) are E0=(0, 0) and E1=(k, 0), model (9) has single boundary equilibrium E1=(0, u/d). For the dynamics of the KHE model and the stability of its equilibriums one may refer to various results (theorems) reported in [Citation37].
3. Local stability of model (9)
To study the equilibrium solutions of model (9) and their local stability, we rewrite this model in the following form:
where
For an equilibrium solution (x+, y+) of model (9) satisfying the equations F(x, y)=0 and G(x, y)=0, the Jacobian matrix of the system at this equilibrium can be written as
The partial derivatives of F and G, after using the notations,
It can be seen that the model (9) has unique boundary equilibrium E1=(0, u/d). The Jacobian matrix (11) at E1 turns out to be
The local asymptotic stability results for the boundary equilibrium E1 can be easily obtained by studying the eigenvalues of the matrix (13). We state these results as follows:
These results reveal: (i) that strengthening of immune system at larger rate may help eradicate the disease (result (a)) (ii) if the immune system is helped by the medical treatment at relatively smaller rates then while for an averaged value of Kt the disease may be eradicated (result (b)) but a large value of Kt may not eradicate the disease though in some cases (when internal equilibrium will turn out to be stable) it may help prolong the life of the patient with the disease (result (c)).
We now assume that an internal equilibrium of model (9) exists. Note that −Fx/Fy and −Gx/Gy denote the slopes of the tumour cell and immune cell nullclines at (x, y) respectively. The determinant and the trace of the Jacobian matrix (11) at E2 are
Let
Theorem 3.1
(a) Let
(i) Let
(ii) Let
Let
(i) Let
(ii) Let
Proof Part (a)
(i) Obviously Fy<0 and Gy<0 at E2. Since
(ii) In this case, Fy<0 and Gy>0. Since
Remark 3.1 Local stability results of Theorem 3.1 are only partial results. Results for other situations could not be discussed as in those situations signs of the partial derivatives of F and G could not be determined.
4. A discrete analogue of model (9)
In this section, we consider a discrete analogue of the continuous model (9). We do so for three main reasons: (i) discrete time models may be more appropriate for application in experiments where data are collected on discrete time intervals or periodically, (ii) a comparison of the results of continuous and discrete models would give better idea about the robustness of the results of the continuous model on discrete time scale and (iii) by knowing the dynamics of both versions (continuous and discrete) of the models by theoretic analysis, we can be in a better position to justify which model type would fit well to the experimental investigations. Unfortunately, there have been very few instances, for example [Citation21], where experimental or clinical results have been compared with predictions of mathematical models. There can be several ways of deriving discrete time versions of dynamical systems corresponding to a continuous time formulation. Here we follow the method used in [Citation8]. Assuming that the per capita growth rates in Equation (9) change only at t=0, 1, 2 … , then model (9) can be written as
Here [t] denotes the integral part of . On any interval
, we can integrate Equation (16) and obtain the following equations for n≤t<n+1:
Letting t→n+1 gives
Equation (17) represent a discrete time analogue of model (9). In the following, we focus our attention on the study of equilibrium solutions of model (17) and their local asymptotic stability. To facilitate this analysis, we rewrite this model as
The fact that the model (9) and its discrete analogue (17) have the same equilibrium solutions implies that model (17) has unique boundary equilibrium E1=(0, u/d) and one (possibly multiple) internal equilibrium (equilibriums). We have denoted one such internal equilibrium by E2 in Section 3.
The Jacobian of Equations (18) is
Here functions A(x) and B(x) are same as given in Equations (12).
The Jacobian matrix (19) at E1 turns out to be
Following results can be easily verified by studying the characteristic roots of the matrix (21).
Now we discuss the local stability of internal equilibrium E2. The Jacobian matrix (19) at E2 becomes
We will be using the following standard Jury test [Citation6] to prove the local asymptotic stability results for E2.
lemma 4.1
Let A be a 2×2 constant matrix. Both characteristic roots of A have magnitude less than 1 if and only if
Our main local asymptotic stability results are given in the following theorem.
Theorem 4.1
If the slope of the immune cell's nullcline at E2 is smaller than the tumour cell's (i.e. , then E2 is unstable. If the slope of the immune cell's nullcline at E2 is greater than the tumour cell's (i.e.
and
, then E2 is LAS.
Proof In both regions Ω1 and Ω2, Ry<0 and Sy<0. Thus
Now if at E2, then it follows that
and hence the desired result of Theorem 4.1 holds true because the inequality of Lemma 4.1 is violated. On the other hand, if
at E2, then it can be shown that whenever the inequality
holds true then the inequality of Lemma 4.1 holds and hence the desired result of Theorem 4.1 follows.
Remark 4.1
(i) It can be seen that a substitution l=0 and u=0 in the discrete model (17) leads us to the discrete KHE model (3.2) of Sui et al. [Citation37]. It can also be noticed by comparing Equations (20) of this paper with Equation (3.9) of Sui et al. [Citation37] that the nullcline functions R and S used in this paper retain same properties as displayed by corresponding functions of the KHE model. More specifically, the function Sx (x, y) (Gx (x, y) in [Citation37]) changes its sign from (+ve) in region Ω1 to (−ve) in region Ω2 and the function Sy (x, y) becomes zero in region Ω1.
(ii) It is interesting to note that parameters l and u may produce some new situations. For example, a simple manoeuvring in l in Equation (20c) can change the sign of Sx in either region thus affecting the dynamics. Choosing suitable value of l and considering
5. Numerical simulations
In this section, we present some numerical simulations for the continuous model (9) and the discrete model (17). We choose the Monod type function as the functional response function of the immune system. All the numerical simulations are done with MATLAB. We will consider parameter values adapted by Loladze et al. [Citation18], Kuang et al. [Citation16], and Sui et al. [Citation37] as our reference data set. We reproduce this data set in .
Table 1. Reference data set for model parameters.
As pointed out in [Citation37], the condition is satisfied with the initial conditions
and
when l=0, u=0. Naturally this condition will remain satisfied when l and u are different from zero but small. We do not claim that the data of represent any clinical situation. We have picked up these data because they provide desired negative signs of partial derivatives Gx and Sx giving stability changes for equilibriums and ensuring interesting dynamics. Moreover, same data closely mimic laboratory experiments investigating stoichiometric aspects of phytoplankton–zooplankton interactions [Citation36,Citation38] and thus in a sense represent biologically realistic values.
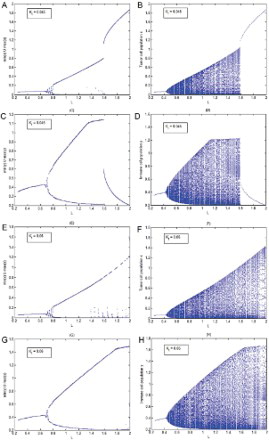
The main purpose of this section is to numerically investigate the dynamics of both the continuous model (9) and the discrete model (17) with the variation in the total potassium in the surrounding of the tumour and see whether increasing potassium K + has any protective role against the cancer as has been suggested by Jansson studies [Citation13,Citation14] and very recently by Bravi et al. [Citation2]. It can be seen through the bifurcation diagrams () that our continuous model (9) and its discrete analogue model (17) both support the protective role of potassium. In these bifurcation diagrams, the carrying capacity L of the tumour cells is taken as the bifurcation parameter. It is observed that when , l=0.2, u=0.05 are fixed and other parameter values are chosen from , then immune system fights well against averaged size tumours but it can fail for large size tumours that threat to win ultimately ((A)–(D)). But when the value of Kt is raised from 0.045 to 0.06 keeping all other parameters values fixed, then immune system shows strength to fight even larger size tumours. Here, the disease is not eradicated but it seems likely that the patient can live with disease all through his life ((E)–(H)).
Fig. 1. In this figure l=0.2, u=0.05 are fixed and values of rest of the parameters are chosen from . (A), (C), (E) and (G) are bifurcation diagrams of the continuous model (9) while (B), (D) (F) and (H) are corresponding bifurcation diagrams of the discrete model (17). The carrying capacity of the tumour cell population L is considered as bifurcation parameter.
5.1. Chaotic dynamics
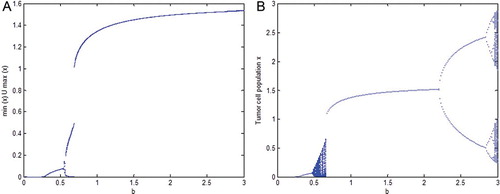
In this section, we present one situation just for illustration that the dynamics of the continuous model (9) and the discrete model (17) may differ at times. The following bifurcation diagrams ((A) and 2(B)) with b, the intrinsic growth rate of tumour cells, as bifurcation parameter show that the dynamics of the two models almost match for small and averaged values of b but for large b, while the dynamics of the continuous model (9) shows coexistence of tumour cells and immune cells at equilibrium values but the dynamics of the discrete model (17) exhibits chaotic dynamics with a route to chaos through periodic doubling.
Fig. 2. In this figure l=0.009, u=0.02, L=1.6 are fixed and values of rest of the parameters are chosen from . (A) is the bifurcation diagram of the continuous model (9), while (B) is the corresponding bifurcation diagram of discrete model (17). The intrinsic growth rate of the tumour cell population b is considered as bifurcation parameter.
6. Discussion and conclusions
Potassium (K +) is an essential mineral found in most foods. It is a mineral that is required along with sodium and calcium for the body to work normally. It helps regulate major body functions including normal heart rhythm, blood pressure, water balance in the body, nerve impulses, muscle contractions and pH balance. The body cannot make potassium on its own and must get it from foods. Potassium is found in foods such as apricots, potatoes, bananas, oranges, pineapples, green leafy vegetables, whole grains, beans, nuts and lean meat. Most people get all the potassium they need from what they eat and drink.
The starting point for this paper has been the protective nature of potassium against the cancer risk as has been suggested by Jansson [Citation13,Citation14] studies. An Italian case-control study [Citation2] recently reported significant inverse trends in pancreatic risk for increasing intake of potassium. The present paper focuses on the role of a single element, i.e. potassium on cancer etiology by developing the model using the principles of stoichiometric theory. This brings in two significant changes in the classical approach of model formulation without stoichiometric considerations. Firstly, it makes the carrying capacity of the cancer cell population dependent on the total potassium as well as the immune cell population (see Equation (9a)). Secondly, it makes the growth of immune cell population dependent on the ratio of potassium quota for cancer cell and immune cell (see Equation (9b)). Another noticeable important change that the stoichiometric theory introduces into the model (9) different from classical predator–prey relationship type formulation is the possible sign change in Gx (x, y) from positive (+ve) to negative (−ve) and vice versa (see model (9) and its representation in Section 3). The positive sign of Gx would denote successful immunosurveillance by the immune system while negative sign of Gx indicates either cancer's successful immunosuppressive activities or immune systems’ favouring approach to cancer progression. Data, supporting the dual host-protecting and tumours-sculpting actions of immunity (termed as cancer immunoediting in [Citation39]) have been reported in the literature [Citation29]. Vesely et al. [Citation39], describe cancer immunoediting as dynamic process comprising of three distinct phases: elimination, equilibrium and escape. It is interesting to note that model (9) can produce each of immunoediting's phases for specific choices of model parameters. The elimination phase is achieved when E1=(0, u/d) is stable. Equilibrium phase is possible when is stable. The escape phase can be attained either by having a stable equilibrium E1 (k, 0) under the condition l=0 and u=0 (see Remark 2.2) or by having equilibrium
as saddle and sustenance of both cancer and immune cell populations in an oscillatory mode. The oscillatory dynamics suggested by the model (9) though is not supported by any example in solid tumours; it has been shown to occur in systemic diseases such as leukaemia [Citation19]. It can be noted that the discrete model (17) depicts similar dynamics as mentioned above for model (9).
As pointed out earlier, the main purpose of the present paper is to investigate the protective nature of potassium against the cancer risk. It has been shown through bifurcation diagrams in Section 5 that the results of our continuous model (9) and its discrete analogue model (17) both suggest that increasing total potassium can play a protective role against cancer. It is observed that while for a small amount of potassium the immune system fights well for averaged size tumours but it may fail for larger size tumours ((A)–(D)). On the other hand, when the amount of potassium is increased, the immune system gets stronger and it shows strength even to fight larger size tumours ((E)–(H)). It can be noted that although (E)–(H)) do not show the eradication of the disease but they certainly suggest a longer life for the patient. It has been noticed through numerous simulations that the continuous model (9) and the discrete model (17) mostly show similar dynamics but at times they may differ in their dynamics. A situation is illustrated in bifurcation diagram () when for large cancer intrinsic growth rate b, while model (9) shows survival of patient in cancer immunoediting equilibrium phase but model (17) suggests a chaotic dynamics having a period doubling route to chaos. Of course, the chaotic dynamics suggested by the discrete model (17) is a numerical result (a typical characteristic of discrete models) that does not have support from any experimental or clinical investigations till date but such results cannot be verified clinically or experimentally in future, who knows?
Acknowledgement
The authors wish to express their sincere gratitude to the anonymous referees whose forceful emphasis to base the concepts of the study on biological grounds has improved the manuscript a great deal. The comments of one anonymous referee particularly made us realize that there is no end to improvement.
Funding
The first author (MS) acknowledges the financial support for this work from the University Grants Commission, New Delhi under Major Research Project Grant No. 37-483/2009(SR).
References
- T. Boon and P. van der Bruggen, Humor tumor antigens recognized by T. lymphocytes, J. Exp. Med. 183 (1996), pp. 725–729. doi: 10.1084/jem.183.3.725
- F. Bravi, J. Polesel, C. Bosetti, R. Talamini, E. Negri, L. Dal Maso, D. Serraino, and C. La Vecchia, Dietary intake of selected micronutrients and risk of pancreatic cancer: An Italian case-control study, Ann. Oncol. 22 (2011), pp. 202–206. doi: 10.1093/annonc/mdq302
- M.R. Droop, Nutrient limitation in osmotrophic Protista, Am. Zool. 13 (1973), pp. 209–214.
- M.R. Droop, Some thoughts on nutrient limitation in algae, J. Phycol. 9 (1973), pp. 264–272.
- H. Ducobu, J. Huisman, R.R. Jonker, and L.R. Mur, Competition between a prochlorophyte and a cyanobacterium under various phosphorus regimes: Comparison with the Droop model, J. Phycol. 34 (1998), pp. 467–476. doi: 10.1046/j.1529-8817.1998.340467.x
- L. Edelstein-Keshet, Mathematical Models in Biology. McGraw-Hill, New York, NY, 1988.
- R. Efftimie, J.L. Bramson, and D.J.D. Earn, Interaction between the immune system and cancer: A brief review of non-spatial mathematical models, Bull. Math. Biol. 73 (2011), pp. 2–32. doi: 10.1007/s11538-010-9526-3
- M. Fan, I. Loladze, Y. Kuang, and J.J. Elser, Dynamics of a stoichiometric discrete producer-grazer model, J. Difference Equ. Appl. 11 (2005), pp. 347–364. doi: 10.1080/10236190412331335427
- U. Forys, J. Waniewski, and P. Zhivkov, Anti-tumor immunity and tumor anti-immunity in a mathematical model of tumor immunotherapy, J. Biol. Syst. 14 (2006), pp. 13–30. doi: 10.1142/S0218339006001702
- G. Frumento, T. Piazza, E. Di Carlo, and S. Ferrini, Targeting tumor-related immunosuppression for cancer immunotherapy, Endocine. Metab Immune Disorders Drug Targets 6 (2006), pp. 233–237.
- M. Girardi, D.E. Oppenheim, C.R. Steele, J.M. Lewis, E. Glusac, R. Filler, P. Hobby, B. Sutton, R.E. Tigellar, and A.C. Hayday, Regulation of cutaneous malignancy by γ δ T cells, Science 294 (2001), pp. 605–609. doi: 10.1126/science.1063916
- S.I. Grivennikov, F.R. Greten, and M. Karin, Immunity, inflammation, and cancer, Cell 140 (2010), pp. 883–899. doi: 10.1016/j.cell.2010.01.025
- B. Jansson, Intracellular electrolytes and their role in cancer etiology, in Cancer Modeling, J.R. Thompson and B.W. Brown, eds., Marcel Dekker, New York, NY, 1987, pp. 1–59.
- B. Jansson, Potassium, sodium and cancer: A review, J. Environ. Pathol. Toxicol. Oncol. 15 (1996), pp. 65–73.
- D.H. Kaplan, V. Shankaran, A.S. Dighe, E. Stockert, M. Aguet, L.J. Old, and R.D. Schreiber, Demonstration of an interferon γ -dependent tumor surveillance system in immunocompetent mice, Proc. Natl. Acad. Sci. USA 95 (1998), pp. 7556–7561. doi: 10.1073/pnas.95.13.7556
- Y. Kuang, J. Huisman, and J.J. Elser, Stoichiometric plant-herbivore models and their interpretation, Math. Biosc. Eng. 1 (2004), pp. 215–222. doi: 10.3934/mbe.2004.1.1i
- J. Liebig, Die organische Chemie in ihrer Anwendung auf Agrikultur und Physiologie, Friedrich Vieweg, Braunschweig, 1840.
- I. Loladze, Y. Kuang, and J.J. Elser, Stoichiometry in producer-grazer systems: Linking energy flow and element cycling, Bull. Math. Biol. 62 (2000), pp. 1137–1162. doi: 10.1006/bulm.2000.0201
- B. Menta and M. Agarwal, Cyclic oscillations in leukocyte count in chronic myeloid leukemia, Acta Haematol. 63 (1980), pp. 68–70. doi: 10.1159/000207373
- A. d'Onofri, Metamodeling tumor-immune system interaction, tumor evasion and immunotherapy, Math. Comput. Model. 47 (2008), pp. 614–637. doi: 10.1016/j.mcm.2007.02.032
- F. Pappalardo, P.L. Lollini, F. Castiglione, and S. Motta, Modeling and simulation of cancer immunoprevention vaccine, Bioinformatics 21 (2005), pp. 2891–2897. doi: 10.1093/bioinformatics/bti426
- C. Parish, Cancer immunotherapy: The past, the present and the future, Immunol. Cell Biol. 81 (2003), pp. 106–113. doi: 10.1046/j.0818-9641.2003.01151.x
- G. Pawelec, Q. Quyang, G. Colonna-Romano, G. Candoreb, D. Liob, and C. Carusob, Is human immunosenescence clinically relevant? Looking for immunological risk phenotypes, Trends Immunol. 23 (2002), pp. 330–332. doi: 10.1016/S1471-4906(02)02255-X
- I. Penn, Posttransplant malignancies, Transplant Proc. 31 (1999), pp. 1260–1262. doi: 10.1016/S0041-1345(98)01987-3
- F.P. Perera, Environment and cancer, Science 278 (1997), pp. 1068–1073. doi: 10.1126/science.278.5340.1068
- B. Quesnel, Dormant tumor cells as therapeutic target? Cancer Lett. 267 (2008), pp. 10–17. doi: 10.1016/j.canlet.2008.02.055
- S.A. Raza, G.M. Clifford, and S. Frenceschi, Worldwide variation in the relative importance of hepatitis B and hepatitis C viruses in hepatocellular carcinoma: A systematic review, Br. J. Cancer 96 (2007), pp. 1127–1134. doi: 10.1038/sj.bjc.6603649
- B. Seliger, Strategies of tumor immune evasion, BioDrugs 19 (2005), pp. 347–354. doi: 10.2165/00063030-200519060-00002
- B. Seliger, U. Ritz, and S. Ferrone, Molecular mechanisms of HLA class I antigen abnormalities following viral infection and transformation, Int. J. Cancer 118 (2006), pp. 129–138. doi: 10.1002/ijc.21312
- V. Shankaran, H. Ikeda, A.T. Bruce, J.M. White, P.E. Swanson, L.J. Old, and R.D. Schreiber, IFN γ and lymphocytes prevent primary tumor-development and shape tumor immunogenicity. Nature 410 (2001), pp. 1107–1111.
- A.G. Sheil, A.P. Disney, T.H. Mathew, B.E. Livingston, and A.M. Keogh, Lymphoma incidence, cyclosporine, and the evolution and major impact of malignancy following organ transplantation, Transplant Proc. 29 (1997), pp. 825–827. doi: 10.1016/S0041-1345(96)00151-0
- M.J. Smyth, K.Y. Thia, S.E. Street, E. Cretney, and J.A. Trapani, Differential tumor surveillance by natural killer (NK) and NKT cells, J. Exp. Med. 191 (2000), pp. 661–668. doi: 10.1084/jem.191.4.661
- M.J. Smyth, K.Y. Thia, S.E. Street, D. MacGregor, D.I. Godfrey, and J.A. Trapani, Perforin-mediated cytotoxicity is critical for surveillance of spontaneous lymphoma, J. Exp. Med. 192 (2000), pp. 755–760. doi: 10.1084/jem.192.5.755
- M.J. Smyth, D. Godfrey, and J. Tripathi, A fresh look at immnunosurveillance and immunotherapy, Nat. Immunol. 2 (2001), pp. 293–299. doi: 10.1038/86297
- R.W. Sterner and J.J. Elser, Ecological stoichiometry. Princeton University Press, Princeton, NJ, 2002.
- R.W. Sterner, J. Clasen, W. Lampert, and T. Weisse, Carbon: Phosphorous stoichiometry and food chain production, Ecol. Lett. 1 (1998), pp. 146–150. doi: 10.1046/j.1461-0248.1998.00030.x
- G. Sui, M. Fan, I. Loladze, and Y. Kuang, The dynamics of a stoichiometric plant-herbivore model and its discrete analog, Math. Biosc. Eng. 4 (2007), pp. 1–18.
- J. Urabe and R.W. Sterner, Regulation of herbivore growth by the balance of light and nutrients, Proc. Nat. Acad.Sci. USA 93 (1996), pp. 8465–8469. doi: 10.1073/pnas.93.16.8465
- M.D. Vesely, M.H. Kershaw, R.D. Schreiber, and M.J. Smyth, Natural innate and adaptive immunity to cancer, Annu. Rev. Immunol. 29 (2011), pp. 235–271. doi: 10.1146/annurev-immunol-031210-101324
- T.L. Whiteside, Immune suppression in cancer: Effects on immune cells, mechanisms and future therapeutic intervention, Sem. Cancer Bio. 16 (2006), pp. 3–15. doi: 10.1016/j.semcancer.2005.07.008
- B.F. Zamarron and W.J. Chen, Dual roles of immune cells and their factors in cancer development and progression, Int. J. Biol. Sci. 7 (2011), pp. 651–658. doi: 10.7150/ijbs.7.651
Appendix
Proof [Proof of Theorem 2.1] For the proof of this theorem we use arguments similar to those in Appendices B and C of Loladze et al. [Citation18]. We assume that there is time t1>0, such that a trajectory with initial conditions in Δ touches the boundary of the trapezoid for the first time. Since the boundary consists of four sides, four cases are possible designated as x(t1)=0 (left border), x(t1)=k (right border), y(t1)=0 (bottom border) and
(top border) in [Citation18].
Since our model differs only in equation for y from that of the model of Loladze et al. [Citation18], we need to prove only that any trajectory initiated in Δ would neither cross the bottom border nor the top border. First we assume that a trajectory touches or crosses the bottom border, i.e. y(t1)=0, then (see, Equation (10b))
Thus it implies
. This excludes the possibility that a trajectory touches or crosses the bottom border or the corners (0, 0) and (k, 0). Now we assume that a trajectory touches or crosses the top border i.e.
Since for all
, it follows that
Substituting
from Equation (A1) into Equation (9a), it becomes
On the other hand, Equation (9b) gives,
From (A1) and (A3)
Using Equations (A4) and (A5) and the fact that e<1, we obtain
under the assumptions of the theorem. This contradicts Equation (A2) and hence the proof.