
 ?Mathematical formulae have been encoded as MathML and are displayed in this HTML version using MathJax in order to improve their display. Uncheck the box to turn MathJax off. This feature requires Javascript. Click on a formula to zoom.
ABSTRACT
HIV-infected patients who receive treatment survive for some years after they have acquired the disease. The received treatment causes sustained reduction of viral reproduction by improving the immune function, leading to prolonged progression period to AIDS development. This prolonged progression period has created variability in survival times that affects estimates produced using mathematical models that do not include delay in disease related mortality. This paper investigates the effect of including delay in AIDS death occurrence in HIV/AIDS transmission models. A simple mathematical model with two stages of HIV progression is developed and extended to include time delay in the occurrence of AIDS deaths. Numerical simulations indicate that time delay changes the mortality curves considerably but has less effect on the proportion of infectives. The study highlights the importance of incorporating delay in models of HIV/AIDS for the production of accurate HIV/AIDS estimates.
1. Introduction
Developments and improvements in care and treatment services to HIV/AIDS patients, genetic heterogeneity, and socio-economic aspects of life contribute to increased differences in survival times between individuals. These differences in survival times lead to a situation where no common survival period is available to all HIV-infected individuals.
The survival times of a HIV/AIDS-infected individual depend on factors such as gender, treatment, economic status, nutrition, biological make up, and the region where the person lives. In sub-Saharan Africa, a region where the large majority of HIV is transmitted heterosexually and the epidemic is more mature, there is a substantial difference in age of infection between men and women, with women becoming infected at an earlier age [Citation13, Citation20, Citation21]. Furthermore, an approximate of 9.4 years survival time for women and 8.6 years for men [Citation5] has been estimated by the UNAIDS. Treatment of infected persons has also shown to delay individuals developing AIDS through reduction of the number of copies of viruses in the body [Citation9]. This has led to an increase of survival rates of HIV positive individuals.
Mathematical models used for prediction of the spread of HIV/AIDS are constrained by the differences in survival times that exist in HIV-infected individuals. The Weibull distribution has commonly been used as an incubation period distribution of HIV survival times [Citation14, Citation18]. Other forms of distribution functions have been used to explain the survival probabilities of HIV-infected individuals under which this probability decreases as one progresses from HIV infection to death [Citation3, Citation5]. These distribution functions fit well to data within a short period from infection. However, due to the introduction of an effective antiretroviral therapy (ART), the incubation period defined with approximately parameterized Weibull distribution could form a different shape if survival is prolonged. Modelling work has also assumed an exponential distribution of the infectious period [Citation1, Citation2, Citation17]. Exponential distribution functions assume that the chance of dying due to AIDS within a given time interval is constant, regardless of time since infection.
To accurately model survival, delay equations have been used by some authors in population studies and epidemiology [Citation6, Citation10] and with application to HIV spread models [Citation4, Citation7, Citation8, Citation12]. However, none of them have included the delay in HIV death occurrences or have provided a general and simple framework for modelling arbitrary survival times of newly infected individuals. In this paper, a mathematical model that includes the above features is formulated and simulated to investigate the impact of delayed death in HIV estimates. In particular, we investigate the effect of including time delay in the occurrence of AIDS death of HIV-infected individuals by comparing to a model without delay in HIV/AIDS death.
2. Methods
A continuous-time mathematical model of HIV/AIDS transmission that includes the effect of stages of HIV progression [Citation11] is extended to incorporate delay in AIDS death occurrences. The model consists of one susceptible class, , which forms the larger part of the population, and two infected classes: those in the primary stage,
, and those who are in the asymptomatic or late stage,
. The model assumes that AIDS-related mortality occur exponentially and that the rate of dying in the late stage of the disease is constant [Citation11]. This property is shown by the term
in the third equation of the model as shown below:
(1)
(1) with initial conditions
, and
. The total population
is given by
As described in more detail in [Citation11], the population dynamics of the model in Equation (Equation1(1)
(1) ) are governed by the recruitment rate into the susceptible population, Λ, of new individuals into the susceptible population, exit through natural mortality at a rate μ and through the rate at which infected individuals in
die of the disease, γ. The parameters
and
are rates of transmission when the interaction between the susceptible and infected individuals,
and
occurs.
always [Citation16], and ρ is the progression rate from
to
. In the absence of the disease, the model assumes that the total population grows or decreases exponentially.
2.1. Modelling delay in HIV/AIDS deaths
To extend model (Equation1(1)
(1) ) to include delay in AIDS-related death, we assume that mortality of an infected individual is dependent on the survival period, τ. We assume that individuals in the asymptomatic stage of HIV infection,
survive for a period τ years before they die. In this case, we modify the death term
in the third equation of model (Equation1
(1)
(1) ) to become
.
The last equation in model (Equation1(1)
(1) ) becomes
(2)
(2) which describes the dynamics of the group of individuals in the asymptomatic stage. The dynamics of the disease in the population with a time delay in the AIDS-related mortality is given by the following system of nonlinear differential equations:
(3)
(3) All parameters are positive. The dynamics of the population change according to
(4)
(4)
All parameters are positive (Table ). Since the total population is variable, we define ,
, and
. Converting the system in (Equation3
(3)
(3) ) to proportions gives
(5)
(5) where
(6)
(6)
(7)
(7) and
(8)
(8)
Table 1. Description and values of parameters of the model.
Equation (Equation4(4)
(4) ) also becomes
(9)
(9) integrating to
(10)
(10)
Model (Equation5(5)
(5) ) is epidemiologically and mathematically well posed in the region
defined by
(11)
(11)
Theorem 2.1.
If the initial conditions of system (Equation5(5)
(5) ) lie in region
then (Equation5
(5)
(5) ) has a unique solution
and
which remains in
for all time
.
Proof.
The right-hand side of the system (Equation5(5)
(5) ) is continuous with continuous partial derivatives in
; therefore (Equation5
(5)
(5) ) has a unique solution that exist for all time. It remains to show that
is forward-invariant. We see from system (Equation5
(5)
(5) ) that if z=0, then
; if
, then
; if
, then
. Therefore, all solutions of the system of equations (Equation (Equation5
(5)
(5) )) are contained in the region
.
Model (Equation5(5)
(5) ) is quite complex for analysis. We calculate the equilibrium points and carry out analysis of certain behaviour numerically.
2.2. Equilibrium points
Definition 2.1.
If as the system in equation (Equation5
(5)
(5) ) attains an equilibrium state, then we can define
and
. Since
and
at equilibrium, then, by Equation (Equation7
(6)
(6) ),
Setting the system in Equation (Equation5(5)
(5) ) to zero at the equilibrium and applying Definition 2.1, the disease-free equilibrium
is found.
From the third equation of (Equation5(5)
(5) ), and by Definition 2.1,
is given
(12)
(12)
Substituting Equation (Equation12(12)
(12) ) in the first equation of (Equation5
(5)
(5) ) gives
(13)
(13) and
which approximates the endemic equilibrium point.
3. Model parameterization
We parameterize the model with data from the literature. Because of the variations in data from studies, a single value was chosen from a range of values and used for the numerical simulation of the model.
Perelson and Nelson [Citation15] and Witten and Perelson [Citation23] have shown that an infected individual stays 10–15 years in the asymptomatic stage of HIV progression before developing AIDS. In the AIDS stage, an infected individual stays for about 1–2 years [Citation22]. In this regard,the survival period of a HIV-infected person can extent to more than 10 years.
Understanding how infectious a person can be when infected and estimating the rate at which this person is able to transmit HIV to others has been difficult in the scientific community since one cannot perform experiments. Rapatski et al. [Citation19] have shown using mathematical models (finding the best fit to data) that transmission rate of the virus by stage differs when an infected individual progresses from one stage to another. The findings from the model showed that infected persons in the primary stage are 12 times more likely to infect susceptible than those in the asymptomatic stage. On the other hand, in communities such as sub-Saharan Africa where heterosexual transmission is the main mode of HIV transmission, a Rakai study by Wawer et al. [Citation22] and Quinn et al. [Citation16] presented an analysis that provided the first empirical data on the substantial variation in transmission by stage of HIV infection after seroconversion. These studies also showed that the rate of HIV transmission within the first two-and-a-half months was almost 12 times higher than that observed in chronic couples. This presents observed evidence that the HIV transmission rate for those individuals in the primary stage of HIV progression () is higher than that of individuals in the asymptomatic stage (
).
The rate of progression from to
, ρ, is assumed to be constant and is derived from time spent in the primary stage by a recently infected individual (
). Perelson and Nelson [Citation15] and Witten and Perelson [Citation23] described the waiting times in the first stage of HIV progression to be between 2 and 10 weeks. Asymptomatic individuals stay in
for 10–15 years [Citation15, Citation23].
In sub-Saharan Africa, majority of the young adults are expected to live an average of 50 years [Citation24], which makes the mortality rate, years−1. We also assume in the simulations that 200 individuals are recruited into the population each year. We summarize these parameter values in Table .
4. Results
The model that incorporated delay in the occurrence of AIDS mortality was simulated to numerically study the differences in survival times. Results from this model were compared to numerical results of the model that did not consider delay to gain insights into the differences between them.
Figure presents results for different survival periods. Results show oscillatory behaviour in all numerical results generated using the model with delay in AIDS mortality. However, this oscillatory behaviour decreases with increasing time as the equilibrium point is approached. In addition, the survival period has an impact on the duration to reach the equilibrium points. The longer the infected individual survives the asymptomatic stage, the longer it takes for the equilibrium point to be attained. The amplitude of the oscillations increases with increasing survival period. This behaviour was evident in all sub-plots.
Figure 1. Effect of the survival periods, τ, for the model with delay in death occurrence. (a) Susceptible people (b) Proportion of infected people in the primary stage, (c) Proportion of infected people in the asymptomatic stage,
(d) AIDS mortality rates and (e) Total population. Parameters:
,
,
,
,
year−1, and
year−1.
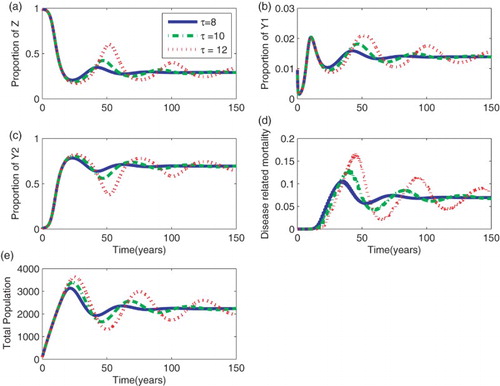
Given that the transmission rate was the same for the different scenarios of the survival periods, the rise of the curves in ,
, and the total population does not differ for the different values of τ. Similarly, the proportion of the susceptible population decreased at the same rate for all the different values of the survival times.
Results show that, as the survival period is increased, predictions show roughly similar results within a short period of about t=20 years measured from the start of the epidemic for the proportion of infected individuals who are in the primary stage, asymptomatic stage, and the total population. During this period, deaths due to HIV/AIDS do not occur and people still survive although they are infected. Differences arise in the proportion of infected individuals who are in the primary stage, asymptomatic stage, and the total population after t=20 years. As τ is increased, the proportion of infected individuals in the primary stage decreases, a dynamic behaviour that is different from that of those in the asymptomatic stage.
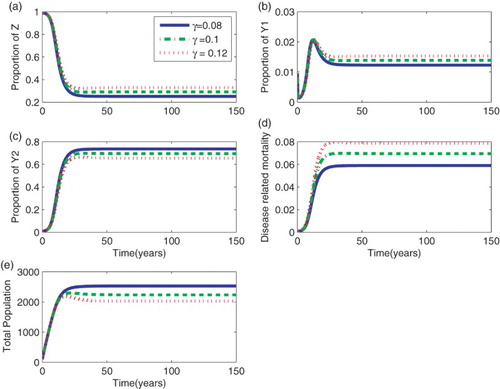
As expected, after the initial rise, in the proportion of infected population in the asymptomatic stage, more individuals accumulate when the survival period in that particular group is high. Similarly, the mortality curve indicates that, although there is a delay in the occurrence of deaths, more people die when τ is high. Similar dynamics were also observed for different values of γ in the model without delay (Figure ).
Figure 2. Effect of the death rate, γ, for the model without delay in the occurrence of deaths. (a) Susceptible people (b) Proportion of infected people in the primary stage, (c) Proportion of infected people in the asymptomatic stage,
(d) AIDS mortality rates and (e) Total population. Parameters:
,
,
,
, and
year−1.
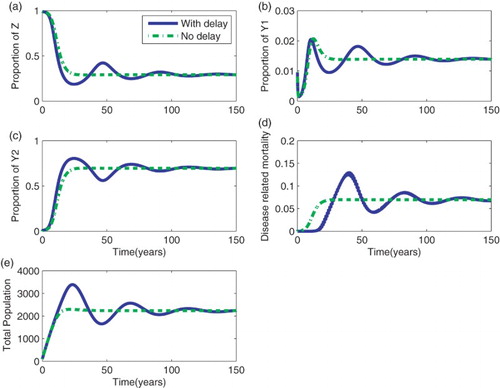
The effect of a delay in AIDS mortality is assessed by comparing the results of the model with and without a delay (Figure ). The model with delay shows oscillatory behaviour than the model without delay. This is due to the time lag introduced in the , a sub-population that accumulates infected individuals. The initial rise of infected individuals in the primary and asymptomatic stage is not the same for the two models. The rise is sharp for the model with delay compared to that without delay. Unlike infected groups, mortality is initially high for the model without delay. At later times, disease-related mortality is high, though with an oscillatory behaviour. Although the model with delay reaches the equilibrium point later when compared to the model without delay, numerical results in Figure show that the equilibrium points for both models is the same, confirming that Definition 2.1 is correct.
Figure 3. A comparison between the model with and without delay. (a) Susceptible people (b) Proportion of infected people in the primary stage, (c) Proportion of infected people in the asymptomatic stage,
(d) AIDS mortality rates and (e) Total population. Parameters:
,
,
,
,
year−1,
, and
.
5. Discussion and concluding remarks
This work has attempted to describe the dynamics of HIV in a population and the role played by introducing a time delay in the occurrence of mortality. A mathematical model that divides the infected group into two groups – primary and asymptomatic stages – were formulated. This model was extended to include time delay in HIV/AIDS-related mortality. In the extended model, we assumed that AIDS deaths have a profound effect on both the spread of the disease and predictions. We altered the mechanism of AIDS deaths occurrence and consider an explicit constant time delay for all infected individuals from their initial infection to death.
We have proved that both models are mathematically and epidemiologically well-posed. Furthermore, we have analyzed the existence of disease-free equilibrium points and proved the existence of endemic equilibrium points.
The results from this work indicate that models of death strongly determine disease-related mortality. AIDS mortality for the model with delay was found to be far higher than that in the model without delay. These results suggest that, if one is to do projection of AIDS mortality using mathematical models, then, including a delay in the occurrence of mortality would make a significant impact on the results. The proportion of new infections and the prevalence of the disease are mainly determined by transmission rates in the early stages of the epidemic rather than the extension of the survival period.
The models with and without delay in survival periods did not show large differences in prevalence and in the proportion of infected individuals in the primary stage. However, small oscillatory behaviour occurred in the solutions. The hypothesis that increasing HIV-infected individuals' survival period increases the proportion of infected individuals in the population and facilitates continued spread of HIV in the population was also investigated. Findings have shown that HIV survival has a low impact on the spread of HIV. Increasing survival time of HIV-infected individuals may increase prevalence and new infections but decrease new infections and mortality in a long term. This happens due to the accumulation of infected individuals in the asymptomatic group. Similar findings are also reported by Mukandavire et al. [Citation12], who observed that prolonged incubation periods of HIV/AIDS enlarges the epidemic in the model delay.
Results have been based on estimated parameter values which may however not apply in some cases. A more realistic model would allow for the possibility that parameter values are not constant over time, and are different in different regions. The assumption that the total population is not constant has led to increased nonlinearity of the terms in the proportion forms of the models. This study is also limited by having few parameters in the models. For example, instead of studying the effect of changing survival periods of infected individuals in a general case, it could be interesting to include parameters that describe the effects due to treatment programmes directly. The time delay introduced in the model assumes that people die following a step function distribution which is an extreme case.
In general, this work provides an understanding of how difficult it can be to produce quality HIV/AIDS estimates using mathematical models. However, a model that incorporates delay in mortality would be an added advantage as the coverage of care and treatment programs is now on the rise.
Acknowledgments
This work was developed from my MSc dissertation submitted to the University of Stellenbosch, South Africa. The author acknowledges the helpful discussions she had with Fritz Hahne and grateful to the anonymous reviewers for their reviews that improved the manuscript.
Disclosure statement
No potential conflict of interest was reported by the authors.
Additional information
Funding
References
- F. Baryarama, L.S. Luboobi, and J.Y.T. Mugisha, Periodicity of the HIV/AIDS epidemic in a mathematical model that incorporates complacency, Amer. J. Infectious Diseases 1(1) (2005), pp. 55–60. doi: 10.3844/ajidsp.2005.55.60
- F. Baryarama, J.Y.T. Mugisha, and L.S. Luboobi, An HIV/AIDS model with variable force of infection and its application to the epidemic in uganda, Amer. J. Appl. Sci. 2(9) (2005), pp. 1274–1278. doi: 10.3844/ajassp.2005.1274.1278
- T. Buettner, The UN population division's approach to modelling demographic impact of the HIV/AIDS pandemic. Technical report, United Nations Population Division New York, 2002.
- K. Cooke, P. Van den Driessche, and X. Zou, Interaction of maturation delay and nonlinear birth in population and epidemic models, J. Math. Biol. 39 (1999), pp. 32–352. doi: 10.1007/s002850050194
- N.C. Grassly, Improved methods and assumptions for estimation of the HIV/AIDS epidemic and its impact: recommendations of the UNAIDS Reference group on estimates, modelling and projections. Technical report, Imperial College of Science, Technology and Medicine, Norfolk Place, London, 2002.
- H.W. Hethcote and P. Van den Driessche, Some epidemiological models with nonlinear incidence, J. Math. Biol. 29 (1991), pp. 271–287. doi: 10.1007/BF00160539
- H.W. Hethcote and P. Van den Driessche, An SIS epidemic model with variable population size and a delay, Math. Biol. 34 (1995), pp. 177–194. doi: 10.1007/BF00178772
- H.W. Hethcote and P. Van den Driessche, Two SIS epidemiologic models with delays, J. Math. Biol. 40 (2000), pp. 3–26. doi: 10.1007/s002850050003
- M. Kgosimore and E.M. Lungu, The effect of vaccination and treatment on the spread of HIV/AIDS, Biol. Syst. 12(4) (2004), pp. 399–417. doi: 10.1142/S0218339004001294
- Y. Kuang and J.W.-.H. So, Analysis of a delayed two – stage population model with space – limited recruitment, Appl. Math. 55(6) (1995), pp. 1675–1696.
- A.M. Lutambi, Modelling the impact of stages of HIV progression on estimates, Adv. Infectious Dis. 5 (2015), pp. 101–113. doi: 10.4236/aid.2015.53012
- Z. Mukandavire, W. Garila, and C. Chiyaka, Asymptomatic properties of an HIV/AIDS model with a time delay, J. Math. Anal. Appl. 330(2) (2007), pp. 916–933. doi: 10.1016/j.jmaa.2006.07.102
- National AIDS Control Programme, HIV/AIDS/STI surveillance report. Technical Report 18, Ministry of Health, 2004.
- H. Nishiura, H. Yanai, T. Yoshiyama, and M. Kakehashi, Simple approximate backcalculation method applied to estimate HIV prevalence in Japan, J. Infectious Dis. 57 (2004), pp. 133–135.
- A.S. Perelson and P.W. Nelson, Mathematical Analysis of HIV-1 Dynamics in Vivo, Soc. Ind. Appl. Math. 41(1) (1999), pp. 3–44.
- T.C. Quinn, M.J. Wawer, N. Sewankambo, D. Serwadda, C. Li, F.W. Mangen, M.O. Meehan, T. Lutalo, and R.H. Gray, Viral load and heterosexual transmission of human immunodeficiency virus type 1, New England J. Med. 342(13) (2000), pp. 921–929. doi: 10.1056/NEJM200003303421303
- A.S.R.S. Rao, Mathematical modelling of AIDS epidemic in India, Curr. Sci. 84(9) (2003), pp. 10.
- A.S.R.S. Rao and M. Kakehashi, Incubation-time distribution in back-calculation applied to HIV/AIDS data in India, Math. Biosci. Eng. 2(2) (2005), pp. 263–277. doi: 10.3934/mbe.2005.2.263
- B.L. Rapatski, F. Suppe, and J.A. Yorke, HIV epidemics driven by late disease stage transmission, J Acquir Immune Defic Syndr 38(3) (2005), pp. 241–253.
- O. Shishana, T. Rehle, L.C. Simbayi, W. Parker, K. Zuma, A. Bhana, C. Connolly, S. Jooste, and V. Pillay, South African National HIV prevalence, HIV incidence, behaviour and communication survey, 2005. Technical report, HSRC Press, Cape Town, 2005.
- Tanzania Commission for AIDS (TACAIDS), National Bureau of Statistics (NBS), and ORC Macro. 2005. Tanzania HIV/AIDS indicator survey 2003–2004. Technical report, TACAIDS, NBS, and ORC Macro, Calverton, MD, 2005.
- M.J. Wawer, R.H. Gray, N.K. Sewankambo, D. Serwadda, X. Li, O. Laeyendecker, N. Kiwanuka, G. Kigozi, M. Kiddugavu, T. Lutalo, F. Nalugoda, F.W. Mangen, M.P. Meehan, and T.C. Quinn, Rates of HIV-1 Transmission per Coital Act, by stage of HIV-1 infection, in Rakai, Uganda, J. Infectious Dis. 191 (2005), pp. 1391–1393. doi: 10.1086/429411
- G.Q. Witten and A.S. Perelson, Modelling the cellular-level interaction between the immune system and HIV, South Afr. J. Sci. 100 (2004).
- J. Adetunji and E.R. Bos, Levels and trends in mortality in Sub-Saharan Africa: An Overview, in Disease and mortality in Sub-Saharan Africa, D.T. Jamison, R.G. Feachem, M.W. Makgoba, E.R. Bos, F.K. Baingana, K.J. Hofman, and K.O. Rogo. eds., World Bank, Washington, DC, 2006, pp. 11–14.