
 ?Mathematical formulae have been encoded as MathML and are displayed in this HTML version using MathJax in order to improve their display. Uncheck the box to turn MathJax off. This feature requires Javascript. Click on a formula to zoom.
ABSTRACT
HIV latency remains a major obstacle to viral elimination. The activation rate of latently infected cells may depend on the age of latent infection. In this paper, we develop a model of HIV infection including age-structured latently infected cells. We mathematically analyse the model and use numerical simulations with different activation functions to show that the model can explain the persistence of low-level viremia and the latent reservoir stability in patients on therapy. Sensitivity tests suggest that the model is robust to the changes of most parameters but is sensitive to the relative magnitude of the net generation rate and the long-term activation rate of latently infected cells. To reduce the sensitivity, we extend the model to include homeostatic proliferation of latently infected cells. The new model is robust in reproducing the long-term dynamics of the virus and latently infected cells observed in patients receiving prolonged combination therapy.
1. Introduction
HIV-1 replication in many infected individuals can be controlled by antiretroviral therapy consisting of three to five drugs. Although treatment can suppress the plasma viral load to below the detection limit of standard assays, that is, 50 viral RNA copies/ml, it cannot cure HIV-infected patients. The plasma viral load in patients on effective antiretroviral therapy has a multiphasic decay to below the detection limit. The initial decay phase is rapid with a half life of approximately one day, followed by a slower second-phase decay with a half life of 1–4 weeks [Citation33], in which the plasma HIV RNA level approaches the detection limit. The third phase of the viral load decay below the detection limit is extremely slow with a half life of months or years [Citation37].
Long-term low viral load persistence in patients on antiretroviral therapy is due to the virus persisting in cellular compartments or reservoirs. The best known reservoir consists of latently infected CD4+ T cells [Citation3]. These resting memory CD4+ T cells are neither interfered with antiretroviral therapy nor affected by immune responses but can produce virus when they are activated by relevant antigens and therefore keep the virus from being eliminated. Because of the lack of sensitive testing methods measuring very low levels of viral RNA and latently infected cells in patients, the decay characteristics of the plasma viremia and the latent reservoir in the third phase remain unclear. The estimate of the half life of the latent reservoir had a range from 4.6 months to 44 months (see review in ref. [Citation37]). In addition to being an obstacle to viral eradication, the existence of this stable viral reservoir has been found to have important clinical implications such as limited treatment options due to the accumulation of drug-resistant viral variants residing in the latent reservoir [Citation45].
Mathematical models have been developed to study the decay dynamics of the latent reservoir. Muller et al. [Citation29] introduced a simple model that considers the heterogeneity of latent cell activation assuming 100% effective combination therapy. Kim and Perelson [Citation25] developed an ordinary differential equation model that includes bystander proliferation and decreasing activation of latently infected cells. To explain the stability of the latent reservoir, low viral load persistence, and occasional appearance of transient viral load measurements above the detection limit (the so-called viral blips), asymmetric cell division [Citation38], programmed expansion and contraction [Citation36], and homeostatic proliferation [Citation36] of latently infected cells upon activation have been proposed and tested by mathematical models. The hypothesis of homeostatic proliferation of latently infected cells was later experimentally confirmed [Citation7]. Other models, including stochastic models that study the dynamics of the latent reservoir or viral blips, can be found in refs. [Citation1,Citation2,Citation9,Citation16,Citation24,Citation43,Citation50,Citation55] (see reviews in [Citation31,Citation37]).
The major latent reservoir consists of resting memory CD4+ T cells. Antigen specificity plays an important role in the activation of these latently infected cells. Cells specific to frequently encountered antigens can be activated quickly while cells specific to rarely encountered antigens need more time to be activated. Thus, the more time elapsed since the establishment of latent infection, the more likely the latently infected cell is specific to a rarer antigen, and the less likely it is to be activated. The population of latently infected cells will gradually shift towards cells with a small chance of activation, that is, cells specific to increasingly rare antigens [Citation47,Citation48]. In this paper, we develop a model including latently infected cell activation on the basis of the models in refs. [Citation25,Citation36]. We incorporate the time elapsed since latent infection (i.e. the age of latent infection) into a latent infection model that was introduced by Perelson et al. [Citation33] to study the second phase viral load decline during combination therapy. The activation rate of latently infected cells is assumed to depend on the age of latent infection. The basic reproductive number is derived and stability results of the infection-free and infected steady states are obtained. Different activation rate functions are used in simulations. We perform sensitivity tests on a number of parameters to determine the effect of parameters on the dynamics of viral load and the latent reservoir. We also modify the model by including homeostatic proliferation of latently infected cells to explore whether the model can robustly explain the persistence of low viral load and the latent reservoir stability in patients receiving prolonged antiretroviral therapy.
2. Model description and preliminary results
We develop a model including latently infected cell activation, as given by the following system of differential equations (Equation1(1)
(1) ). In the model,
is the concentration of uninfected CD4+ T cells at time t,
denotes the concentration of latently infected T cells with latency age a (i.e. the time elapsed since the establishment of latency is a) at time t,
is the concentration of productively infected cells, and
represents the concentration of virions in plasma at t. The parameter λ is the production rate of uninfected CD4+ T cells, d is the per capita death rate of uninfected cells, and k is the infection rate of the target cell by virus. We assume that a small fraction (f) of infected cells lead to latency and that the remaining become productively infected cells. Productively infected cells die at a rate constant δ per cell. N is the viral burst size, which is the total number of virions released by one infected cell in its lifespan, and c is the viral clearance rate.
(1)
(1)
In addition to the contribution from new infection (fkV T), latently infected cells can also be generated by (bystander) proliferation [Citation25]. Instead of parameterizing the proliferation rate and the death rate of latently infected cells separately, we lump these two parameters into one parameter, that is, , where ρ is the proliferation rate and
is the death rate. Therefore, γ represents the net generation rate of latently infected cells.
The pool size of latent reservoir decreases when latently infected cells are activated to become productively infected cells. As shown in Strain et al. [Citation47,Citation48], the latently infected cell population is very likely to be heterogeneous: cells specific to frequently encountered antigens may be preferentially activated and quickly removed from the reservoir, leaving latently infected cells specific to rarely encountered antigens. Thus, the activation rate depends on the time elapsed since latent infection and we assume an age-dependent activation rate in the model. The integral of
over age gives the total number of productively infected cells gained per unit time from the activation of latently infected cells.
Both the proliferation rate ρ and the death rate of latently infected cells can be assumed to be age-dependent without introducing additional difficulties in the analysis and simulation of age-structured models [Citation14,Citation39,Citation41,Citation44,Citation49]. However, for simplicity we assume that they are constant and only focus on the age-dependent activation rate
. During proliferation of latently infected cells, a mother cell divides and gives rise to two daughter cells. These daughter cells are assumed to have the same age of being latently infected as the mother cell (note that a is the time elapsed since latent infection; it is not necessarily the biological age of an infected cell). Moreover, the reason why we are interested in the latent infection age is that the time since infection may affect the activation rate. The two daughter cells are initially in the same place as the mother cell and have the same chance as the mother cell (if not divided) to encounter with their specific antigen.
Two classes of antiretroviral drugs are mainly used in highly active antiretroviral therapy. One is the reverse transcriptase (RT) inhibitor, which can block the reverse transcription from viral RNA to DNA and thus reduces viral infection. The other is the protease inhibitor, which prevents HIV protease from cleaving the viral polyprotein into functional units, causing infected cells to produce immature virions that are non-infectious. Let and
denote the efficacy of RT inhibitor and protease inhibitor, respectively (
). The value 0 represents no effect and 1 means 100% effective. To study the effect of protease inhibitor, we divide the virus population into two classes: infectious virus
and non-infectious virus
. The model with combination therapy is given by the following system of differential equations (Equation2
(2)
(2) ).
(2)
(2)
Notice that model (Equation1(1)
(1) ) is a special case of model (Equation2
(2)
(2) ) when no drug treatment is given (i.e.
). System (Equation2
(2)
(2) ) can be reformulated as a system of Volterra integral equations. For the ease of simplicity, we introduce the following notations:
(3)
(3) Because the latent reservoir is relatively stable or decays very slowly during treatment, we assume that
.
is an exponential probability density function (not normalized), representing the probability of an infected cell staying in the latent state until age a.
For convenience we introduce a new variable to describe the rate at which an uninfected CD4+ T cell becomes infected at time t in the absence of drug therapy.
(4)
(4) Integrating the
equation in system (Equation2
(2)
(2) ) along the characteristic lines,
constant, we get the following solution
(5)
(5) Substituting Equation (Equation5
(5)
(5) ) into the
equation in (Equation2
(2)
(2) ), we have
(6)
(6) where
(7)
(7) It is clear that
as
. Integrating the
equation in (Equation6
(6)
(6) ) and changing the order of integration, we have
(8)
(8) where
(9)
(9) For the derivation of Equation (Equation8
(8)
(8) ) we used the following calculation
Similarly, by integrating the T and equations in (Equation2
(2)
(2) ) we obtain
(10)
(10)
(11)
(11)
Equations (Equation8(8)
(8) ), (Equation10
(10)
(10) ) and (Equation11
(11)
(11) ), with
replaced by
, form a system of Volterra integral equations, which is equivalent to the original system (Equation2
(2)
(2) ). Hence, for determining the existence and uniqueness of the solution we only need to consider the following system
(12)
(12) where
and
are given in Equation (Equation9
(9)
(9) ).
3. Analysis of the system (2)
In this section we provide analytic results on the existence and uniqueness of the positive solution, calculate all possible steady states, and show their stability for the system (Equation2(2)
(2) ) or the equivalent system (Equation12
(11)
(11) ).
3.1. Existence of positive solutions
Let , where
represents the transpose of a vector. System (Equation12
(11)
(11) ) can be written as
where
is a continuous function from
to
, κ is the following
matrix with entries being locally integrable functions on
,
and g is defined by
It is clear that
,
, and
. From Theorem 1.1 in Gripenberg et al. [Citation21], Section 12.1, there is a unique solution of the system given an initial condition and the solutions depend continuously on the initial conditions.
To see whether all solutions remain non-negative for positive initial value, we use the following system (see Equation (Equation6(6)
(6) )) that is also equivalent to system (Equation2
(2)
(2) ).
(13)
(13) where
is given in Equation (Equation7
(7)
(7) ) and
,
.
We proceed to prove that ,
and
are all non-negative for all t>0 and for all non-negative initial value. Suppose that there exists a
such that
,
,
, and
for
. Then from the
equation in (Equation13
(12)
(12) ) we have
This shows that
will never become negative for t>0. Similarly, we can prove that
and
for all t>0 and for all non-negative initial value.
3.2. Steady states and stability
We use the system (Equation13(12)
(12) ) for our stability analysis. According to Gripenberg et al. [Citation21], Section 15.1, any equilibrium of system (Equation13
(12)
(12) ), if it exists, must be a constant solution of the limiting system.
(14)
(14)
System (Equation14(13)
(13) ) has two constant solutions: the infection-free steady state
and the infected steady state
where
(15)
(15) with
given in Equation (Equation3
(3)
(3) ).
It is clear that if and only if
or
, where
(16)
(16) The infected steady state (Equation15
(14)
(14) ) is feasible if and only if
. Notice that
is the target cell population in the absence of infection, k and c are the cell infection and viral clearance rate, respectively, 1−f is the fraction of productive infection that leads to viral production, and
represents the contribution to productively infected cells from activation of latently infected cells. Thus,
gives the effective reproductive ratio of the virus under drug treatment.
We now study the stability of steady states. Using the linearization process [Citation20], we obtain the following linearized system of (Equation14(13)
(13) ) about any equilibrium, denoted by
.
(17)
(17) The corresponding characteristic equation is
(18)
(18) where ζ is an eigenvalue and
denotes the Laplace transform of
, that is
We will use this characteristic equation to study the stability of steady states.
Let us first consider the infection-free steady-state . The following result suggests that the virus is predicted to die out if the effective reproductive ratio is less than 1.
Theorem 3.1.
The infection-free steady-state is locally asymptotically stable if
and it is unstable if
.
Proof.
Substituting the steady-state for the equilibrium point
into the characteristic Equation (Equation18
(17)
(17) ), we have
(19)
(19)
that is,
(20)
(20) Using the effective reproductive ratio
defined in Equation (Equation16
(15)
(15) ), the above characteristic equation can be rewritten as
(21)
(21) One negative root of Equation (Equation21
(20)
(20) ) is
and all the other roots are determined by the equation
(22)
(22) Note that
for all complex roots ζ with non-negative real parts. It follows that
. Hence, the modulus of the right-hand side of Equation (Equation22
(21)
(21) ) is less than
when
. Since the modulus of the left-hand side of Equation (Equation22
(21)
(21) ) is always greater than
when the real part of ζ is non-negative, we conclude that all roots of (Equation22
(21)
(21) ) have negative real parts if
. It follows that
is locally asymptotically stable when
.
In the case of , let
Thus, any real root of
is also the root of Equation (Equation22
(21)
(21) ). Recognizing that
we know
has at least one positive root
, which is a positive eigenvalue of the characteristic equation (Equation20
(19)
(19) ). This shows that the infection-free steady state is unstable when
. This finishes the proof of the theorem.
Next, we consider the stability of the infected steady-state . As noted earlier, this steady state exists if and only if
. The following result suggests that the virus infection will be established if the effective reproductive ratio is greater than 1.
Theorem 3.2.
The infected steady-state is locally asymptotically stable if
.
Proof.
Substituting the infected steady-state for the equilibrium point
into the characteristic equation (Equation18
(17)
(17) ), we have the following simplified equation after tedious calculation
(23)
(23) Notice that the steady state of infected virus in Equation (Equation15
(14)
(14) ),
, can be written as the following form in terms of the effective reproductive ratio
(24)
(24) Substituting
in Equation (Equation24
(23)
(23) ) and
in Equation (Equation15
(14)
(14) ) into Equation (Equation23
(22)
(22) ), we get
(25)
(25)
Now we will exclude the possibility that (Equation25(24)
(24) ) has a complex root λ with a non-negative real part. We prove this by contradiction. Suppose that ζ is a root with a non-negative real part. It is clear that
and
. From the assumption
, we also have
. Thus the modulus of the left-hand side of Equation (Equation25
(24)
(24) ) is greater than
, while the modulus of the right-hand side of Equation (Equation25
(24)
(24) ) is less than or equal to
. This leads to a contradiction. Therefore, the characteristic equation (Equation25
(24)
(24) ) has no roots with non-negative real parts. The theorem is proved.
4. Numerical results
4.1. Parameter values
We fixed most of the parameters based on existing experimental data and our previous modelling studies for model simulations [Citation36–38]. Before HIV infection, the CD4+ T cell level is approximately cells per µl [Citation4]. We changed the unit to cells/ml and assumed the initial CD4+ T cell level to be
cells/ml before infection. The death rate of uninfected CD4+ T cells was assumed to be d=0.01 day−1 [Citation32]. From the pre-infection steady state of CD4+ T cells, we obtained that the generation rate (λ) of CD4+ T cells is
cells ml−1 day−1. The viral infection rate k was chosen to be
ml virion−1 day−1 [Citation40]. The death rate of infected T cells is
day−1 [Citation27]. The total number of virions produced by one infected cell during its lifespan was assumed to be N=2000 virions cell−1 [Citation40]. The viral clearance rate was assumed to be c=23 day−1 [Citation34]. A very small fraction of new infection leads to latently infected cells. We assumed that the fraction of latency is f=0.0001 [Citation37].
We used an overall drug efficacy to represent the effectiveness of combination therapy consisting of RT and protease inhibitors, that is, [Citation38]. The overall drug efficacy was assumed to be
for most simulations but different treatment effectiveness have been used to evaluate the influence of suboptimal or 100% effective therapy on the dynamics of virus and the latent reservoir. Because non-infectious virions can still be detected by the RT polymerase chain reaction test and are counted in viral load measurements, we plotted the total viral load (i.e.
) in all the simulations.
We assumed that the activation rate of latently infected cells (α) to be a function of the latent infection age, a. Because the population of latently infected cells shifts towards cells specific to increasingly rare antigens, the activation rate is eventually decreasing. Thus, we began the simulation with a simple exponential decay function. The activation rate may be low right after the latent infection, and experiences an increase when cells encounter specific antigens, followed by a decline to a lower level. A lognormal-like function will also be used for simulations later.
An example of the exponential decay function takes the following form
(26)
(26) where
is the minimum activation rate of latently infected cells,
is the initial activation rate, and w is the decay constant characterizing how fast the activation rate declines to the minimum value. The values of these parameters remain largely undetermined. We chose
day−1,
day−1, and w=0.01 day−1 as default values in our simulation. Sensitivity tests of the solution of the model (Equation (Equation2
(2)
(2) )) on these parameters have been performed. We also varied the net generation rate of latently infected cells (γ in Equation (Equation2
(2)
(2) )) to explore when the model can generate low-level viral load persistence and a very stable latent reservoir in patients receiving long-term antiretroviral therapy. A summary of parameters and their default values are summarized in Table .
Table 1. Parameters and values used in the models and simulations.
4.2. Numerical results of the model with linear proliferation of latently infected cells
We provided numerical simulations to illustrate the analytical results of the model with a linear proliferation rate (Equation (Equation1(1)
(1) ) before treatment and Equation (Equation2
(2)
(2) ) under treatment). Backward Euler and the linearized finite difference method were used to discretize the ordinary and partial differential equation, respectively [Citation14]. The integral over age of latent infection was evaluated using Simpson's rule. The net generation rate of latently infected cells γ was chosen to be a half of the minimum activation rate of latently infected cells, that is,
, where
day−1. The other parameter values were chosen to be the same as those listed in Table . Numerical simulation of model (Equation1
(1)
(1) ) with initial CD4+ T cell count
cells per ml, initial viral load
virions per ml,
, and
for any a>0 yields an infected steady state in the absence of treatment. The dynamics of the latent reservoir and viral RNA level were showed in Figure upper panel.
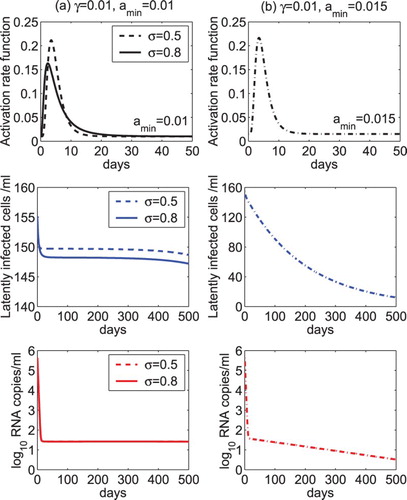
Figure 1. Dynamics of the latent reservoir and viral load predicted by model (Equation2(2)
(2) ). Upper panel: The latent reservoir and viral RNA level reach an infected steady state in the absence of drug treatment. The generation rate of latently infected cells γ was chosen to be a half of the minimum activation rate of latently infected cells, that is,
, where
day−1. Middle panel: The latent reservoir and virus were predicted to die out under treatment. The overall drug efficacy was chosen to be 0.99 and
. Lower panel: The latent reservoir and virus were predicted to persist at a low level under treatment. The overall drug efficacy was chosen to be 0.99 and
. The other parameter values were chosen to be the same as those listed in Table .
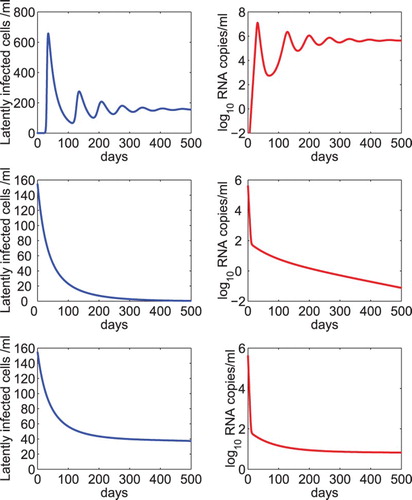
Using the steady state of the model in the absence of treatment as the initial condition of the model under antiretroviral therapy, we performed numerical simulation of model (Equation2(2)
(2) ). The overall drug efficacy was chosen to be 0.99 and the net generation rate of latently infected cells was assumed to be one tenth of the minimum activation rate (i.e.
). Both the latent reservoir and virus were predicted to die out in this scenario (Figure middle panel). In the lower panel of Figure , we used the same overall drug efficacy but assumed that the net generation rate was equal to the minimum activation rate of latently infected cells. We found that both the latent reservoir and virus persist at a low level under prolonged treatment.
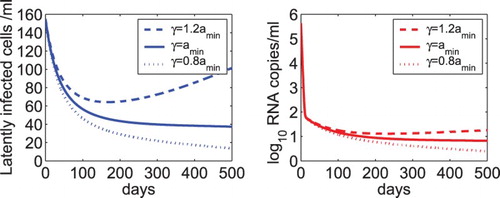
4.3. Viral and latent reservoir persistence depends on the relative magnitude of γ and

Figure suggested that the persistence of low-level latent reservoir and viral load depends on the value of the parameter γ, the net generation rate of latently infected cells. We further studied the effect of the relative magnitude of γ and (the minimum activation rate of latently infected cells) on the dynamics of model (Equation2
(2)
(2) ). When γ was chosen to be greater than
(e.g.
in Figure ), both the latent reservoir and viral load were predicted to rebound (dashed line). When
, the latent reservoir and virus persist at a very stable low level (solid line). When γ is less than
(e.g.
in Figure ), the latent reservoir and virus decline slowly (dotted line). The overall drug efficacy was fixed to 0.99 for all the three cases and the other parameter values were the same as those listed in Table .
Figure 2. The dynamics of the latent reservoir and virus predicted by model (Equation2(2)
(2) ) with different relative magnitudes of γ and
. When the net generation rate of latently infected cells was chosen to be 1.2 times of the minimum activation rate of latently infected cells, that is,
, both the latent reservoir and viral load were predicted to rebound (dashed line). When
, the latent reservoir and virus persist (solid line). When
, the latent reservoir and virus decline slowly to the infection-free steady state (dotted line). The overall drug efficacy is 0.99 and the other parameter values are the same as those listed in Table .
The results in Figure show that the relative magnitude of γ and determines whether the latent reservoir and viral load rebound, persist, or decline. This can also be explained from the equations in model (Equation2
(2)
(2) ). In the setting of effective antiretroviral therapy, the virus mainly comes from the activation of latently infected cells. When the net generation rate is greater than the long-term activation rate (i.e. the minimum activation value of the exponentially decay function) of latently infected cells, the size of the latent reservoir increases, which leads to more cell activation and viral production. When the net generation rate is equal to or slightly less than the long-term activation rate, the latent reservoir and the viral load persist at a stable level or decay very slowly.
4.4. Sensitivity tests of model (2) on parameters
In this section, we performed sensitivity tests of model (Equation2(2)
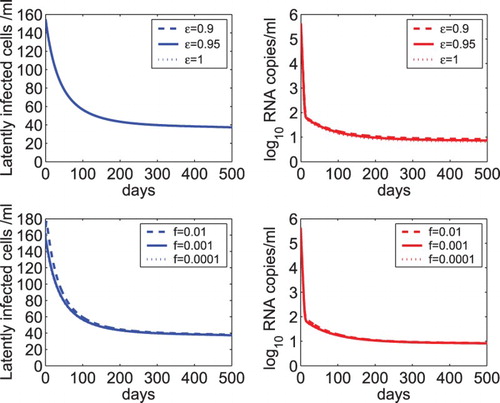
(2) ) on a number of parameters. Figure shows the sensitivity of the latent reservoir and viral load on the overall drug efficacy (ε) and the fraction of latency (f). We found that there is almost no difference in the level of latently infected cells and viral load when the treatment is able to suppress the viral load to below the detection limit (upper panel of Figure ). This suggests that treatment intensification by adding additional antiretroviral drugs (leading to a higher overall drug efficacy) does not help to reduce the size of the latent reservoir or further lower the viral load. Similarly, the dynamics of model (Equation2
(2)
(2) ) under treatment (lower panel of Figure ) are not sensitive to f because the influx of new latent infection, denoted by
, is small under effective treatment (i.e.
is close to 1). Therefore, although the fraction of latency plays an important role in determining the latent reservoir size during chronic infection before treatment, it does not affect the dynamics during effective combination therapy.
Figure 3. Sensitivity tests of the latent reservoir and viral load on the overall drug efficacy and the fraction of latency. Upper panel: The dynamics of latently infected cells and viral load predicted by model (Equation2(2)
(2) ) with different overall drug effectiveness, that is,
, 0.95, and 1. Lower panel: The predicted dynamics by model (Equation2
(2)
(2) ) with different fractions of infection that leads to latency, that is, f=0.01, 0.001, and 0.0001. The net generation rate (γ) was assumed to be the same as the minimum activation rate (
) of latently infected cells. The other parameter values are the same as those listed in Table .
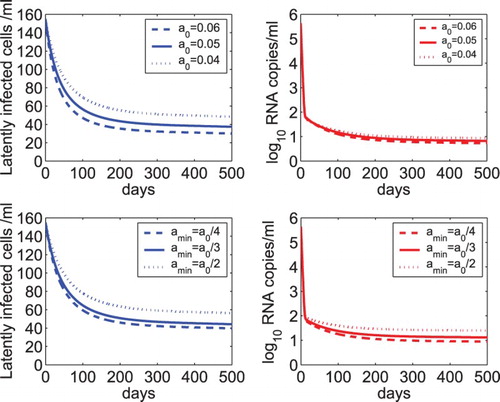
In Figure , we examined the sensitivity of model (Equation2(2)
(2) ) on the activation rate of latently infected cells. As the initial activation rate
increases from 0.04 to 0.06 day−1, both the latent reservoir and the viral load decrease because a higher initial activation rate activates or consumes more latently infected cells (upper panel of Figure ). However, they still persist at a very low level (because the net generation rate γ was assumed to be the same as the minimum activation rate
of latently infected cells). As the minimum activation rate
increases from
to
, it is faster to reach a balance between the net generation and activation of latently infected cells (note that
was fixed and γ was assumed to be equal to
). Thus, both the latent reservoir and the viral load are maintained at higher levels (see lower panel of Figure ).
Figure 4. Sensitivity tests of the latent reservoir and viral load on the activation rate of latently infected cells. Upper panel: The dynamics of latently infected cells and viral load predicted by model (Equation2(2)
(2) ) with different initial activation rates, that is,
, 0.05, and 0.04 day−1. Lower panel: The predicted dynamics by model (Equation2
(2)
(2) ) with different minimum activation rates of latently infected cells, that is,
,
, and
, where
day−1. The net generation rate (γ) was assumed to be the same as the minimum activation rate (
) of latently infected cells. The other parameter values are the same as those listed in Table .
4.5. Simulation with a lognormal-like activation rate function
In the previous simulations, we used an exponential decay function as the activation rate (Equation (Equation26
(25)
(25) )). Latently infected cells may need some time to encounter specific antigens and thus the activation rate is likely to experience an increase from a low level to a peak, followed by a decline to a lower level. In this section, we chose a lognormal-like function to describe such an activation rate. An example of the lognormal-like function is
(27)
(27) where the first term in the right-hand side is the probability density function of a lognormal distribution with the location parameter μ and the scale parameter σ, and the second term
represents the minimum activation rate of latently infected cells, as used in the exponential decay function.
As the maximum activation rate may have different magnitudes and appear at different time, we fixed the location parameter but varied the scale parameter (
or 0.8) in the simulation. In the left column of Figure , we assumed the minimum activation rate to be
day−1, which is the same as the net generation rate γ of latently infected cells. Similar to the case of
in the previous simulations, the model is able to show the persistence of both the latent reservoir and the low viral load. For a larger scale parameter (
), the activation rate increases faster to the maximum value, which induces a more substantial decrease in the latent reservoir. However, there is almost no difference in the decay of the viral load during treatment (Figure (a)). In the right column of Figure , we assumed
but chose a larger minimum activation rate (
day−1) than the net generation rate (
day−1) of latently infected cells. Also similar to the case of
in the previous simulations, both the latent reservoir and the viral load are predicted to die out (Figure (b)). This further confirms that the stability of the latent reservoir and low viral load persistence depend on the relative magnitude of the net generation rate and the long-term activation rate of latently infected cells.
Figure 5. The dynamics of the latent reservoir and virus predicted by model (Equation2(2)
(2) ) with a lognormal-like activation rate. The lognormal-like function was given in Equation (Equation27
(26)
(26) ). (a) The scale parameter of the lognormal function was set to
or 0.8. The minimum activation rate was assumed to be the same as the net generation rate of latently infected cells (
day−1). (b) The scale parameter was fixed at
and the minimum activation rate was chosen to be larger than the net generation rate of latently infected cells (
=0.015 day−1 and
day−1). The overall drug efficacy is 0.99 and the other parameter values are the same as those listed in Table .
4.6. Numerical results of the model with homeostatic proliferation of latently infected cells
Numerical simulations of the model with linear proliferation of latently infected cells (Equation (Equation2(2)
(2) )) show that the modelling prediction is robust to most parameters but is sensitive to the relative magnitude of the net generation rate and the long-term activation rate of latently infected cells (Figure ). In this section, we modified the model by including homeostatic proliferation of latently infected cells to reduce the sensitivity. Homeostatic proliferation was shown in a mathematical model [Citation36] and confirmed in an experimental study [Citation7] to be critical in maintaining HIV reservoir size and persistence. As used in ref. [Citation36], a logistic term can describe homeostatic proliferation of latently infected cells. The second equation of model (Equation2
(2)
(2) ) becomes the following. The other equations in the system remain unchanged.
(28)
(28) The parameter p is the maximum proliferation rate of latently infected cells.
is the carrying capacity density of latently infected cells, beyond which proliferation does not occur. An estimate of 32 cells per ml was used for the maximum density of latently infected cells in ref. [Citation36] assuming that there are
total body lymphocytes and maximally
latently infected cells per patient under highly active antiretroviral therapy. In this paper, we let
cells per ml for the age-specific maximum density of latently infected cells. Simulation will show that the predicted steady state of latently infected cells before treatment agrees with that obtained in ref. [Citation36]. Different values of the maximum proliferation rate p and carrying capacity density
have also been used to evaluate their effect on the dynamics of the latent reservoir and viral load during therapy. The same activation function (Equation (Equation26
(25)
(25) )) was used in the simulation.
We again assumed that the initial CD4+ T cell count is cells per ml, initial viral load is
virions per ml,
, and
for any a>0. The homeostatic proliferation rate of latently infected cells was chosen to be the same as the minimum activation rate of latently infected cells, that is,
day−1. The other parameter values were chosen to be the same as those listed in Table . Numerical simulation of the model with homeostatic proliferation of latently infected cells (Equation (Equation28
(27)
(27) )) in the absence of drug treatment generated chronic infection with an infected steady state. The dynamics of the latent reservoir and viral load change were shown in the upper panel of Figure . The predicted steady states of latently infected cells and viral load are approximately the same as those shown in the upper panel of Figure using the model with linear proliferation of latently infected cells (Equation (Equation1
(1)
(1) )). Using this steady state as the initial condition of the model under treatment and assuming that the overall drug efficacy is 0.99, the latent reservoir and virus were predicted to persist at a low level under long-term treatment (Figure lower panel).
Figure 6. Dynamics of the latent reservoir and viral load predicted by the model including homeostatic proliferation of latently infected cells (Equation (Equation28(27)
(27) )). Upper panel: The latent reservoir and viral RNA level reach an infected steady state in the absence of drug treatment. The homeostatic proliferation rate of latently infected cells p was chosen to be the same as the minimum activation rate of latently infected cells, that is,
day−1. The carrying capacity of latently infected cells was assumed to be 0.3 cells ml−1. Lower panel: The latent reservoir and virus were predicted to persist at a low level under treatment. The overall drug efficacy was chosen to be 0.99. The other parameter values were chosen to be the same as those listed in Table .
We evaluated the sensitivity of the model including homeostatic proliferation (Equation (Equation28(27)
(27) )) of latently infected cells with respect to several parameters. The model with a linear proliferation rate of latently infected cells is relatively sensitive to the proliferation rate γ (Figure ). In the upper panel of Figure , we showed the predicted dynamics of latently infected cells and viral load using different homeostatic proliferation rates, that is, p=0.03, 0.02, and 0.01 day−1. The minimum activation rate of latently infected cells was fixed at
day−1. The carrying capacity was fixed at
cells ml−1 and the overall drug efficacy was fixed at
. When p is equal to (or slightly less than) the minimum activation rate
, the latent reservoir and viral load persist (or decay slowly) during treatment. This prediction is similar to that illustrated by the model (Equation (Equation2
(2)
(2) )) with linear proliferation of latently infected cells (Figure lower panel). When p is greater than
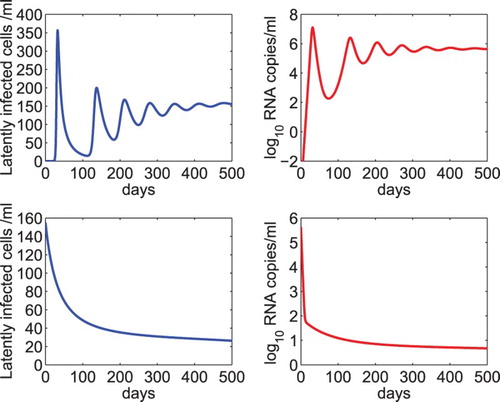
, there is an initial increase in the latent reservoir size and a minor initial increase in the viral load. As the latent reservoir size increases to above the carrying capacity, proliferation of latently infected cells stops and programmed cell death occurs due to the mechanism of homeostasis (i.e. the logistic term becomes negative). Both the latent reservoir and viral load approach a new steady state. Simulation in the first 700 days was shown in the upper panel of Figure (solid and dashed lines). These simulations suggest that the model with homeostatic proliferation of latently infected cells is robust with respect to the relative magnitude of the proliferation rate and the long-term activation rate of latently infected cells in reproducing the persistence of low-level latent reservoir and plasma viremia.
Figure 7. Sensitivity tests of the model with homeostatic proliferation of latently infected cells (Equation (Equation28(27)
(27) )) on parameters. Upper panel: The dynamics of latently infected cells and viral load predicted by model (Equation28
(27)
(27) ) with different homeostatic proliferation rates of latently infected cells, that is, p=0.03, 0.02, and 0.01 day−1. The carrying capacity of latently infected cells was fixed at
cells ml−1 and the overall drug efficacy was fixed at
. Middle panel: The predicted dynamics with different carrying capacities of latently infected cells, that is,
, 0.3, and 0.1 cells ml−1. The homeostatic proliferation rate of latently infected cells was fixed at p=0.01 day−1. Lower panel: The predicted dynamics by model (Equation28
(27)
(27) ) with different drug effectiveness, that is,
, 0.9, and 1.
was fixed at 0.3 cells ml−1 and p was fixed at 0.01 day−1. The other parameter values are the same as those listed in Table .
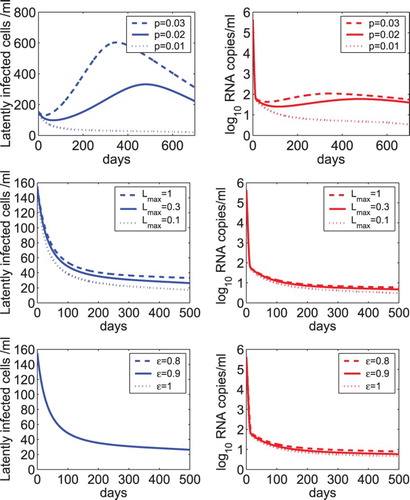
The sensitivity of the latent reservoir and viral load with respect to the carrying capacity of latently infected cells was shown in the middle panel of Figure . was chosen to be 1, 0.3, or 0.1 cells ml−1. As
decreases, the size of the latent reservoir decreases and the viral load undergoes a very minor decrease. We also evaluated the effect of different treatment effectiveness on the dynamics (lower panel of Figure ). As the overall drug efficacy increases from 0.8 to 1, there is almost no difference in the size of the latent reservoir. There is a very small reduction in the viral load. This suggests that using the model with homeostatic proliferation of latently infected cells, treatment intensification does not further reduce the size of the latent reservoir or lower the viral load. This is consistent with the conclusion drawn from the model with linear proliferation of latently infected cells.
5. Discussion
Highly active antiretroviral therapy can control viral replication in many HIV patients but cannot eradicate the virus. The latent reservoir consisting of a population of latently infected CD4+T cells represents a major obstacle to viral elimination. Because of ongoing viral replication due to suboptimal treatment and some other mechanisms for the intrinsic stability of memory T cells [Citation3], the size of the latent reservoir is very stable or decays extremely slowly. Latently infected cells can be activated by their relevant antigens and release new virions, rendering treatment termination or viral elimination impossible.
A basic model including the dynamics of latently infected cells has been introduced by Perelson et al. to study the biphasic viral load decline observed in patients receiving combination therapy of two RT inhibitors and one protease inhibitor [Citation33]. The model was mathematically analysed [Citation30]. Local and global stability results of steady states were obtained, which was shown to depend on the basic reproductive number. Because the steady states of the latent reservoir and viral load are very sensitive to the effectiveness of treatment, the model cannot be used to describe the persistence of low-level latently infected cells and viremia in patients on long-term combination therapy [Citation37]. A few models have been shown to be able to reduce the sensitivity of viral load with respect to the drug efficacy [Citation6]. One assumes the death rate of productively infected cells to be dependent on the infected cell density. The other model assumes that antiretroviral drugs have different effects in two distinct compartments, one of which is a drug sanctuary site and has a reduced drug efficacy. Some other models based on different biological mechanisms such as asymmetric cell division and proliferation of latently infected cells have also been developed to study the dynamics of the latent reservoir under treatment (see a review in ref. [Citation37]).
The pool of latently infected CD4+ T cells is heterogeneous [Citation47]. Cells specific to common antigens are activated soon and cells specific to rare antigens need more time to encounter with antigens and be activated. Thus, the activation rate depends on the time elapsed since the cell is latently infected, which is the age of latent infection. In this paper, we developed a mathematical model including age-structured latently infected cells. We assumed that the activation rate of latently infected cells depends on the age of latent infection. Using an exponentially decreasing activation rate and a lognormal-like function as examples, we found that the model is able to reproduce the dynamics of latently infected cells and low-level viremia during treatment. The relative magnitude of the net generation rate and the long-term activation rate (i.e. the minimum value of the activation function) of latently infected cells determines whether latently infected cells and viral load can persist at a low level. Only when the net generation rate is less than or equal to the long-term activation rate of latently infected cells can the model describe the persistence of latent reservoir and low viral load. If the net generation rate is slightly less than the long-term activation rate of latently infected cells, then the latent reservoir will be very stable or decay extremely slowly. If the difference between them becomes larger, then the decay of the latent reservoir will become more rapid. This can explain the divergent estimates (from 4.6 months to 44 months) of the half life of the decay of the latent reservoir in different clinical trials [Citation8,Citation15,Citation35,Citation46,Citation54].
Using sensitivity test, we found the model is not sensitive to other parameters including the effectiveness of treatment. Even when treatment is assumed to be 100% effective, the viral load and latently infected cells can still persist. This suggests that treatment intensification adding more drugs to current treatment regimens may not help to reduce the size of the latent reservoir or eradicate the virus. This is consistent with a number of clinical trials in which addition of new drugs such as the integrase inhibitor raltegravir did not reduce persistent low-level viremia in patients with HIV suppression during combination antiretroviral therapy [Citation5,Citation18,Citation22,Citation23,Citation28,Citation53]. It also agrees with our recent results of using a multi-stage model to study the dynamics of 2-LTR (long terminal repeat) circles, a marker of recent viral infection [Citation52].
Homeostatic proliferation of latently infected cells was included in a mathematical model [Citation36] to explain the low viral load persistence and the stability of the latent reservoir, and was later confirmed by an experimental study [Citation7]. We also included homeostatic proliferation of latent cells in the age-structured model and found the model is relatively robust in reproducing the dynamics of viral load and latently infected cells in HIV infected individuals under long-term effective treatment. This may explain why a ‘shock and kill’ approach involving activating the latent reservoir with latency-reversing agents has not achieved success up to now [Citation37]. Novel treatment strategies, such as agents that can block the function of cytokines essential for the proliferation of memory T cells [Citation19] or caspase-1 inhibitor that can inhibit pyroptosis (a programmed cell death which was shown to drive CD4+ T cell depletion [Citation12,Citation13,Citation51]), may have the potential to reduce the size of the latent reservoir, maintain the CD4+ T cell population and eradicate the virus.
Viral blips are observed in many patients receiving prolonged antiretroviral therapy. Using an increased activation rate at some time when latently infected cells encounter with very relevant antigens, the model can generate a viral blip. When treatment stops, the viral load is predicted to increase rapidly, faster than the viral rebound observed in patients with sustained viral suppression who terminated highly active antiretroviral therapy [Citation11]. One reason causing the rapid viral rebound may be that the immune response is not included in this model. Suppressive antiretroviral therapy was shown to be able to partially restore the immune response in HIV patients [Citation17], particularly if therapy was initiated very early during primary infection. When the size of the latent reservoir is small, the immune response can control viral replication for a period of time after cessation of therapy. This provides an opportunity for post-treatment viral control [Citation42]. A mathematical model including latently infected cell activation and immune response was used to explore when post-treatment control of HIV infection can occur [Citation10]. Our age-structured model can be extended to include the immune response and evaluate whether treatment interruptions, such as structured treatment interruptions [Citation26], can achieve optimal control of HIV infection.
In summary, we developed a model including age-structured latently infected cells to study the dynamics of the latent reservoir and the virus in HIV patients on combination therapy. The proliferation rate and the long-term activation rate of latently infected cells are important in governing the dynamics. The model with homeostatic proliferation of latently infected cells is very robust in reproducing the persistence of low-level viral load and latently infected cells. This work provides a modelling framework that can be used to evaluate treatment interruption strategies which may achieve ‘functional cure’ for HIV without administrating continuous and lifetime therapy.
Acknowledgments
We thank two reviewers for their detailed and constructive comments that improved the manuscript.
Disclosure statement
No potential conflict of interest was reported by the authors.
Additional information
Funding
References
- N.M. Archin, N.K. Vaidya, J.D. Kuruc, A.L. Liberty, A. Wiegand, M.F. Kearney, M.S. Cohen, J.M. Coffin, R.J. Bosch, C.L. Gay, J.J. Eron, D.M. Margolis, and A.S. Perelson, Immediate antiviral therapy appears to restrict resting CD4+ cell HIV-1 infection without accelerating the decay of latent infection, Proc. Natl. Acad. Sci. USA 109 (2012), pp. 9523–9528.
- H.T. Banks, K.B. Flores, S. Hu, E. Rosenberg, M. Buzon, X. Yu, and M. Lichterfeld, Immuno-modulatory strategies for reduction of HIV reservoir cells, J. Theoret. Biol. 372 (2015), pp. 146–158.
- J.N. Blankson, D. Persaud, and R.F. Siliciano, The challenge of viral reservoirs in HIV-1 infection, Annu. Rev. Med. 53 (2002), pp. 557–593.
- M. Bofill, G. Janossy, C.A. Lee, D. MacDonald-Burns, N. Phillips, C. Sabin, A. Timms, M.A. Johnson, and P.B. Kernoff, Laboratory control values for CD4 and CD8 T lymphocytes: Implications for HIV-1 diagnosis, Clin. Exp. Immunol. 88 (1992), pp. 243–252.
- M.J. Buzón, M. Massanella, J.M. Llibre, A. Esteve, V. Dahl, M.C. Puertas, J.M. Gatell, P. Domingo, R. Paredes, M. Sharkey, S. Palmer, M. Stevenson, B. Clotet, Julià Blanco, and J. Martinez-Picado, HIV-1 replication and immune dynamics are affected by raltegravir intensification of HAART-suppressed subjects, Nat. Med. 16 (2010), pp. 460–465.
- D.S. Callaway and A.S. Perelson, HIV-1 infection and low steady state viral loads, Bull. Math. Biol. 64 (2002), pp. 29–64.
- N. Chomont, M. El-Far, P. Ancuta, L. Trautmann, F.A. Procopio, B. Yassine-Diab, G. Boucher, M.-R. Boulassel, G. Ghattas, J.M. Brenchley, T.W. Schacker, B.J. Hill, D.C. Douek, J.-P. Routy, E.K. Haddad, and R.-P. Sékaly, HIV reservoir size and persistence are driven by T cell survival and homeostatic proliferation, Nat. Med. 15 (2009), pp. 893–900.
- T.W. Chun, J.S. Justement, S. Moir, C.W. Hallahan, J. Maenza, J.I. Mullins, A.C. Collier, L. Corey, and A.S. Fauci, Decay of the HIV reservoir in patients receiving antiretroviral therapy for extended periods: Implications for eradication of virus, J. Infect. Dis. 195 (2007), pp. 1762–1764.
- J.M. Conway and D. Coombs, A stochastic model of latently infected cell reactivation and viral blip generation in treated HIV patients, PLoS Comput. Biol. 7 (2011), p. e1002033. 10.1371/journal.pcbi.1002033
- J.M. Conway and A.S. Perelson, Post-treatment control of HIV infection, Proc. Natl. Acad. Sci. USA 112 (2015), pp. 5467–5472.
- R.T. Davey Jr., N. Bhat, C. Yoder, T.-W. Chun, J.A. Metcalf, R. Dewar, V. Natarajan, R.A. Lempicki, J.W. Adelsberger, K.D. Miller, J.A. Kovacs, M.A. Polis, R.E. Walker, J. Falloon, H. Masur, D. Gee, M. Baseler, D.S. Dimitrov, A.S. Fauci, and H.C. Lane, HIV-1 and T cell dynamics after interruption of highly active antiretroviral therapy (HAART) in patients with a history of sustained viral suppression, Proc. Natl. Acad. Sci. USA 96 (1999), pp. 15109–15114.
- G. Doitsh, M. Cavrois, K.G. Lassen, O. Zepeda, Z. Yang, M.L. Santiago, A.M. Hebbeler, and W.C. Greene, Abortive HIV infection mediates CD4 T cell depletion and inflammation in human lymphoid tissue, Cell 143 (2010), pp. 789–801.
- G. Doitsh, N.L. Galloway, X. Geng, Z. Yang, K.M. Monroe, O. Zepeda, P.W. Hunt, H. Hatano, S. Sowinski, I. Muñoz-Arias, and W.C. Greene, Cell death by pyroptosis drives CD4 T-cell depletion in HIV-1 infection, Nature 505 (2014), pp. 509–514.
- Z. Feng, M. Iannelli, and F. Milner, A two-strain Tuberculosis model with age of infection, SIAM J. Appl. Math. 62 (2002), pp. 1634–1656.
- D. Finzi, J. Blankson, J.D. Siliciano, J.B. Margolick, K. Chadwick, T. Pierson, K. Smith, J. Lisziewicz, F. Lori, C. Flexner, T.C. Quinn, R.E. Chaisson, E. Rosenberg, B. Walker, S. Gange, J. Gallant, and R.F. Siliciano, Latent infection of CD4t T cells provides a mechanism for lifelong persistence of HIV-1, even in patients on effective combination therapy, Nat. Med. 5 (1999), pp. 512–517.
- J. Forde, J.M. Volpe, and S.M. Ciupe, Latently infected cell activation: A way to reduce the size of the HIV reservoir? Bull. Math. Biol. 74 (2012), pp. 1651–1672.
- M.A. French, P. Price, and S.F. Stone, Immune restoration disease after antiretroviral therapy, AIDS 18 (2004), pp. 1615–1627.
- R.T. Gandhi, L. Zheng, R.J. Bosch, E.S. Chan, D.M. Margolis, S. Read, B. Kallungal, S. Palmer, K. Medvik, M.M. Lederman, N. Alatrakchi, J.M. Jacobson, A. Wiegand, M. Kearney, J.M. Coffin, J.W. Mellors, and J.J. Eron, The effect of raltegravir intensification on low-level residual viremia in HIV-infected patients on antiretroviral therapy: A randomized controlled trial, PLoS Med. 7 (2010), p. e1000321.
- J. Geginat, F. Sallusto, and A. Lanzavecchia, Cytokine-driven proliferation and differentiation of human naive, central memory, and effector memory CD4+ T cells, J. Exp. Med. 194 (2001), pp. 1711–1720.
- S.A. Gourley and Y. Kuang, A stage structured predator-prey model and its dependence on maturation delay and death rate, J. Math. Biol. 49 (2004), pp. 188–200.
- G. Gripenberg, S.-O. Londen, and O. Staffans, Volterra Integral and Functional Equations, Cambridge University Press, New York, 1990.
- H. Hatano, T.L. Hayes, V. Dahl, E. Sinclair, T.-H. Lee, R. Hoh, H. Lampiris, P.W. Hunt, S. Palmer, J.M. McCune, J.N. Martin, M.P. Busch, B.L. Shacklett, and S.G. Deeks, A randomized, controlled trial of raltegravir intensification in antiretroviral-treated, HIV-infected patients with a suboptimal CD4+ T cell response, J. Infect. Dis. 203 (2011), pp. 960–968.
- H. Hatano, R. Scherzer, Y. Wu, K. Harvill, K. Maka, R. Hoh, E. Sinclair, S. Palmer, J.N. Martin, M.P. Busch, S.G. Deeks, and P.Y. Hsue, A randomized controlled trial assessing the effects of raltegravir intensification on endothelial function in treated HIV infection, J. Acquir. Immune. Defic. Syndr. 61 (2012), pp. 317–325.
- L.E. Jones and A.S. Perelson, Transient viremia, plasma viral load, and reservoir replenishment in HIV-infected patients on antiretroviral therapy, J. Acquir. Immune. Defic. Syndr. 45 (2007), pp. 483–493.
- H. Kim and A.S. Perelson, Viral and latent reservoir persistence in HIV-1-infected patients on therapy, PLoS Comput. Biol. 10 (2006), p. e135.
- F. Lori, M.G. Lewis, J. Xu, G. Varga, D.E. JrZinn, C. Crabbs, W. Wagner, J. Greenhouse, P. Silvera, J. Yalley-Ogunro, C. Tinelli, and J. Lisziewicz, Control of SIV rebound through structured treatment interruptions during early infection, Science 290 (2000), pp. 1591–1593.
- M. Markowitz, M. Louie, A. Hurley, E. Sun, M. Di Mascio, A.S. Perelson, and D.D. Ho, A novel antiviral intervention results in more accurate assessment of human immunodeficiency virus type 1 replication dynamics and T-cell decay in vivo, J. Virol. 77 (2003), pp. 5037–5038.
- D. McMahon, J. Jones, A. Wiegand, S.J. Gange, M. Kearney, S. Palmer, S. McNulty, J.A. Metcalf, E. Acosta, C. Rehm, J.M. Coffin, J.W. Mellors, and F. Maldarelli, Short-course raltegravir intensification does not reduce persistent low-level viremia in patients with HIV-1 suppression during receipt of combination antiretroviral therapy, Clin. Infect. Dis. 50 (2000), pp. 912–919.
- V. Muller, J.F. Vigueras-Gomez, and S. Bonhoeffer, Decelerating decay of latently infected cells during prolonged therapy for human immunodeficiency virus type 1 infection, J. Virol. 76 (2002), pp. 8963–8965.
- S. Pankavich, The effects of latent infection on the dynamics of HIV, Differential Equations Dynam. Systems (2015), doi:doi:10.1007/s12591-014-0234-6.
- A.S. Perelson and R.M. Ribeiro, Modeling the within-host dynamics of HIV infection, BMC Biol. 11 (2013), pp. 1–10.
- A.S. Perelson, D.E. Kirschner, and R.J. De Boer, Dynamics of HIV infection of CD4+ T cells, Math. Biosci. 114 (1993), pp. 81–125.
- A.S. Perelson, P. Essunger, Y. Cao, M. Vesanen, A. Hurley, K. Saksela, M. Markowitz, and D.D. Ho, Decay characteristics of HIV-1-infected compartments during combination therapy, Nature 387 (1997), pp. 188–191.
- B. Ramratnam, S. Bonhoeffer, J. Binley, A. Hurley, L. Zhang, J.E. Mittler, M. Markowitz, J.P. Moore, A.S. Perelson, and D.D. Ho, Rapid production and clearance of HIV-1 and hepatitis C virus assessed by large volume plasma apheresis, Lancet 354 (1999), pp. 1782–1785.
- B. Ramratnam, J.E. Mittler, L. Zhang, D. Boden, A. Hurley, F. Fang, C.A. Macken, A.S. Perelson, M. Markowitz, and D.D. Ho, The decay of the latent reservoir of replication-competent HIV-1 is inversely correlated with the extent of residual viral replication during prolonged anti-retroviral therapy, Nat. Med. 6 (2000), pp. 82–85.
- L. Rong and A.S. Perelson, Modeling Latently infected cell activation: Viral and latent reservoir persistence, and viral blips in HIV-infected patients on potent therapy, PLoS Comput. Biol. 5 (2009), p. e1000533. doi:10.1371/journal.pcbi.1000533
- L. Rong and A.S. Perelson, Modeling HIV persistence, the latent reservoir, and viral blips, J. Theoret. Biol. 260 (2009), pp. 308–331.
- L. Rong and A.S. Perelson, Asymmetric division of activated latently infected cells may explain the decay kinetics of the HIV-1 latent reservoir and intermittent viral blips, Math. Biosci. 217 (2009), pp. 77–87.
- L. Rong and A.S. Perelson, Mathematical analysis of multiscale models for hepatitis C virus dynamics under therapy with direct-acting antiviral agents, Math. Biosci. 245 (2013), pp. 22–30.
- L. Rong, Z. Feng, and A.S. Perelson, Emergence of HIV-1 drug resistance during antiretroviral treatment, Bull. Math. Biol. 69 (2007), pp. 2027–2060.
- L. Rong, Z. Feng, and A.S. Perelson, Mathematical analysis of age-structured HIV-1 dynamics with combination antiretroviral therapy, SIAM J. Appl. Math. 67 (2007), pp. 731–756.
- A. Sáez-Cirión, C. Bacchus, L. Hocqueloux, V. Avettand-Fenoel, I. Girault, C. Lecuroux, V. Potard, P. Versmisse, A. Melard, T. Prazuck, B. Descours, J. Guergnon, J.-P. Viard, F. Boufassa, O. Lambotte, C. Goujard, L. Meyer, D. Costagliola, A. Venet, G. Pancino, B. Autran, C. Rouzioux, and J. Lifson, Post-treatment HIV-1 controllers with a long-term virological remission after the interruption of early initiated antiretroviral therapy ANRS VISCONTI Study, PLoS Pathog. 9 (2013), p. e1003211. doi:10.1371/journal.ppat.1003211
- D. Sanchez-Taltavull and T. Alarcon, Stochastic modelling of viral blips in HIV-1-infected patients: Effects of inhomogeneous density fluctuations, J. Theoret. Biol. 371 (2015), pp. 79–89.
- M. Shen, Y. Xiao, and L. Rong, Global stability of an infection-age structured HIV-1 model linking within-host and between-host dynamics, Math. Biosci. 263 (2015), pp. 37–50.
- J.D. Siliciano and R.F. Siliciano, A long-term latent reservoir for HIV-1: Discovery and clinical implications, J. Antimicrob. Chemother. 54 (2004), pp. 6–9.
- J.D. Siliciano, J. Kajdas, D. Finzi, T.C. Quinn, K. Chadwick, J.B. Margolick, C. Kovacs, S.J. Gange, and R.F. Siliciano, Long-term follow-up studies confirm the stability of the latent reservoir for HIV-1 in resting CD4+ T cells, Nat. Med. 9 (2003), pp. 727–728.
- M.C. Strain, H.F. Gunthard, D.V. Havlir, C.C. Ignacio, D.M. Smith, A.J. Leigh-Brown, T.R. Macaranas, R.Y. Lam, O.A. Daly, M. Fischer, M. Opravil, H. Levine, L. Bacheler, C.A. Spina, D.D. Richman, and J.K. Wong, Heterogeneous clearance rates of long-lived lymphocytes infected with HIV: Intrinsic stability predicts lifelong persistence, Proc. Natl. Acad. Sci. USA 100 (2003), pp. 4819–4824.
- M.C. Strain, S.J. Little, E.S. Daar, D.V. Havlir, H.F. Günthard, R.Y. Lam, O.A. Daly, J. Nguyen, C.C. Ignacio, C.A. Spina, D.D. Richman, and J.K. Wong, Effect of treatment, during primary infection, on establishment and clearance of cellular reservoirs of HIV-1, J. Infect. Dis. 191 (2005), pp. 1410–1418.
- H.R. Thieme and C. Castillo-Chavez, How may infection-age-dependent infectivity affect the dynamics of HIV/AIDS? SIAM J. Appl. Math. 53 (1993), pp. 1447–1479.
- S. Wang and L. Rong, Stochastic population switch may explain the latent reservoir stability and intermittent viral blips in HIV patients on suppressive therapy, J. Theoret. Biol. 360 (2014), pp. 137–148.
- S. Wang, P. Hottz, M. Schechter, and L. Rong, Modeling the slow CD4+ T cell decline in HIV-infected individuals, PLoS Comput. Biol. 11 (2015), p. e1004665. 10.1371/journal.pcbi.1004665
- X. Wang, G. Mink, D. Lin, X. Song, and L. Rong, Influence of raltegravir intensification on viral load and 2-LTR dynamics in HIV patients on suppressive antiretroviral therapy, J. Theoret. Biol., in review.
- S.A. Yukl, A.K. Shergill, K. McQuaid, S. Gianella, H. Lampiris, C.B. Hare, M. Pandori, E. Sinclair, H.F. Günthard, M. Fischer, J.K. Wong, and D.V. Havlir, Effect of raltegravir-containing intensification on HIV burden and T-cell activation in multiple gut sites of HIV-positive adults on suppressive antiretroviral therapy, AIDS 24 (2010), pp. 2451–2460.
- L. Zhang, B. Ramratnam, K. Tenner-Racz, Y. He, M. Vesanen, S. Lewin, A. Talal, P. Racz, A.S. Perelson, B.T. Korber, M. Markowitz, Y. Guo, M. Duran, A. Hurley, J. Tsay, Y.-C. Huang, C.-C. Wang, and D.D. Ho, Quantifying residual HIV-1 replication in patients receiving combination antiretroviral therapy, N. Engl. J. Med. 340 (1999), pp. 1605–1613.
- W. Zhang, L.M. Wahl, and P. Yu, Conditions for transient viremia in deterministic in-host models: Viral blips need no exogenous trigger, SIAM J. Appl. Math. 73 (2013), pp. 853–881.