?Mathematical formulae have been encoded as MathML and are displayed in this HTML version using MathJax in order to improve their display. Uncheck the box to turn MathJax off. This feature requires Javascript. Click on a formula to zoom.
ABSTRACT
Mosquitoes are vectors for many diseases that cause significant mortality and morbidity. As mosquito populations expand their range, they may undergo mate-finding Allee effects such that their ability to successfully reproduce becomes difficult at low population density. With new technology, creating target specific gene modification may be a viable method for mosquito population control. We develop a mathematical model to investigate the effects of releasing transgenic mosquitoes into newly established, low-density mosquito populations. Our model consists of two life stages (aquatic and adults), which are divided into three genetically distinct groups: heterogeneous and homogeneous transgenic that cause female infertility and a homogeneous wild type. We perform analytical and numerical analyses on the equilibria to determine the level of saturation needed to eliminate mosquitoes in a given area. This model demonstrates the potential for a gene drive system to reduce the spread of invading mosquito populations.
1. Introduction
Mosquitoes have been labelled the deadliest animal [Citation19] as more than half a million people die each year from mosquito-borne diseases, including dengue and malaria [Citation36,Citation37]. Methods such as insecticide-treated mosquito nets, indoor residual spraying, space treatment, and larvicide application have led to significant headway in disease control by directly targeting the mosquito populations [Citation18,Citation34]. However, there are limitations to these methods. For example, extensive usage of common insecticides has led to mosquitoes rapidly acquiring resistance [Citation20]. It is not a straightforward task to replace insecticides used in treated mosquito nets, which require low toxicity due to their close proximity to humans [Citation20]. Effective control of mosquito populations may consequently require novel control measures to supplement existing tactics.
Beyond the rise of insecticide resistance, mosquito populations continue to expand into new territory and increase in density in other locations, further altering the potential for profound impacts on local transmission dynamics of vector-borne diseases. In the last 30 years, for example, Aedes albopictus has spread from Southeast Asia to Africa, Europe and the Americas due in part to an increase in global shipping [Citation16]. In 2017, the Center for Disease Control showed that the spread of Ae. albopictus and Aedes aegypti increased in the United States [Citation10]. Although Anopheles gambiae have not spread outside of Africa, their geographical range has shifted [Citation31]. While mosquitoes are endemic to many locations, other places observe seasonal variation in their populations. As temperatures continue to increase globally, African highlands have observed increases in mosquito populations [Citation23]. A study in Peru also revealed that weather is related to variation in Ae. aegypti populations and, importantly, has direct consequences on the transmission of dengue virus between humans and vectors [Citation8]. Although eliminating mosquitoes that serve as disease vectors is insurmountable in many locations, minimizing their spatial spread to new areas may be a viable option.
One method that shows promise in facilitating control of mosquitoes and the infectious diseases they carry is the release of transgenic or otherwise genetically altered mosquitoes [Citation3,Citation17]. Manipulation of mosquito genetics has already been undertaken using the CRISPR-Cas9 system [Citation14,Citation17], such as on an Anopheles stephensi gene that exhibits anti-Plasmodium falciparum activity [Citation14]. In An. gambiae, three recessive genes have been identified that produce female sterility. Using CRISPR-Cas9 constructs that function as a gene drive system, they observed transmission rates of these genes at over 90% [Citation17]. Gene drive occurs when a gene is inherited with greater than random probability, in contrast to traditional Mendelian inheritance, where each gene has the same probability of being passed on to progeny. As the gene which creates infertility is more favourably inherited than the gene which does not, these results suggest that it is biologically feasible to use gene drive to express infertility in female Anopheles mosquitoes.
An additional feature of the population dynamics that may play a crucial role in the design and implementation of control via transgenic mosquitoes is the impact of low population density on the the ability of mosquitoes to successfully find a mate. Low population densities are most likely to occur as mosquitoes move into new territories and, consequently, this may generate a mate-finding Allee effect. More generally, an Allee effect is the loss of fitness or ability to reproduce due to decreased population size and arises from several mechanisms including mate-finding failure, foraging efficiency, and predation [Citation6]. In particular, strong Allee effects exist if there is a population threshold below which per capita growth rates become negative [Citation29]. Mosquitoes may have a naturally occurring Allee effect supported by evidence of skip oviposition in Ae. aegypti [Citation39]. This preference implies that larvae survival may decrease with a low population density, suggesting the presence of an Allee effect.
We develop a mathematical model that describes the population dynamics of emerging mosquito populations following the introduction of transgenic mosquitoes and in the presence of a potential Allee effect. We conduct a stability analysis and perform numerical simulations of our model to determine conditions necessary for effective control. We find the ability of transgenic mosquitoes with fertility costs to reduce or eliminate the total population, with the magnitude of reduction dependent on the strength of the gene drive, the reduction in fertility, and the Allee effect.
2. Materials and methods
We develop two models of mosquito population dynamics. The first model describes the basic population dynamics of mosquitoes under the assumption that there is a pre-existing mate-finding Allee effect. The second model expands this framework by introducing a transgenic population of mosquitoes with genetic variation of two alleles at a single locus.
2.1. Basic model
We begin with a continuous-time model of the mosquito life cycle comprised of aquatic (J) and adult (A) classes. Egg, larvae, and pupae stages are included in the single aquatic class (J), in line with previous work [Citation4,Citation22].
We let r be the proportion of the adults that are males, and, thus, 1−r are females. Females have an associated fecundity of β eggs, and transition from the aquatic class to the adult class occurs at rate α. We assume there are constant, density-independent mortality rates and
for the aquatic class and adult class, respectively. As there is evidence of density-dependent mortality in the first larval stage [Citation13], we additionally assume that the aquatic class (J) has an associated density-dependent mortality rate
, which is in line with previous mosquito models [Citation1,Citation4,Citation33]. Thus, in the absence of an Allee effect our basic model is given by
(1)
(1) We introduce a mate-finding Allee effect using the functional form
, where δ is the Allee constant, which dictates the strength of the Allee effect. A larger value indicates a stronger Allee effect. Thus, our basic model including an Allee effect is
(2)
(2) Notice that systems (Equation1
(1)
(1) ) and (Equation2
(2)
(2) ) are identical when
, that is, there is no Allee effect.
2.2. Gene drive
We extend our basic model to consider the effect of including and releasing transgenic mosquitoes into the population (Figure ). Specifically, we consider transgenic mosquitoes that harbour a trait causing sterility that can be expressed by a single gene determined by two alleles [Citation14]. We assume transmission of the gene does not follow Mendelian inheritance.
Figure 1. Schematic of the mosquito life-cycle model. Aquatic stages (J) and adult stages (A) are denoted by their genetic composition: wild type (W) or gene drive (D). All mating crosses are possible and the offspring are generated according to Table . Mortality occurs with at a density-dependent rate from the aquatic stages and a constant rate from the adults stages, both denoted by a diagonal arrow.
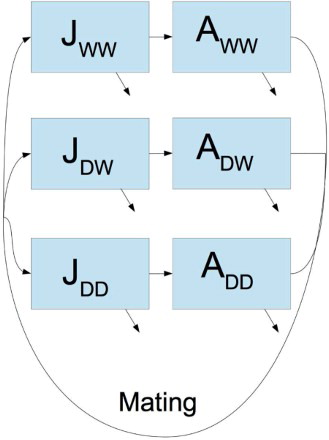
Let W denote the naturally occurring ‘wild type’ allele and D the new allele, which inhibits fertility and displays the gene drive phenomenon. Adults are categorised by their allele representation as denoted by subscripts. We assume that individuals reproduce as before, but all homogeneous gene drive females (
) have an associated fertility cost given by
(where
is defined as the fertility of the homogeneous females). The alleles are co-dominant so that
may have some fitness cost to fertility 1−f (where f is defined as the fertility of the heterogeneous females). We impose parameter bounds for fitness such that
. The total adult population is now given by
.
From the basic model, a proportion of females successfully mate where rA represents the total number of adult males in the population, which can be broken down by the type of male so that
The fecundity for females of type
is β. Due to a fitness cost, heterogeneous females (
) have a fecundity that is a fraction f of that for
females (
). Under these assumptions, for example, the probability that a single female type DW mates with a type WW male is
, and the female produces
eggs.
Gene drive allows for alleles to be spread at a greater rate than Mendelian inheritance. We will assume that x is the strength of spread of the new allele where . When
, the gene exhibits normal Mendelian inheritance. The contribution of each adult class to the aquatic population is found by considering all possible matings as follows
We then split up the offspring of each male-female pairing into the appropriate aquatic group. For example, a heterogeneous gene drive (
) male mating with a homogeneous wild type (
) female, produces only two types of offspring: homogeneous wild (
) or heterogeneous gene drive (
). Based on the strength of the gene drive, a proportion of the offspring (1−x) are homogeneous wild type and the others (x) are heterogeneous gene drive. Details of each mating are provided in Table .
Our full model with gene drive is given by
(3)
(3)
3. Results and discussion
We begin with a general analysis of our models by determining the equilibria of the basic model of mosquito population dynamics and discussing their stability. We then find the equilibria of the model that includes transgenic mosquitoes in the context of fixed parameter sets. Finally, we present numerical simulations of the model under variable parameter sets.
3.1. Analysis of basic model of mosquito population dynamics
To ensure biological realism, we assume all parameter values are positive. In the absence of Allee effects (), the basic model of mosquito population dynamics has two possible equilibria: the first corresponds to population extinction,
; and the second is a non-zero equilibrium,
where
The equilibria change stability at
. If
, then the extinction equilibrium is stable and
is unstable. If
, the opposite is true, that is, the extinction equilibrium is unstable and
is stable. Noticing the divergence of the vector field is always negative for biologically realistic parameter values and population sizes, applying Bendixson's criterion, there are no closed orbits. This implies when
the extinction equilibrium is globally asymptotically stable and when
the positive equilibrium is globally asymptotically stable.
When an Allee effect exists () in the basic model, three equilibria are possible. For all biologically relevant parameter values, there exists a locally stable extinction equilibrium
. In addition, there may be two other real-valued equilibria in the system, arising from a saddle node bifurcation at
When
, the non-zero equilibria are imaginary and the extinction equilibrium is globally asymptotically stable as there are no closed orbits (Bendixson's criterion). When
, there exist two real non-zero equilibria, both with the same sign as the term squared in the numerator, that is,
. The two positive equilibria in the basic model when s<0 are given by
A bifurcation diagram of how the the positive equilibria depend on the Allee constant is given in Figure (a). Here, the smaller of the two positive equilibria corresponds to the Allee threshold (the population size below which the per capita growth rate is negative) and the larger equilibrium corresponds to the carrying capacity (the population size above which the growth rate becomes negative). Therefore, the Allee threshold is unstable and the carrying capacity is locally stable (as shown in Appendix A.1).
Figure 2. Equilibrium values and stability change with Allee effect and density-dependent mortality. (a) A bifurcation diagram as the Allee constant δ varies. The equilibrium value at the bifurcation, marked by a star in (a), is highly correlated with the Allee constant (b) and density-dependent mortality (c). The diagram in (a) is computed with the parameters from Table . The LHS parameter sets were used to calculate the bifurcation values for (b) and (c). Parameter sets are the same as those used in Figure .
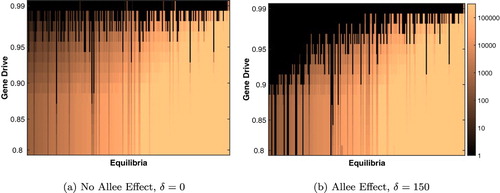
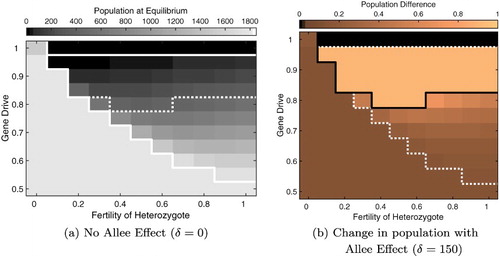
Figure 3. Effect of varying gene drive on the equilibrium of the full model. (a) Without an Allee effect, gene drive stronger than 95% is necessary for extinction with most parameter sets. (b) With an Allee effect, population extinction is attained for a wider range of gene drive strengths. The colour represents the equilibrium population size, with brighter colours associated with larger population size (visualized on a log-scale). Parameter sets are ordered on the x-axis by their equilibrium population size when . Parameters are found in Table .
To illustrate the dependence of the saddle bifurcation point (red cross in Figure (a)) on parameterization, we select 192 parameter sets (details below) and determine the Allee constant δ such that , that is, at the saddle node bifurcation. We graph the computed bifurcation values against the Allee constant δ and the density-dependent mortality rate of larva
in Figure (b,c), respectively. We observe a linear relationship in log-log space with a positive correlation (
) between the Allee constant and the bifurcation value in contrast to a negative correlation (
) between the density-dependent death rate and the bifurcation value.
3.2. Analysis of dynamics with transgenic mosquitoes
In the full model including gene drive, it is difficult to find a comprehensible analytical solution. We first consider the case where the equilibrium for , which implies that
. At equilibrium, the differential equation for
becomes
Notice that the equilibrium for
only occurs if either
or
. First, if
, as we are under the assumption of
, we return to the same results as the basic model. Thus, we consider the case where
, in addition to
. With the assistance of Mathematica, we obtain the following equilibria for
The equilibria are not dependent on the fertility of the heterozygotes f, but the stability of these equilibria do change based on the parameter f. We examine the stability of these equilibria where
and
or 150. Biologically if
, only a fraction of a mosquito exists, so we will only discuss results where there is at least one mosquito. Further discussion of the stability of equilibria in the gene drive model can be found in Appendix A.2.
3.2.1. Absence of an Allee effect
Consider the case when there is no Allee effect and there can exist one positive
equilibrium and one positive
equilibrium in addition to the extinction equilibrium. As we are working under the assumption
there are no positive equilibria where both
and
co-exist. The stability of the
equilibrium depends on the gene drive x and the fertility of the heterozygotes f. In the case of the parameters from Table , the wild type only equilibrium is locally stable when
. Notice that the stability is not affected by the fertility of the homozygotes
. In contrast, the stability of the
equilibrium additionally depends on the fertility of the homozygotes
as well as the gene drive x and the fertility of the heterozygotes f. Furthermore, with the chosen parameter set (Table ) when
, there exists multi-stability between the wild type only, gene drive only, and extinction equilibria. In other words, the initial conditions determine when the adult population will be composed entirely of
or
mosquitoes (or no mosquitoes).
Table 1. Parameter ranges and a specific parameter set for An. gambiae at  C.
C.
When , the only possible equilibria either are composed entirely of gene drive homozygous mosquitoes or no mosquitoes at all, that is, extinction. There is a clear division of this space into where the gene drive equilibrium is stable or unstable, but the analytical formula is complicated and rather uninformative. Numerically, with the
parameterization in Table , the
equilibrium is unstable when
Note, these values were commuted in Mathematica and rounded.
3.2.2. Presence of an Allee effect
When an Allee effect is included, , more equilibria are possible, even with the simplifying assumption
. For example, consider
, with the parameterization in Table . There are five possible equilibria: the extinction equilibria, two positive equilibria with only wild type mosquitoes (
) and two positive equilibria with only gene drive homozygotes (
). The latter two equilibria are only real and positive when
or numerically with the parameterization from Table , when
. The larger equilibria in magnitude for
and
demonstrate qualitatively similar local stability patterns to those observed for the non-zero equilibrium in the basic model. The smaller
equilibrium is always unstable. The smaller
equilibrium has more complicated stability changes, which we only determine numerically.
3.2.3. Coexistence equilibria
It is possible for equilibria where to exist in our system. However, these are analytically difficult to determine. For particular parameter sets we find coexistence equilibria numerically, for example in the lower right in Figure . In addition, there are multiple equilibria which are not biologically relevant, that is,
with
.
3.3. Numerical results
3.3.1. Parameter ranges
Parameter values are highly species specific and dependent on many factors including temperature, diet, and mosquito size. We consider mosquitoes of genus Anopheles and Aedes, and specifically focus on An. gambiae, as these mosquitoes are primary vectors for the diseases that cause significant global public health impact [Citation9,Citation26,Citation35–38]. We set upper and lower bounds for each parameter based on published experimental data, and vary the parameters within these bounds (Table ). Based on temperature-specific data, we also fix a specific parameter set for An. gambiae at approximately 26C as a baseline (Table ).
Parameters are ascertained from the life history of mosquitoes. The fecundity β is determined by both the number of eggs per gonotrophic cyclic (approximately 50 to 122 eggs per gonotrophic cycle) and the number of days in a gonotrophic cycle (laying every 2 to 4 days in favourable environmental conditions) [Citation7,Citation11,Citation12,Citation15]. The proportion of males r is similar or slightly higher than females [Citation7,Citation12]. The transition from eggs to adults α takes between 8 and 30 days [Citation5,Citation12,Citation27,Citation32]. Adult mosquito life expectancy, related to adult mortality rate , varies between 8 and 30 days [Citation2,Citation25,Citation28]. Survival of larvae to adulthood, related to aquatic mortality rate
, is extremely temperature dependent and can vary from 3% to 93% [Citation5,Citation12,Citation27,Citation32]. Determining the density-dependent mortality rate from experimental evidence is more challenging. Previous estimates for this parameter vary significantly [Citation13,Citation21], so we allow
to vary over a broad range of values.
The value of the Allee constant δ is not known for mosquitoes, although there exist estimates for other insect species. For example, in a study on gypsy months in different states, two different Allee threshold values were determined: 0.78% and 3.1% of the estimated carrying capacity [Citation30]. As a result, we assume the mate-finding Allee effect to be a small percentage of the carrying capacity, if it exists. We choose δ such that the Allee effect is at most 15%. We run all simulations with and
.
3.3.2. Parameter variation
We use Latin Hypercube Sampling (LHS) and filter our parameterization based on biologically derived criteria in the absence of gene drive. Specifically, we use n=225 LHS samples and a two-step filter process on the data. The first filter step chooses parameter sets such that there exist only non-zero equilibria that are real and positive. This amounts to only allowing parameter sets which fall to the left of the bifurcation value (star in Figure (a)). Approximately 85% of the total LHS samples are retained. Biologically if there exists a mate-finding Allee effect, we expect the number of mosquitoes necessary to find a mate to be relatively small compared to the carrying capacity. The relative Allee effect can be calculated as . We therefore use a second step in our filter process to refine our parameter sets to those with relative Allee effects of less than
. This retains ∼99% of the parameter sets from the first stage of the filter process. In total, we are left with 190 parameter sets that fulfill both criteria.
3.3.3. Simulation results
We carry forward the parameterization from the basic model for the gene drive model. We vary all the additional parameters found in the gene drive model: x, f, and . We assume greater-than-Mendelian inheritance bias of the gene drive allele,
that is, x>0.5. We consider the effect of the gene drive allele on the fertility of mosquitoes, such that
.
To begin, we fixed the fertility of heterozygotes to be f=0.5 and homozygous gene drive to be , and varied the gene drive strength for our parameter sets. We numerically determined the equilibria of the gene drive model with an initial population size set just above the Allee threshold
found from the basic model. In Figure , the parameter sets are ordered by the non-zero equilibrium from the basic model without an Allee effect, although the relative Allee effect (
) gives a similar ordering (not pictured). From Figure , we find that gene drive must be stronger than 95% to drive the population to extinction in most parameter sets. At lower values of the equilibrium of the basic model increases, particularly when an Allee effect is present (further to the left in Figure (b)), a lower level of gene drive is sufficient to achieve elimination of the mosquito population. Notice that parameter sets which produce nearly identical equilibrium values, and are thus ordered sequentially along the x-axis, may require very different levels of gene drive to reach extinction (Figure ). The reason for this variation in gene drive requirements is due to the values of individual parameters that differ between the parameter sets.
Next we relaxed our assumption on the fertility of heterozygotes, while the fertility of gene drive homozygotes remain fixed at zero (), and varied gene drive strength. All other parameters were fixed to the Anopheles specific parameters found in Table . Elimination was observed for a wide range of f when gene drive was above 95% (Figure ), regardless of the inclusion of an Allee effect. In the absence of an Allee effect, we find that based on the initial conditions, the adult population becomes either all wild type mosquitoes
or all homozygous gene drive type
(Figure (a)). In the presence of an Allee effect, we find that the population equilibrium decreases in all instances where gene drive mosquitoes previously dominated (Figure (b)). Notice, that there is a minimum level of fertility of heterozygotes for persistence of the gene drive population. Below this level mosquitoes with gene drive alleles lack sufficient progeny, so the allele cannot be passed on to the next generation (Figure , lower left corner).
Figure 4. Equilibrium for the full model when gene drive strength and heterozygous fertility are varied. (a) The equilibrium size when there is no Allee effect and (b) the fraction reduction in the population size when the Allee constant is . Darker colours indicate smaller population size in (a) or smaller change in the presence of an Allee effect (b). Solid lines separate the space into regions with qualitatively different equilibria. Dashed lines show the regions on the other plot, for ease of comparison. Parameters from Table .
To consider variation in the fertility of both gene drive homozygotes and heterozygotes, we assume presence of an Allee effect and examine three scenarios of gene drive strength: 50%, 80% and 95%. Under Mendelian inheritance (x=0.5), the wild type only equilibrium is locally stable for all levels of homozygous and heterozygous fertility (Figure (a)). Depending on the initial conditions, however, it is also possible to reach a gene drive only equilibrium, as a region of multi-stability is present in the system. Furthermore, the region where only the wild type population exists is divided into two distinct regions: where no gene drive equilibrium is possible () and where the equilibrium is unstable.
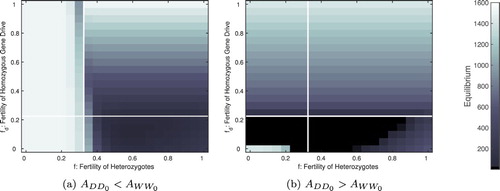
Figure 5. Bifurcation diagrams of the full model when varying both heterozygous and homozygous fertility but assuming the absence of heterozygotes. In the presence of an Allee effect (), the regions of existence and stability change with increasing gene drive strength, x: (a) 50%, (b) 80%, and (c) 95%. Below the horizontal line
a non-zero equilibrium does not exist for the gene drive population. To the left of the vertical line in (b) and (c) the wild type only equilibrium is not stable. All other parameters from Table . Note: we assume
for the determination of equilibria and stability.
Figure 6. Adult population size after three years when varying both heterozygous and homozygous fertility. The plots differ only in their initial levels of adult homozygous mosquitoes: (a) larger initial size of the wild type population relative to the gene drive population, ,
; (b) a larger initial size of the gene drive population
,
. Here a gene drive strength of 80% and an Allee effect with Allee constant
are assumed. All other parameters from Table . The bifurcation lines in the absence of a heterozygous population (from Figure ) are overlaid.
In the presence of gene drive (x>0.5) the region where the wild type only equilibrium is locally stable shrinks to low values of the heterozygous fertility, f (Figure (b,c)). For larger heterozygous fertility and low homozygous fertility
extinction is predicted assuming no heterozygous equilibria are possible, that is,
(Figure (b,c), lower right corner). Our biological expectation is a monotonic increase of the fertility trait from heterozygotes to homozygotes. If we restrict ourselves to that region, below the y=x line in Figure , we see that it is a region that is dominated by extinction and gene drive only equilibria.
A detailed numerical examination of our model with an Allee effect supports our analytical results under our simplifying assumption of no heterozygotes. We discuss in detail when gene drive strength is 80%, but similar results occur for all gene drive considered (not pictured). In regions of known bi- or multi-stability our initial levels of gene drive or wild type mosquitoes matter (Figure (a,b), upper left corner). When the wild type population excludes the gene drive population, an identical wild type equilibrium is reached regardless of the fertility of the homozygous gene drive population. In contrast, when the gene drive population excludes the wild type population, the equilibrium population size is dependent on the fertility of both the heterozygotes and the homozygous gene drive population. When fertility of the gene drive population is very low () then the population may get pushed below the Allee threshold causing it to crash (Figure (b)). Finally, in our numerical examination we also observe the persistence of population where we predicted the extinction of the population. This is due to the presence of co-existence equilibrium (Figure , positive values in the lower right). These co-existence equilibria require the persistence of the heterozygous population, that is,
.
4. Conclusion
In this paper, we examined the impact of a novel control method on an invading mosquito population. Releasing sterile mosquitoes has been modelled previously; however one of the biggest issues with sterile release is the success of the released mosquitoes in competing with the native populations. For this to be successful, most models show a need for continual releases of sterile mosquitoes. A more efficient method would be if the gene of sterility could spread through the population. To investigate this, we developed a mathematical model of mosquito populations and then introduced gene drive. Our results show that it can be effective, but the drive through the population needs to be at a high level in order to guarantee conditions which will stop invasion. Overall, if gene drive is over 99% then for all parameter values considered it will prove effective. This high level of gene drive is unlikely in reality (although rates of greater than 90% gene drive have been observed experimentally) as resistance of the gene in the host may occur [Citation17]. However, our model shows that even with Mendelian inheritance (gene drive of 50%), it is possible to eliminate the invading mosquito population under certain conditions. In particular, if a strong Allee effect exists in mosquitoes, the use of gene drive is much more effective.
Preventing the invasion of mosquitoes into new territories will impact their ability to spread disease to those areas. In most infectious disease modelling, spread of the disease is quantified by the reproduction number . When calculating
for mosquito-borne diseases, the population of mosquitoes is an important component. A strong Allee effect decreases the population number, which would decrease
. Coupled with the effects of introducing gene drive into an invading mosquito population, our results suggest gene drive can offer a viable method of control in the efforts to reduce mosquito-borne diseases.
Disclosure statement
The authors declare no conflicts of interest.
ORCID
Lauren M. Childs http://orcid.org/0000-0003-3904-3895
Additional information
Funding
References
- R. Anguelov, Y. Dumont, and J. Lubuma, Mathematical modeling of sterile insect technology for control of Anopheles mosquito, Comput. Math. Appl. 64 (2012), pp. 374–389.
- M.L. Artis, D.L. Huestis, and T. Lehmann, The effects of oviposition-site deprivation on longevity and bloodfeeding rate in Anopheles gambiae, Parasit. Vectors 7 (2014), p. 163.
- A. Aryan, M.A.E. Anderson, K.M. Myles, Z.N. Adelman, and I.A. Hansen, Talen-based gene disruption in the dengue vector Aedes aegypti, PLoS One 8 (2013), p. e60082.
- H.J. Barclay, The sterile insect release method on species with two-stage life cycles, Res. Popul. Ecol. 21 (1980), pp. 165–180.
- M.N. Bayoh and S.W. Lindsay, Temperature-related duration of aquatic stages of the Afrotropical malaria vector mosquito Anopheles gambiae in the laboratory, Med. Vet. Entomol. 18 (2004), pp. 174–179.
- L. Berec, E. Angulo, and F. Courchamp, Multiple Allee effects and population management, Trends Ecol. Evol. 22 (2007), pp. 185–191.
- H. Briegel and S.E. Timmermann, Aedes albopictus (diptera: Culicidae): Physiological aspects of development and reproduction, J. Med. Entomol. 38 (2001), pp. 566–571.
- K.M. Campbell, K. Haldeman, C. Lehnig, C.V. Munayco, E.S. Halsey, V.A. Laguna-Torres, M. Yagui, A.C. Morrison, C. -D. Lin, T.W. Scott, and E. Michael, Weather regulates location, timing, and intensity of dengue virus transmission between humans and mosquitoes, PLoS Negl. Trop. Dis. 9 (2015), p. e0003957.
- CDC, West Nile Virus, 2017. Available at https://www.cdc.gov/westnile/index.html.
- CDC, Zika Virus, 2017. Available at https://www.cdc.gov/zika/vector/range.html.
- C.D. Christiansen-Jucht, P.E. Parham, A. Saddler, J.C. Koella, and M.G. Basáñez, Larval and adult environmental temperatures influence the adult reproductive traits of Anopheles gambiae ss, Parasit. Vectors 8 (2015), p. 456.
- H. Delatte, G. Gimonneau, A. Triboire, and D. Fontenille, Influence of temperature on immature development, survival, longevity, fecundity, and gonotrophic cycles of Aedes albopictus, vector of chikungunya and dengue in the Indian Ocean, J. Med. Entomol. 46 (2009), pp. 33–41.
- C. Dye, Models for the population dynamics of the yellow fever mosquito, Aedes aegypti, J. Animal Ecol. 53 (1984), pp. 247–268.
- V.M. Gantz, N. Jasinskiene, O. Tatarenkova, A. Fazekas, V.M. Macias, E. Bier, and A.A. James, Highly efficient Cas9-mediated gene drive for population modification of the malaria vector mosquito Anopheles stephensi, Proc. Natl. Acad. Sci. 112 (2015), pp. E6736–E6743.
- M.T. Gillies and T.J. Wilkes, A study of the age-composition of populations of Anopheles gambiae giles and A. funestus Giles in North-Eastern Tanzania, Bull. Entomol. Res. 56 (1965), pp. 237–262.
- N. Gratz, Critical review of the vector status of aedes albopictus, Med. Vet. Entomol. 18 (2004), pp. 215–227.
- A. Hammond, R. Galizi, K. Kyrou, A. Simoni, C. Siniscalchi, D. Katsanos, M. Gribble, D. Baker, E.Marois, S. Russell, A. Burt, N. Windbichler, A. Crisanti, and T. Nolan, A CRISPR-Cas9 gene drive system targeting female reproduction in the malaria mosquito vector Anopheles gambiae, Nat. Biotechnol. 34 (2015), pp. 78–83.
- J. Hemingway, B.J. Beaty, M. Rowland, T.W. Scott, and B.L. Sharp, The innovative vector control consortium: Improved control of mosquito-borne diseases, Trends Parasitol. 22 (2006), pp. 308–312.
- D. Kamerow, The world's deadliest animal, BMJ 348 (2014), p. g3258.
- K. Kupferschmidt, After 40 years, the most important weapon against mosquitoes may be failing, 2016. Available at http://www.sciencemag.org/news/2016/10/after-40-years-most-important-weapon-against-mosquitoes-may-be-failing.
- M. Legros, A.L. Lloyd, Y. Huang, and F. Gould, Density-dependent intraspecific competition in the larval stage of Aedes aegypti (diptera: Culicidae): Revisiting the current paradigm, J. Med. Entomol. 46 (2009), pp. 409–419.
- J. Li, L. Cai, and Y. Li, Stage-structured wild and sterile mosquito population models and their dynamics, J. Biol. Dyn. 11 (2017), pp. 79–101.
- S. Lindsay and W. Martens, Malaria in the African highlands: Past, present and future, Bull. World Health Organ. 76 (1998), p. 33.
- E.O. Lyimo and W. Takken, Effects of adult body size on fecundity and the pre-gravid rate of Anopheles gambiae females in Tanzania, Med. Vet. Entomol. 7 (1993), pp. 328–332.
- K. Ohashi, K. Nakada, T. Ishiwatari, J. Miyaguchi, Y. Shono, J.R. Lucas, and N. Mito, Efficacy of pyriproxyfen-treated nets in sterilizing and shortening the longevity of Anopheles gambiae (diptera: Culicidae), J. Med. Entomol. 49 (2012), pp. 1052–1058.
- C. Paupy, H. Delatte, L. Bagny, V. Corbel, and D. Fontenille, Aedes albopictus, an arbovirus vector: From the darkness to the light, Microb. Infect. 11 (2009), pp. 1177–1185.
- L.M. Rueda, K.J. Patel, R.C. Axtell, and R.E. Stinner, Temperature-dependent development and survival rates of Culex quinquefasciatus and Aedes aegypti (diptera: Culicidae), J. Med. Entomol. 27 (1990), pp. 892–898.
- D. Susanna and T. Eryando, The longevity of Anopheles sundaicus in a small area: Nongsa Pantai Villages, Batam City, Indonesia, Malar. J. 11 (2012), p. P93.
- C.M. Taylor and A. Hastings, Allee effects in biological invasions, Ecol. Lett. 8 (2005), pp. 895–908.
- P.C. Tobin, S.L. Whitmire, D.M. Johnson, O.N. Bjørnstad, and A.M. Liebhold, Invasion speed is affected by geographical variation in the strength of Allee effects, Ecol. Lett. 10 (2007), pp. 36–43.
- H.E. Tonnang, D.P. Tchouassi, H.S. Juarez, L.K. Igweta, and R.F. Djouaka, Zoom in at African country level: Potential climate induced changes in areas of suitability for survival of malaria vectors, Int. J. Health Geogr. 13 (2014), p. 12.
- W. Tun-Lin, T.R. Burkot, and B.H. Kay, Effects of temperature and larval diet on development rates and survival of the dengue vector Aedes aegypti in north Queensland, Australia, Med. Vet. Entomol. 14 (2000), pp. 31–37.
- M.T. White, J.T. Griffin, T.S. Churcher, N.M. Ferguson, M.G. Basáñez, and A.C. Ghani, Modelling the impact of vector control interventions on anopheles gambiae population dynamics, Parasit. Vectors 4 (2011), p. 153.
- WHO, Pesticides and their application: For the control of vectors and pests of public health importance, 2006.
- WHO, Chikungunya: Fact Sheet, 2017. Available at http://www.who.int/mediacentre/factsheets/fs327/en/.
- WHO, Dengue and severe dengue: Fact Sheet, 2017. Available at http://www.who.int/mediacentre/factsheets/fs117/en/.
- WHO, Malaria: Fact Sheet, 2017. Available at http://www.who.int/mediacentre/factsheets/fs094/en/.
- WHO, Zika: Fact Sheet, 2017. Available at http://www.who.int/mediacentre/factsheets/zika/en/.
- C.R. Williams, K.J. Leach, N.J. Wilson, and V.R. Swart, The Allee effect in site choice behaviour of egg-laying dengue vector mosquitoes, Trop. Biomed. 25 (2008), pp. 140–144.
Appendix 1. Gene drive model derivation
We provide a detailed description of all fecundity terms, that is, the result of all possible crosses in Table . These terms are included in System Equation3(3)
(3) .
Table A1. Origin of aquatic populations from crosses of wild type and gene drive adults.
Appendix 2. Derivation of equilibria
A.1. Basic model
In the main text we find the equilibria of the basic system. Here we discuss the stability of these equilibria.
We determine the stability of the equilibria in the presence of an Allee effect, when , by examining the eigenvalues of the Jacobian matrix
(A1)
(A1) evaluated at each equilibrium.
Considering the trivial equilibrium and evaluating the Jacobian, we find that our eigenvalues are
and
. As all parameters are non-negative, the eigenvalues are always negative, indicating the extinction equilibrium is always locally stable.
We now show that the non-zero equilibrium smaller in magnitude (i.e. closer to zero), , is unstable and the one larger in magnitude,
, is stable. It is sufficient to test if the trace(
and determinant(
for local stability. Considering (EquationA1
(A1)
(A1) ), the trace is always negative for biologically realistic parameters and equilibria, so if the determinant is positive,
the equilibrium will be stable. Let us assume that we have positive equilibriums, guaranteed when
as noted in the main text.
Then, we can rearrange determinant() as follows
So we see that if
(A2)
(A2) then the determinant(
) is positive and we have a stable positive equilibrium. In order to evaluate the when this occurs, let
(A3)
(A3) where
Assuming there exists a positive equilibrium, then we require
Now if we plug
into the condition found from (EquationA2
(A2)
(A2) ), we have the following
(A4)
(A4)
(A5)
(A5)
(A6)
(A6) From (*), we know that the term on line (EquationA4
(A4)
(A4) ) is positive. Considering only the larger equilibrium value
, we can also say that that the term on line (EquationA5
(A5)
(A5) ) is positive. This implies (EquationA2
(A2)
(A2) ) will be positive. This means the determinant(
) is positive and
is stable.
We know want to determine the stability of . Since all parameters will be positive, then Q,W,Z>0. Thus,
(A7)
(A7) Now if we consider only the smaller equilibrium value
, we see that (EquationA6
(A6)
(A6) ) is negative due to (EquationA7
(A7)
(A7) ). Thus, given a positive
, (EquationA2
(A2)
(A2) ) will be negative, demonstrating determinant(
) is negative and
is unstable.
A.2. Gene drive model
The equilibria for the gene drive model are more complicated. The extinction equilibrium () always exists. Here we consider four other equilibria that occur when
. When
, we find the same two equilibria as in the basic model, such that only wild type mosquitoes persist,
. Maintaining the assumption
, we also find two equilibria with only gene drive mosquitoes,
. The stability of these equilibria differ from in basic model.
A.2.1. Stability of the extinction equilibrium
To begin, we examine the extinction equilibrium and find that there are only two eigenvalues, and
, each with multiplicity of three. Thus, under our assumption of positive parameter values, the extinction equilibria is always stable.
A.2.2. Stability of the wild type only equilibrium
Consider and
with all other populations zero. We find with the assistance of Mathematica the following eigenvalues of the Jacobian, written in terms of
, as
where
Given positive parameters, as well as
and
, then four of the eigenvalues are always negative,
. It is possible for
and
to be positive. When either of these cases occur, the equilibrium would be unstable. Both
and
are dependent on the Allee constant δ. In addition,
is also dependent on the level of gene drive x and the heterozygous fertility f. Based on parameter values (Table ), we can determine numerically where stability changes.
A.2.3. Stability of the gene drive only equilibrium
Consider and
with all other populations zero. We find with the assistance of Mathematica the following eigenvalues of the Jacobian, written in terms of
, as
where
Similar to Section A.2.2, we find that given positive parameters, as well as
, and
, then all of the eigenvalues are always negative, except
and
. Both
and
are dependent on the gene drive strength x, Allee constant δ, and the fertility of the homozygous gene drive females
. Additionally,
is dependent on the heterozygous fertility f. Based on parameter values (Table ), we can determine numerically where stability changes.
Appendix 3. Gene drive model with migration
In our models presented in the main text, we ignored the continued invasion of mosquitoes. The assumption of a single event populating a new population is biologically possible if a batch of eggs are laid in a new area and hatch at approximately the same time. To consider the continue invasion of mosquitoes, we adapted our basic model to include a time-decaying adult migration term:
where M is the migration rate of adult mosquitoes; c is the deceleration of migrating mosquitoes into the area, that is, the rate mosquitoes lose interest in migrating; and
is the initial size of the migrating mosquito population. As under these assumptions the migrating population will eventually disappear, the addition of migration in this form does not effect the asymptotic dynamics. However, the decaying migration does effect the transient dynamics of the mosquito population.
We also make a similar adaptation to the gene drive model, that is, the addition of an extra equation for the migrating adult population, resulting in the system
where
,
, and all other parameters are defined as in the gene drive model. All migrating mosquitoes are assumed to be wild type.
All equilibria remain unchanged, but in the regions of multiple stability, which of the stable equilibria is reached may change due to the altered initial conditions. In other words, the migrating population contributes to the wild type population and acts like a larger initial influx of wild type mosquitoes. In addition, the inclusion of migrating mosquitoes can produce large changes in the transient behaviour (Figure ).
Figure A1. Transient dynamics of the model with and without migration. (a) The inclusion of immigrating mosquitoes (, c=0.5) boosts the transient mosquito population. (b) The rate of decay of migration c affects the size of the transient peak. Parameters from Table with f=0.5,
, and x=0.9.