
 ?Mathematical formulae have been encoded as MathML and are displayed in this HTML version using MathJax in order to improve their display. Uncheck the box to turn MathJax off. This feature requires Javascript. Click on a formula to zoom.
ABSTRACT
Bacteriophage can be an effective means of regulating bacterial populations when conditions allow phage invasion of bacterial colonies. Phage can either infect and lyse a host cell, or insert their DNA into the host cell genome; the latter process is called lysogeny. The clustered regularly interspaced short palindromic repeat (CRISPR) system, linked with CRISPR-associated (Cas) genes, is a regulatory system present in a variety of bacteria which confers immunity against bacteriophage. Studies of the group behaviour of bacteria with CRISPR/Cas systems have provided evidence that CRISPR in lysogenized bacteria can cause an inability to form biofilm. This allows CRISPR-immune bacteria in biofilms to effectively resist phage therapy. Our recent work has described a potential therapeutic technique to eradicate CRISPR-immune bacteria from a biofilm by a continuous influx of lysogens carrying an identical phage sequence. However, this model predicted that the CRISPR-immune population could persist for long times before eradication. Our current focus is on the use of diverse lysogens against CRISPR-capable bacterial populations. The goal of this work is to find a suitable strategy which can eradicate bacteria with a CRISPR system through the influx of finite amounts of distinct lysogens over fixed intervals.
Introduction
Bacteriophage (viruses that infect bacteria) adapt rapidly, such that bacterial defence mechanisms must continually evolve in order to sustain long-lasting phage–bacteria interactions. As each species exerts selective pressure for novel adaptation in the other, a complex co-evolutionary dynamical system emerges. Clustered regulatory interspaced short palindromic repeats (CRISPR) and the CRISPR-associated (Cas) genes constitute one of the advanced defence mechanisms of bacteria. CRISPR/Cas systems not only provide defence against external threats but also regulate the genomic structure of bacteria [Citation7, Citation43, Citation48]. Since CRISPR systems were first discovered a decade ago, their remarkable abilities in genome regulation have been extensively studied, and diverse practical applications such as genome editing/sequencing and immuno-therapy have emerged [Citation22, Citation41, Citation49]. In phage–bacteria interactions, CRISPR/Cas systems provide an effective defence against rapidly mutating bacteriophage due to their ability to confer rapidly adapting immunity [Citation6, Citation23]. In the past few decades, increasing concern over antibiotic resistance has revived the idea of using phage therapy, which can potentially eliminate bacterial infections, for medical purposes ([Citation3, Citation35], but also see [Citation13]). Bacteria containing CRISPR/Cas systems, however, may be immune to a wide range of bacteriophage, and may present a serious obstacle to phage therapy techniques [Citation9, Citation25]. Unfortunately, infections by bacteria equipped with CRISPR/Cas systems are inevitable since estimates indicate that approximately half of bacterial and archaeal species contain these defences [Citation7, Citation12, Citation46]. In addition, CRISPR/Cas mechanisms can provide an even stronger defence to bacteria in biofilms [Citation24], a context in which phage therapies are already very difficult to implement [Citation18, Citation31, Citation37].
Bacteriophage typically infect and kill bacterial host cells to produce more identical phage. However some phage, instead, have the ability to incorporate their genome into the bacterial genome. Bacterial cells containing the viral genome are referred to as lysogens; the viral genome incorporated into the bacterial DNA is called prophage. Lysogens can revert to productive infections at later times, infecting other bacteria. A functioning CRISPR/Cas system, however, does not allow lysogeny in the bacterial genome [Citation14], and in fact very few prophage are found in the genomes of bacteria containing CRISPR/Cas systems [Citation31]. A recent study has provided strong evidence that a particular type of CRISPR/Cas system (type 1F) prevents bacterial cells from forming biofilm, if the cell has been lysogenized by a bacteriophage [Citation21, Citation48]. Another study asserts that the CRISPR/Cas system can induce the death of a lysogen if the lysogen is infected by either the prophage that is induced by temperature increase or a plasmid insertion into the bacteria containing protospacer that is identical to the one present in already existing prophage [Citation14, Citation16, Citation26, Citation45]. In a recent study, CRISPR/Cas system (type III) has shown conditional tolerance over poly-lysogenized bacteria by co-existence, however, the system put their hosts to fitness disadvantage in mixed populations of Staphylococcus aureus [Citation17, Citation38, Citation42].
A number of mathematical models have been developed to study the ecological and evolutionary dynamics of the CRISPR-mediated immune response against rapidly adapting bacteriophage ([Citation11, Citation19, Citation20, Citation32], for review see [Citation28, Citation29]). The population dynamics of phage, sensitive and resistant non-CRISPR bacteria, and sensitive and immune CRISPR bacteria were first investigated in [Citation32], with a clear focus on experimentally testable predictions, and in the absence of adaptation or mutation. The co-evolution of phage and CRISPR-encoding hosts was incorporated in later models, which predicted the evolution of highly heterogeneous communities, in which newly emerging phage types replace the dominant types by selective sweeps, or previously dominant types re-emerge [Citation11]. Of particular interest was the prediction that ‘coalitions’ of strains with similar resistance phenotypes, but distinct genotypes (bacterial strains with different CRISPR spacers representing the same phage) should be observed. A recent study concludes that the CRISPR/Cas system is responsible for co-evolutionary arms race between bacteria and phages in order to provide survival advantages to both the host and the bacteriophage [Citation44].
Models of evolutionary dynamics in the presence of CRISPR have also demonstrated that selective pressures imposed by phage can explain the empirical observation within a population, newly acquired spacers display more diversity than older spacers [Citation20]. These differences in spacer diversity are also predicted in a stochastic model of bacteria–phage co-evolution [Citation19], which includes the detailed effects of spacer deletion, mutation and recombination. Moreover, bacteria with CRISPR/Cas system can acquire limited amount of spacer in a given amount of time and therefore can be eradicated by high viral mutation rates, suggesting that phage evolutionary behaviour is reciprocal to host immunity adaptability [Citation47].
Building on these previous contributions, we developed an approach to explore the role of CRISPR-encoding bacteria in a biofilm [Citation4]. In particular, three simple models were developed and analysed to predict the impact of CRISPR-immunity on the efficacy of phage therapy against a bacterial biofilm. An important novelty in the approach was to allow lysogens to invade the biofilm, since lysogens without CRISPR systems retain the ability to form biofilm. The lysogens can later be induced to produce viruses to infect CRISPR-immune bacteria. The model was the first approach in which phage–bacteria interactions were modelled within a biofilm that included lysogens, CRISPR-encoding bacteria, or both [Citation4]. This initial model, however, included only a single type of virus, producing a single prophage, whereas the use of multiple viruses is likely to offer a more effective therapeutic technique.
In the sections to follow, we extend this approach to include the possibility that several distinct phage may be used to eradicate a biofilm infection. In the presence of multiple phage, CRISPR bacteria must acquire immunity to every phage to ensure survival. Moreover, in this study, successive as well as simultaneous insertion of distinct lysogens are investigated to develop an optimal therapeutic technique, in which lysogens could successfully invade the biofilm in minimum time.
Methods
Model
We consider a model of N distinct phage populations, represented by a vector notation . The parameters and the time-dependent variables used in this model are defined in (). Phage adsorb to susceptible cells at rate β, resulting in lysogeny with probability
or lysis with probability
. Lysogeny will increase the density of lysogens carrying the specific prophage, whereas lysis increases the corresponding phage density with burst size b. The phage are lost at rate γ by dissolution or by adsorbing to bacterial cell debris.
Table 1. Nomenclature.
Two sets of bacterial populations compose the biofilm, i.e. bacteria carrying prophage, also known as lysogens, and bacteria with a CRISPR/Cas system
. Each element in these sets represents a bacterial population that grows logistically withthe maximum growth rate r and shared carrying capacity K. Each of these populations leaves the biofilm at rate η, the ‘sloughing off’ rate. The set of lysogens is indexed by the prophage sequences present in the bacterial genome. Since N is the total number of virus types in the model, there are
types of lysogen. For example, if N=3 there are eight populations of lysogens, represented by
where i, j and k are either 0 or 1, indicating the absence or presence of a specific prophage in the bacterial genome. Thus,
contains no prophage, whereas
carries all three prophage sequences. Each prophage is induced at the baseline rate α which results in the production of a burst of b bacteriophage and the death of the lysogen. The bacteriophage produced are all of a single type, corresponding the prophage sequence that was induced (see description of matrix
below).
The second set of bacterial populations contains CRISPR/Cas systems which act as an adaptive immune system. Each element of this set represents a population that is immune to specific phage types, corresponding to phage sequences that have been previously acquired by the CRISPR/Cas system. Phage whose sequences have not been acquired by a specific cell type can adsorb at rate β. For example, phage j can infect population
. In this case, the cell may acquire the j-type CRISPR-spacer with probability
, moving to the
population, or lysis may occur. Phage may also adsorb to CRISPR-immune bacteria, that is, there is a small probability of CRISPR failure
, and in this case lysis of the cell occurs. These assumptions lead to the following general set of equations (the LCV model):
(1)
(1)
(2)
(2)
(3)
(3) where
is called as a forcing function that represents the input of lysogens
to the system via lysogen therapy. Here, we study the sequential application of a defined sequence of lysogens to the biofilm. Note that each lysogen may contain one or more distinct prophages. Each lysogen in the sequence has an ‘interaction time’ that is divided into two phases. These phases are separated by an indicator function
, an element of
, as defined in Algorithm section. In the first ‘insertion’ phase
, the lysogen is applied to the environment surrounding the biofilm (
) for a specific period of time. In the second ‘competence’ phase
, the external source returns to zero (
) and the lysogens compete with other cells in the biofilm matrix. At the end of the interaction time, the next lysogen in the sequence is applied which follows the same instructions as above.
Symbols ,
,
and
represent matrices associated with the infection of lysogens, the infection of CRISPR bacteria, the production of free virus by induction and the production of free virus by lysis, respectively. The elements of these matrices are presented as the case study in Algorithm section, while the assumptions used for the development of each matrix in the model are described below.
The matrix represents the loss (or gain) in each lysogen population through infection. Thus, the matrix tracks which cell types are susceptible to which viral types, as well as which new lysogens are produced when lysogeny occurs. An additional parameter,
, allows partial immunity in the model to be tuned. Specifically, prophage sequences with higher indices may confer immunity against viruses with lower indices; while
is infected at rate β by
,
has a reduced infection rate
when infecting
. This allows the model to capture co-evolutionary scenarios, for example, in which ‘later’ viral subtypes may have emerged from, and thus be closely related to, earlier virus populations.
The second matrix similarly represents the loss (or gain), due to infection, of bacterial cells with CRISPR/Cas systems. The entries in this matrix include the spacer acquisition probability
and CRISPR failure with probability
. If an infected bacterium does not have the required spacer, it will shift to a new immunity class with probability
, while if it has the spacer, it is possible that it fails to recognize the protospacer and thus undergoes lysis with probability
.
The matrix represents the contribution made by lysogens, through induction, to each viral population. In the case of multi-prophage in a lysogen, the productivity increases while one prophage get production advantage over the others [Citation40]. Probabilities
,
and
etc. allow arbitrary scaling of the induction rate, such that lysogens carrying one, two or three prophages may be induced at different rates;
gives the probability that a specific prophage is induced, given i total prophage sequences in the genome. Note that if
, the net result is a linear scaling, in which for example
is induced overall at three times the rate of
. In contrast if
, the induction rate does not depend on the number of prophage sequences (for example if induction occurs due to environmental stress), and upon induction each prophage in the cell has an equal chance of producing the burst of b virions.
Finally, the matrix is given by the sum
. The latter matrices represent the contribution to the free phage populations from CRISPR bacteria and lysogens, respectively. The entries in
are straightforward, reflecting infections in which a spacer is not acquired, or infections resulting from CRISPR failure. The entries in
include any infections that do not result in lysogeny. Once again, the parameter
is included such that partial immunity against lower indexed viruses may by conferred by higher indexed prophage.
Algorithm
There are variety of ways to define therapeutic procedures; few are defined in Appendix 2, out of which, one procedural type, i.e. constant phases, is described here in detail. Given the total number of distinct prophage sequences (N), numerical solutions to the system of differential equations (Equations (Equation1
(1)
(1) )–(Equation3
(3)
(3) )) are obtained using the standard Runge–Kutta integration (ode15s in Matlab, MathWorks Inc.). The parameters and initial conditions are discussed in the following section.
Possible combinations of prophages harboured in the lysogen are called as therapeutic sequences. For N=3, four therapeutic sequences are made possible, namely, one prophage followed by two simultaneously, denoted by , three prophages each introduced separately, denoted by
, two prophages simultaneously followed by one separately,
, and finally the introduction of a lysogen containing all three prophage sequences,
. The first three sequences are known as successive therapeutic insertions while the last one is called as simultaneous therapeutic insertion of lysogens. The resulted sets of lysogen and CRISPR bacteria can be written in the vector form as
The forcing function
(t) is used in a vector form in modelled Equation (Equation1
(1)
(1) ). Each element of this vector is an indicator function that is represented by
with same indices as defined for lysogen. Thus, indices describe which lysogen is inserted into the biofilm. Therefore, it can be written as:
Note that the number of elements (populations) in the lysogen vector
and CRISPR bacteria vector
is the same. For N=3,
is given by
The matrix
is the same as
, except that the probability of lysogeny is replaced by the probability of gaining a CRISPR spacer, i.e.
is replaced by
. Thus,
where the notations
,
etc. have been introduced for simplicity. The matrix
occurs in the third equation of the LCV model and is the product of two matrices. The first is the binary matrix representing lysogens that carry a specific type of prophage as a 1, and 0 otherwise. The second matrix is a diagonal matrix which provides the probability of inducing specific prophage. The result is:
Finally, matrix
is the sum of two matrices
and
. The matrix
gives the contribution of each CRISPR population to the free virus populations and can be written for N=3 as
Note that the probability of gaining a spacer against the adsorbed phage is associated with those populations that are not yet immune to a specific phage type, whereas the probability of CRISPR-immunity failure is associated with CRISPR-immune populations. Similarly, for N=3 the matrix
can be written as follows:
Parameters and initial conditions
Baseline parameter values have been chosen wherever possible from previous experimental and theoretical studies [Citation2, Citation4, Citation11, Citation15, Citation27, Citation30, Citation33]. The values for the probabilities of CRISPR acquisition () and failure (
) are obtained from previous theoretical studies [Citation4, Citation11]. The probability of establishing lysogeny (
) is defined in such a way that one out of hundred cells adsorbing phage genetic material establishes lysogeny [Citation2, Citation30]. As a non-conservative choice for the study of biofilm eradication, we assume that prophage with higher indices confer no immunity to viruses with lower indices, i.e. the probability of infection by a lower indexed virus,
. Having said that this parameter can be set experimentally by setting phenotype resistant state of latest inserted bacteria [Citation8, Citation34].
The demographic parameters – carrying capacity K, bacterial growth rate r and phage induction rate and loss rates (α and γ) – are well defined in the literature as discussed in more detail in [Citation4]. However, here we take a burst size of b=150 phage/cell that is an average burst size of Escherichia coli and Pseudomonas aeruginosa [Citation2]. The baseline value for the adsorption rate is taken as cm2 / phage / h; sensitivity analysis was performed (see Results section) due to the high degree of uncertainty in this parameter [Citation8]. The parameter value for the sloughing off rate of the biofilm bacteria is chosen as
h1 [Citation4, Citation15].
The biofilm formation rate from the source of external lysogens applied during therapy is taken to be cells/cm2/ h. This estimate assumes that a high density of solitary bacteria can be maintained in the medium adjacent to the biofilm. A more detailed analysis of this parameter value is provided in [Citation4, Citation15]. The parameter values are provided in Table while the initial conditions in this section are
, all other populations in
,
and
.
Table 2. Baseline values for the parameters used in this study.
Therapeutic sequences
In the simulation results to follow, we take N=3 and consider a therapeutic protocol in which lysogens containing one, two or three prophage sequences are continuously introduced (input parameter in the LCV model) over fixed interval
. Each insertion phase is followed by a competence phase. We compare therapeutic sequences with the total therapeutic procedure length of 90 h. For example, if a lysogen with single prophage is introduced, then the insertion phase is
h and the competence phase
h before the next lysogen population is introduced. For the introduction of a lysogen carrying two distinct prophages, the insertion phase remains the same as
whereas the competence phase increases to 55 h.
During the insertion phase, the populations of any pre-existing lysogens and susceptible CRISPR bacteria can be drastically reduced in the biofilm. However, we have observed in the previous studies that extinction during the competition phase of either of the two bacteria takes sufficiently long time that 90-h therapeutic procedure is insignificant. Therefore, there is no need to set a bottom threshold value to consider any of the population below that threshold equals to zero. Moreover, increase in the competence phase for few hours has also shown no effect [Citation4].
‘Successive’ introductions include either one or two prophages per lysogen, whereas ‘simultaneous’ introductions include all three prophages in the lysogen. Successive introductions are denoted {1,1,1} for the insertion of three distinct prophage one after another, whereas for example {2,1} denotes the application of a single lysogen population carrying two distinct prophage sequences, followed by another lysogen population carrying the third prophage.
Results
Figure illustrates typical results predicted for 90-h therapeutic procedure and four possible therapeutic sequences. Note that each new lysogen class (solid line) was preceded by the extinction of already existing lysogen classes. As explained above, the non-conservative assumption has been made that newly inserted lysogen can be infected by already existing phage populations in the biofilm () if their genetic material is not harboured in the inserted lysogen. Conversely, new phage population was also able to start the lytic/lysogenic cycle in the case of their interaction with already existing bacteria.
Figure 1. Classes of three populations are presented in the above figure: phage populations (dashed lines), bacterial populations with CRISPR/Cas systems (dash-dot lines) and lysogens (solid lines). The therapeutic procedure time is set. The lysogens are inserted into the biofilm with up to three prophages either simultaneously or successively. The possible sequences of the number of prophages harboured in the lysogens are
and
, as described in the text. The colours of the curves are used to distinct each class of lysogen and CRISPR bacteria and are associated as described in the legend:
and
is for grey,
and
is for blue,
and
is for green,
and
is for cyan,
and
is for red,
and
is for pink,
and
is for cream,
and
is for black. Colours for phage populations are blue for
, cyan for
and black for
. Coloured areas under curves of therapeutic lysogens represent the insertion phase whereas light grey areas under curves correspond to the competence phase.
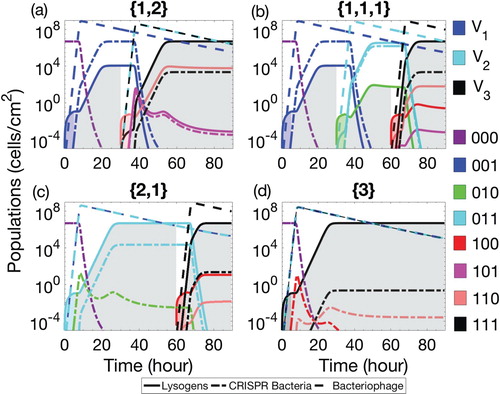
The distinct phage produced by a newly introduced class of lysogen infected the corresponding class of CRISPR bacteria. This process replaced an already existing class of CRISPR bacteria with a new class that was immune against all existing phage as shown in Figure . However, the total population of each class of CRISPR-immune bacteria was less than the preceding class. As a result, after successive therapeutic insertions (Figure ( a–c)), in a relatively short time, the total population of CRISPR bacteria was reduced far below the carrying capacity K. The introduction of a lysogen with multiple prophages (Figure (a–d)) has shown stronger effect than the successive introduction of single prophage (Figure (b)). On the other hand, each new class of lysogen outnumbered the previous lysogen classes and quickly approached the steady behaviour as bacteria reached the biofilm carrying capacity. This was desirable because the elimination of previous lysogen classes stops the production of phage types that can no longer infect the bacterial cells with CRISPR-immunity.
The growth and decay of bacterial classes were divided into two behavioural periods of the system, see Figure . During the first period, existing classes of bacteria extinct from the biofilm with the emergence of new classes of CRISPR bacteria and lysogen. The first period began when a new class of lysogen was introduced into the biofilm. These lysogen rapidly increased in the beginning and bounded by the carrying capacity of the biofilm. At the same time, phage population sufficiently increased in order to significantly infect the CRISPR bacteria. Subsequently, a huge amount of lytic infection took place to CRISPR bacteria that increased the phage population in the system. However, due to CRISPR-immune response, a new bacterial class quickly emerged that was immune against the existing phage. It is interesting to note that the emergence of new CRISPR-immune bacteria was due to the acquisition of phage by already existing CRISPR population and not by the bacterial growth. The first period was crucial in the sense that phage population has shown adverse effects on the population of CRISPR bacteria when lysogen was introduced with multiple prophages rather than a single prophage. Thus, CRISPR population significantly decreased in the presence of multiple distinct phage in the biofilm as compared to single phage, see Figure (a) and (d).
During the second period, both bacteria competed with each other to grow in the biofilm. The growth of CRISPR-immune bacteria was affected by CRISPR failure against acquired lytic phage adsorption. At the same time, growth of lysogen was affected by the prophage induction. However, the prophage induction indirectly affected the CRISPR bacteria as well by increasing the phage population in the biofilm. As soon as bacteria reached the carrying capacity, their populations became steady. The time duration of this steady behaviour during competition phase did not show any significant effects on the bacterial populations (see e.g. Figure (b) and (d)) which concludes that long competition phases does not affect the overall dynamics of the therapeutic procedure.
An important phenomenon has been observed that has shown the significance of early reduction of CRISPR bacteria by introducing lysogen with multiple prophages. The insertion of lysogen with multiple prophages during the first therapeutic phase has shown more reduction in CRISPR bacteria than the insertion of lysogen with multiple prophages during the later insertion phase, see Figure (a) and (c). This is because the early introduction of lysogen with multiple prophages (during first therapeutic phase, see Figure (c)) increased the second period of lysogen and has shown higher lysogen population in the biofilm when compared with a single prophage in the early inserted lysogen, see Figure (a)). Thus, during the second therapeutic phase, the lysogen raised quickly to high value in the first period of growth with all three prophages while shortened the second period of growth. The reason is the non-conservative condition () that has permitted phage adsorption to all kinds of bacteria accept the ones harbouring identical prophage.
Decrease in CRISPR bacteria by optimizing the insertion phase
At the end of each therapeutic insertion phase of lysogen, the total population density of CRISPR-immune bacteria was calculated to determine the optimal procedure time and best lysogen sequence. We examined each of the four possible sequences for 60, 90 and 180 h therapeutic procedures as shown in Figure . We observed that for any duration of the insertion phase, the therapies involving the simultaneous insertion of three prophages () gave the best results, although the combination of a lysogen with two prophages followed by a lysogen with one prophage (
) was also effective. Therefore, the results mentioned in Figure can be considered as an extended version of Figure . The variation in the duration of therapeutic procedures (60, 90 and 180-h procedures) have not shown any significant difference for their respective sequence.
Figure 2. Populations of CRISPR bacteria at the final time of therapeutic procedure of 60, 90 and 180 h. The insertion phase is varied between 0 and 15 h for each therapeutic sequence. Four possible combinations of prophages are considered: (a) one prophage followed by two simultaneously, denoted by , (b) three prophages each introduced separately, denoted
, (c) two prophages simultaneously followed by one separately,
, and finally (d) introduction of a lysogen containing all three prophage sequences,
. Therapeutic procedures for 60, 90 and 180 h are represented by blue circles, black solid lines and red + signs, respectively.
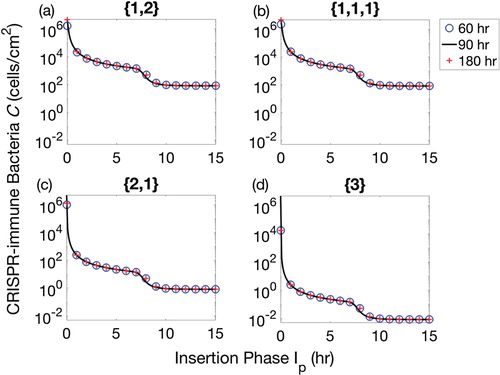
The time duration for the insertion phase have a strong effect on the eradication of CRISPR bacteria from a biofilm. This can be observed for each therapeutic sequence in Figure when the insertion phase was varied from 0 to 15 h. In this figure, decrease in the CRISPR population can be divided into two stages, depending upon the duration of the insertion phase; the first stage decrease was h while rest of the duration of the insertion phase
provide second stage decrease. This is due to the fact that lysogen population started their second behavioural period of growth from time >7 h, see Figure . When the insertion phase duration was greater than 7 h, the lysogen were kept inserted into the biofilm while second behavioural period was started. This helped lysogen to increase their population quickly in the biofilm. However, increasing
did not provide further reduction in the CRISPR bacteria, see Figure (column 3), because biofilm reached its carrying capacity. Thus, Figure suggested that
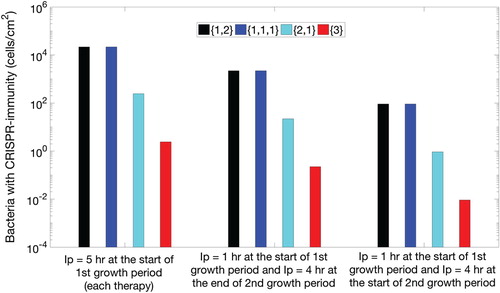
played a critical role in reducing the CRISPR population. In addition, first phase of lysogen therapy for few hours was enough to replace the existing bacterial class of CRISPR bacteria while the best reduction of CRISPR bacteria was possible when the second period of growth began. This means that if identical lysogen would have been re-inserted during the second growth period, CRISPR bacteria can be significantly reduced in a biofilm as shown in Figure . The procedure involving re-insertion of identical lysogen played a critical role in reducing the bacteria to its minimum. In Figure , three scenarios were drawn out of which first scenario was same as followed in the above figures. Clearly, it can be observed that early insertion of lysogen for 5 h was not a good strategy to follow. Instead, re-inserting identical lysogen during the second growth period significantly reduced bacteria for all therapeutic sequences. Moreover, the re-insertion of lysogen at the earlier time of second growth period has shown better results than the later time. In comparison between Figures and , more than 10 h continuous insertion of lysogen reduced CRISPR bacteria to the same level as 5-h therapy with an optimal re-insertion time.
Figure 3. Three sets of bar plots for the population of CRISPR bacteria in the biofilm against each therapeutic sequence with 90-h procedural time. For the first set of therapeutic sequences, first four bars on the left, lysogen are inserted in the biofilm at the start of the first growth period of each element of the therapeutic lysogen sequence (new class of lysogen). For the second set of therapeutic sequences, middle four bars, lysogen are inserted for 1 h at the start of the first growth period of each element of the therapeutic sequence and 4 h at the end of the second growth period of the same element of therapeutic sequence. Similarly, for third set of sequences (last four bars), lysogen are inserted for 1 h in the start of the first growth period of each element of the therapeutic sequence and 4 h at the start of second growth period of the same element of therapeutic sequence. Each set contains four possible sequences namely lysogen with one prophage followed by two simultaneously, denoted by (black colour), three prophages each introduced separately, denoted
(blue colour), two prophages simultaneously followed by one separately,
(cyan colour), and all prophages simultaneously,
(red colour).
Sensitivity analyses
Three parameters are analysed in this study to investigate their effects on the reduction of CRISPR bacteria in the biofilm. All other parameters are defined in Table . Figure provides an extension to the above result in Figure by comparing the insertion phases and 10 for two parameters, biofilm formation rate
and adsorption rate β. The biofilm formation rate, that is, the rate at which solitary bacteria join the biofilm, is a critical dynamical parameter but empirical estimates in the literature are unclear. In this study, we varied the biofilm formation rate,
, in the interval [0,3] to see its effects on the eradication of CRISPR-immune bacteria from the biofilm. Figure (a) and (c) demonstrates that simultaneous insertion of lysogen (
) minimized the population density of CRISPR-immune bacteria. This is consistent with the previous result in Figures and . The increase in the insertion phase (from
to 10) followed a translation of curve by further decreasing the CRISPR-immune bacteria in the biofilm.
Figure 4. Populations of CRISPR bacteria (C) against biofilm formation rate (subplots (a) and (c)) and adsorption rate β (subplots (b) and (d)) for 90-h therapeutic procedure. Four possible combinations of prophages are presented in each subplot, namely lysogen with one prophage followed by two simultaneously, denoted by
(solid line), three prophages each introduced separately, denoted
(dashed line), two prophages simultaneously followed by one separately,
(dotted line), and all prophages simultaneously,
(dash-dotted line).
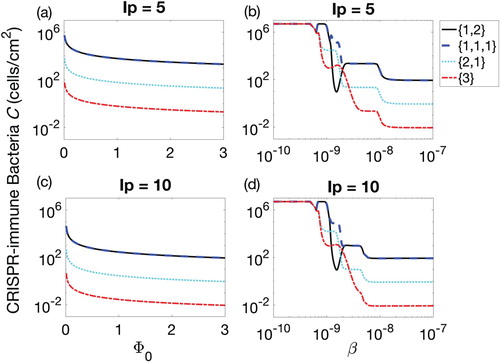
Figure 5. Parameter space defined between the biofilm formation rate and the adsorption rate β for 90-h therapeutic procedure. Colour bar on the right shows the colours pattern for the population density of CRISPR bacteria. Dark blue is the least population density, i.e. 0.01, while bright yellow is the population density of CRISPR bacteria near carrying capacity. Biofilm formation rate
is varied from 0.001 to 3 cells/cm2/h and adsorption rate is varied between
and
. Four possible combinations of prophages are considered: (a) one prophage followed by two simultaneously, denoted by
(solid line), (b) three prophages each introduced separately, denoted
(dashed line), (c) two prophages simultaneously followed by one separately,
(dotted line), and finally (d) introduction of a lysogen containing all three prophage sequences,
(dash-dotted line).
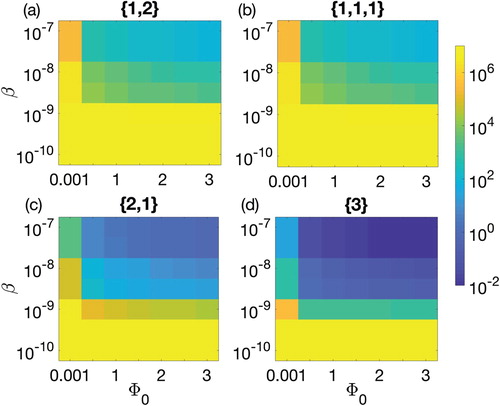
The adsorption rate, β, was varied from 10−10 cm2 phage−1 h−1 to 10−7 cm2 phage−1 h−1. Among the four therapeutic sequences, simultaneous insertion remained the best strategy. When β is increased from low to high values, the population of CRISPR-immune bacteria showed highly non-linear behaviour around 10−9 while the population behaviour was smooth before and after that interval. Before this non-linearity, the population remained at the carrying capacity because adsorption rate was so low that it did not significantly affect the CRISPR bacteria. The reason of the non-linearity around was again the low adsorption of phage into CRISPR bacteria that was not sufficient for 90-h therapeutic procedure. Due to this reason, the first period of growth extended in time while the second period of growth started so late that the procedural time ended before the system reached a steady behaviour. This brought an uncertain state in the therapeutic procedure that was necessary to be addressed to understand the effects of adsorption rate. Despite the slow adsorption rate, the therapeutic lysogen sequences with multi-prophage during their first phase of therapy were least affected by this uncertain output. In addition, at comparatively high adsorption rate, the therapeutic procedures were quite smooth as observed in Figure when
.
The increase in the duration of the insertion phase partially decreased the non-linearity interval, however, the non-linearity remains intact for β values around 10−9. Thus, the adsorption rate β was dependent upon the therapeutic procedure time, therapeutic sequence and the duration of
. For completing the analysis of the parameter set
and β, a parametric space was defined between the two parameters for each therapeutic sequence, see Figure . The parameter
did not show any effect on population of CRISPR bacteria for lower values of β as it was observed in the previous figure. However, it is interesting to observe that a small value of
managed to reduce CRISPR bacteria to a reasonably low level while β was high. For
, significant decrease was observed for all values of
, particularly in the case of best strategy
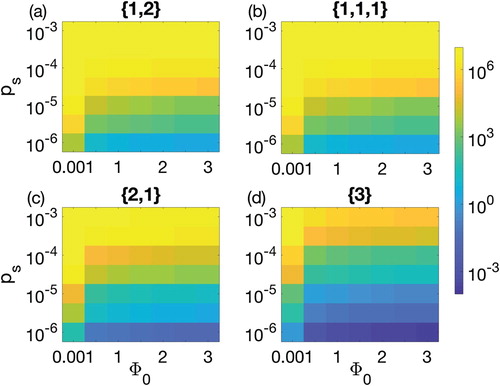
when C was dropped down to less than 1 cell/cm2. The parameter space could not capture the non-linearity that has been observed in Figure because the parameter space was defined on big step sizes of parameter values. Therefore, the linear behaviour clearly showed that increase in either of two parameters can lead us to a better reduction of CRISPR bacteria. Among the probabilities defined in the model, probability of gaining spacer played a significant role in varying population of CRISPR bacteria in the biofilm as shown in Figures and . Note that least value in the colour bar is less than 0.001 while maximum value is at the carrying capacity. It is well established that the acquisition and interference efficiency of CRISPR/Cas system reduces when phage has high multiplicity of infection [Citation32, Citation39]. Under such assumption, when probability of gaining spacer was increased, the model simulations predicted increase in CRISPR bacteria. For values of
, CRISPR bacteria remained at the biofilm carrying capacity for the strategies in Figure (a)–(c). However, CRISPR bacteria decrease as the probability of gaining spacer is reduced below
. In addition, there is possibility of further reduction in CRISPR bacteria by re-inserting the lysogen during the second growth period as describe in Figure .
Figure 6. Parameter space between the biofilm formation rate and the probability of gaining spacer
for 90-h therapeutic procedure. Colour bar on the right shows the colour pattern for the population density of CRISPR bacteria. Dark blue is the least population density, i.e. 0.0005, while bright yellow is the population density of CRISPR bacteria near carrying capacity
. Four possible combinations of prophages are considered: (a) one prophage followed by two simultaneously, denoted by
(solid line), (b) three prophages each introduced separately, denoted
(dashed line), (c) two prophages simultaneously followed by one separately,
(dotted line), and finally (d) introduction of a lysogen containing all three prophage sequences,
(dash-dotted line).
Discussion
The current study extends a previously studied competition model between lysogens with a single prophage and CRISPR-immune bacteria in a biofilm [Citation4]. The previous model provided a thorough stability analysis of the two competing populations, and demonstrated that high rates of lysogen insertion (biofilm formation rates) were necessary to eliminate CRISPR-immune bacteria from the biofilm. This work has provided a proof of concept in the form of a therapeutic model to show that insertion of lysogens with multiple, distinct prophage can replace CRISPR bacteria from the biofilm in a realistic amount of procedural time and at biologically plausible biofilm formation rates.
The therapeutic model follows a general matrix model for an arbitrary number of distinct prophage sequences, and then present results for three distinct prophages and four possible therapeutic sequences . Among these sequences, the simultaneous insertion of a lysogen with all three prophages was the most promising therapeutic strategy. These strategies further reduced CRISPR bacteria when lysogen insertion phase was prolonged so that it overlapped the two growth periods. Beside this, two growth periods were defined. It has been observed that the first growth period was only important to introduce lysogen in the biofilm so that virions could reach their peak value. As soon as the virions reached the peak, re-insertion of lysogen became effective. However, the effectiveness held until the biofilm reached its carrying capacity. The qualitative results were robust to sensitivity analyses performed on several parameters and conserved across duration of therapeutic procedures, see Figure .
CRISPR bacteria are eliminated faster than lysogens
As a result of the insertion of new class of lysogen into the biofilm, a new kind of bacteriophage is produced and adsorbed by the existing class of CRISPR bacteria. Consequently, a new class of CRISPR-immune bacteria emerges. The previous classes of CRISPR bacteria and lysogens are reduced because the newly emerging phage infection is lethal for both. However, the CRISPR population associated with the previous class decreases more rapidly, as some cells acquire the new spacer and contribute to the newly emerging CRISPR class. In Figure , we note that successive insertions and
do not initially show this behaviour since the population of CRISPR bacteria is quite high. However, this phenomenon is observed as soon as the population decreases through subsequent insertions. This shows that the effect of successive insertion is slower than a simultaneous insertion.
The relation between the rate of decrease in CRISPR bacteria and lysogens of any class can be analytically investigated. Assume that and
are the ith classes of CRISPR-immune bacteria and lysogen present in the biofilm. A new class of lysogen is inserted into the biofilm
which produces phage
that is infectious against the ith class bacterial populations. Thus, the ith class populations monotonically decrease after this time. Considering this as a starting time and taking the time derivative of the ratio between
and
, we find
A negative outcome of the above relation means that
decreases more rapidly than
, though, the concentration of
is very important since this rate of decrease depends upon the relation
. Thus, higher concentrations of
will increase the possibility of elimination of bacterial class
before
from the biofilm. The above relation is derived for lysogens carrying a single prophage, however, the general relation can be written in a similar way as,
, where
are the phage produced by lysis of
.
Optimal number of prophages per lysogen
The successive insertion of distinct lysogens, each set of lysogen carrying a specific prophage, is less effective than the simultaneous insertion of lysogens (i.e. each lysogen harbouring complete set of prophage), as shown in Figures –. This shows that CRISPR-immune bacteria suppress from the beginning of therapeutic procedure. However, successive insertions suppress CRISPR bacteria in multi-phases depending upon the efficacy of lysogen during each insertion phase, see Figure . In Figure (d), four classes of CRISPR-immune bacteria () and one class of lysogen (
) exist at the final time. On the other hand, several classes of lysogen (
) but only one class of CRISPR bacteria (
) exist after the successive insertion of lysogens, see Figure (b). Thus, simultaneous insertion allows greater diversity of CRISPR-immune bacteria and lesser diversity of lysogen classes as compared to successive insertion. Moreover, the phage density is also reduced in simultaneous insertion at the final procedural time which can significantly reduce the multiple infections to the CRISPR bacteria. Consequently, the events of CRISPR-immune failure decrease [Citation39]. Although the simultaneous insertion shows some evolutionary advantage to CRISPR-immune bacteria, it is not well understood how effective it could be during the therapeutic procedure.
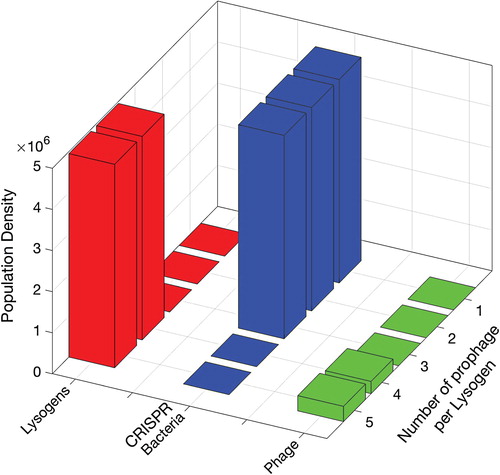
The results above suggested that therapies involving multiple prophages in a single lysogen (simultaneous insertion) were the most promising strategies. However, it was predicted in a previous study that CRISPR bacteria can again dominate in the biofilm if the lysogen therapy stopped before the complete eradication of CRISPR bacteria [Citation4]. Therefore, in the long run, it is very likely that CRISPR bacteria will get immunity against the introduced phages and will dominate the biofilm in case of three prophages. We therefore investigated the long-term effects of single insertions, involving lysogens carrying between 1 and 5 prophages simultaneously, see Figure . Informed by the results of Figure , the insertion phase was set to 5 h, followed by a long competence phase. The procedural time was chosen to be so that the system shows a steady state for enough long period of time while population density lower than
is considered zero. The total population of lysogens, CRISPR bacteria and phage at equilibrium are shown in Figure . For lysogens with up to three prophages, the population of CRISPR-immune bacteria re-emerged in the long run, despite the promising results of 90-h therapy as shown in Figure . However, the simultaneous insertion of a lysogen population with four or five distinct prophages was able to completely replace CRISPR bacteria.
Figure 7. Populations of CRISPR-immune bacteria at the final time after simultaneous insertion of lysogens with 1, 2, 3, 4 and 5 prophages. Each bar represents either population density of lysogen L, bacteria with CRISPR/Cas system C or phage V. The insertion phase is 5 h while the rest of the time is for the competence phase until the populations show a steady state for long enough time.
In this study, the simulations were based on an ODE model with mass action kinetics which assumes a well-mixed system. Such assumptions make difficult to tackle spatial aspects of a physical system and can be misleading. Particularly in case when viruses are produced by burst, not by the process of budding. In the case of viral production by bursting bacteria, hundreds of virions are released at a specific location that is surrounded by the host bacteria (C) which may increase the possibility of co-infection. Besides this, there are other aspects of spatial models that may favour the CRISPR bacteria in the biofilm. For example, once CRISPR bacteria is immune to the existing phage populations, a new class of lysogen needs to overtake the already existing lysogen in order to make possible the interaction between new phages with the CRISPR bacteria. Thus, the above presented results encourage us to make more rigorous analysis of this technique by means of spatio-temporal models in order to foresee the future of this therapeutic technique.
Conclusion
This study investigates a novel therapeutic technique by which ‘strong’ bacteria (CRISPR bacteria) may be replaced by ‘weak’ bacteria (lysogens) in a biofilm, in a reasonable therapeutic time. The main point of this study is not to find the best therapeutic strategy, but to show a ‘proof of principle’ that competition between lysogen cultured in laboratory settings and bacteria living in a biofilm can lead to the design of an efficient therapeutic technique. Ideally, genome editing could predispose the lysogens for programmed death after a specific period of time or in response to a specific biochemical signal [Citation14, Citation42]. Moreover, the time required for the therapeutic insertion of lysogens and the complete eradication of CRISPR bacteria predicted in this study is reasonable, showing potential for more rigorous analysis of this technique and some initial trials in laboratory settings. Ultimately, lysogen therapy, like phage therapy, may become a promising therapeutic technique for individuals experiencing chronic bacterial infections due to genetic disorders.
Acknowledgments
The author thanks Lindi M. Wahl, Professor at the Department of Applied Mathematics, Western University, for critically revising my manuscript. Her valuable suggestions in the modelling section make it a serious contribution.
Disclosure statement
No potential conflict of interest was reported by the author.
ORCID
Qasim Ali http://orcid.org/0000-0002-0609-2554
References
- S.T. Abedon, Bacteriophage Ecology, Advances in Molecular and Cellular Microbiology, Cambridge University Press, Cambridge, UK, 2008.
- S.T. Abedon, Bacterial ‘immunity’ against bacteriophages, Bacteriophage 2 (2012), pp. 50–54. doi:10.4161/bact.18609.
- S.T. Abedon, P. García, P. Mullany, and R. Aminov, Editorial: Phage therapy: Past, present and future, Front. Microbiol. 8 (2008), p. 981. doi:10.3389/fmicb.2017.00981.
- Q. Ali and L.M. Wahl, Mathematical modelling of CRISPR-Cas system effects on biofilm formation, J. Biol. Dyn. 11 (2017), pp. 264–284. doi:10.1080/17513758.2017.1314025.
- M. Ballyk, D. Jones, and H.L. Smith, The biofilm model of Freter: A review, in Structured Population Models in Biology and Epidemiology, P. Magal and S. Ruan, eds., Springer, Berlin, 2008, pp. 265–302.
- R. Barrangou, C. Fremaux, H. Deveau, M. Richards, P. Boyaval, S. Moineau, D.A. Romero, and P.Horvath, CRISPR provides acquired resistance against viruses in prokaryotes, Science 315 (2007), pp. 1709–1712. doi:10.1126/science.1138140.
- D. Bhaya, M. Davison, and R. Barrangou, CRISPR-Cas systems in bacteria and archaea: Versatile small RNAs for adaptive defense and regulation, Ann. Rev. Gen. 45 (2011), pp. 273–297. doi:10.1146/annurev-genet-110410-132430.
- J.J. Bull, C.S. Vegge, M. Schmerer, W.N. Chaudhry, and B.R. Levin, Phenotypic resistance and the dynamics of bacterial escape from phage control, PLoS One 9 (2014), p. e94690. doi:10.1371/journal.pone.0094690.
- K.C. Cady, J. Bondy-Denomy, G.E. Heussler, A.R. Davidson, and G.A. O'Toole, The CRISPR/Cas adaptive immune system of Pseudomonas aeruginosa mediates resistance to naturally occurring and engineered phages, J. Bact. 194 (2012), pp. 5728–5738. doi:10.1128/JB.01184-12.
- S. Chibani-Chennoufi, A. Bruttin, M.L. Dillmann, and H. Brüssow, Phage-host interaction: An ecological perspective, J. Bact. 186 (2004), pp. 3677–3686. doi:10.1128/JB.186.12.3677-3686.2004.
- L.M. Childs, N.L. Held, M.J. Young, R.J. Whitaker, and J.S. Weitz, Multiscale model of CRISPR-induced coevolutionary dynamics: Diversification at the interface of Lamarck and Darwin, Evolution 66 (2012), pp. 2015–2029. doi:10.1111/j.1558-5646.2012.01595.x.
- L. Deng, R.A. Garrett, S.A. Shah, X. Peng, and Q. She, A novel interference mechanism by a type IIIB CRISPR-Cmr module in Sulfolobus, Mol. Microb. 87 (2013), pp. 1088–1099. doi:10.1111/mmi.12152.
- R.R. Dwayne and D. Laurent, Phage therapy: Awakening a sleeping giant, Emerg. Top. Life Sci. 1 (2017), pp. 93–103. doi:10.1042/ETLS20170002.
- R. Edgar and U. Qimron, The Escherichia coli CRISPR system protects from λ lysogenization, lysogens, and prophage induction, J. Bact. 192 (2010), pp. 6291–6294. doi:10.1128/JB.00644-10.
- R. Freter, H. Brickner, J. Fekete, M.M. Vickerman, and K.E. Carey, Survival and implantation of Escherichia coli in the intestinal tract, Inf. Immun. 39 (1983), pp. 686–703.
- G.W. Goldberg, W. Jiang, D. Bikard, and L.A. Marraffini, Conditional tolerance of temperate phages via transcription-dependent CRISPR-Cas targeting, Nature 514 (2014), pp. 633–637. doi:10.1038/nature13637.
- G.W. Goldberg, E.A. McMillan, A. Varble, J.W. Modell, P. Samai, W. Jiang, and L.A. Marraffini, Incomplete prophage tolerance by type III-A CRISPR-Cas systems reduces the fitness of lysogenic hosts, Nat. Commun. 9 (2018), p. 61. doi:10.1038/s41467-017-02557-2.
- L. Hall-Stoodley, J.W. Costerton, and P. Stoodley, Bacterial biofilms: From the natural environment to infectious diseases, Nature Rev. Microbiol. 2 (2004), p. 95–108. doi:10.1038/nrmicro821.
- P. Han, L.R. Niestemski, J.E. Barrick, and M.W. Deem, Physical model of the immune response of bacteria against bacteriophage through the adaptive CRISPR-Cas immune system, Phys. Biol. 10 (2013), p. 025004. doi:10.1088/1478-3975/10/2/025004.
- J. He and M.W. Deem, Heterogeneous diversity of spacers within CRISPR (clustered regularly interspaced short palindromic repeats), Phys. Rev. Lett. 105 (2010), p. 128102. doi:10.1103/PhysRevLett.105.128102.
- G.E. Heussler, K.C. Cady, K. Koeppen, S. Bhuju, B.A. Stanton, and G.A. O'Toole, Clustered regularly interspaced short palindromic repeat-dependent, biofilm-specific death of Pseudomonas aeruginosa mediated by increased expression of phage-related genes, mBio 6 (2015), p. e00129-15. doi:10.1128/mBio.00129-15.
- F. Hille and E. Charpentier, CRISPR-Cas: Biology, mechanisms and relevance, Philos. Trans. R Soc. Lond. B. Biol. Sci. 371 (2016), p. 20150496. doi:10.1098/rstb.2015.0496.
- P. Horvath and R. Barrangou, CRISPR/Cas, the immune system of bacteria and archaea, Science 327 (2010), pp. 167–170. doi:10.1126/science.1179555.
- N.M. Hoyland-Kroghsbo, J. Paczkowski, S. Mukherjee, J. Broniewski, E. Westra, J. Bondy-Denomy, and B.L. Bassler, Quorum sensing controls the Pseudomonas aeruginosa CRISPR-Cas adaptive immune system, Proc. Natl. Acad. Sci. USA 114 (2017), pp. 131–135. doi:10.1073/pnas.1617415113.
- A.P. Hynes, M. Villion, and S. Moineau, Adaptation in bacterial CRISPR-Cas immunity can be driven by defective phages, Nat. Commun. 5 (2014), p. 4399. doi:10.1038/ncomms5399.
- W. Jiang, I. Maniv, F. Arain, Y. Wang, B.R. Levin, and L.A. Marraffini, Dealing with the evolutionary downside of CRISPR immunity: Bacteria and beneficial plasmids, PLoS Genet. 9 (2013), p. e1003844. doi.org/10.1371/journal.pgen.1003844.
- D.A. Jones, H.V. Kojouharov, D. Le, and H.L. Smith, The Freter model: A simple model of biofilm formation, J. Math. Biol. 47 (2003), pp. 137–152. doi:10.1007/s00285-003-0202-1.
- E.V. Koonin and Y.I. Wolf, Evolution of the CRISPR-Cas adaptive immunity systems in prokaryotes: Models and observations on virus-host coevolution, Mol. Biosys. 11 (2015), pp. 20–27. doi:10.1039/C4MB00438H.
- E.V. Koonin, K.S. Makarova, and Y.I. Wolf, Evolutionary genomics of defense systems in archaea and bacteria, Ann. Rev. Microbio. 71 (2017), pp. 233–261. doi:10.1146/annurev-micro-090816-093830.
- E. Kutter and H. Brussow, Phage ecology, in Bacteriophages: Biology and Applications, E. Kutter and A. Sulakvelidze, eds., CRC Press, Boca Raton, FL, 2004.
- S.J. Labrie, J.E. Samson, and S. Moineau, Bacteriophage resistance mechanisms, Nat. Rev. Micro. 8 (2010), pp. 317–327. doi:10.1038/nrmicro2315.
- B.R. Levin, Nasty viruses, costly plasmids, population dynamics, and the conditions for establishing and maintaining CRISPR-mediated adaptive immunity in bacteria, PLoS Gen. 6 (2010), p. e1001171. doi:10.1371/journal.pgen.1001171.
- B.R. Levin, S. Moineau, M. Bushman, R. Barrangou, and D. Hughes, The population and evolutionary dynamics of phage and bacteria with CRISPR-mediated immunity, PLoS Gen. 9 (2013), p. e1003312. doi:10.1371/journal.pgen.1003312.
- K. Li, L. Barksdale, and L. Garmise, Phenotypic alterations associated with the bacteriophage carrier state of Shigella dysenteriae, J. Gen. Microbiol. 24 (1961), pp. 355–367. doi:10.1099/00221287-24-3-355.
- D.M. Lin, B. Koskella, and H.C. Lin, Phage therapy: An alternative to antibiotics in the age of multi-drug resistance, World J. Gastrointest. Pharmacol. Ther. 8 (2017), pp. 162–173. doi:10.4292/wjgpt.v8.i3.162.
- A. Mašić and H.J. Eberl, Persistence in a single species CSTR model with suspended flocs and wall attached biofilms, Bull. Math. Biol. 74 (2012), pp. 1001–1026. doi:10.1007/s11538-011-9707-8.
- P. Moons, C.W. Michiels, and A. Aertsen, Bacterial interactions in biofilms, Crit. Rev. Microbiol. 35 (2009), pp. 157–168. doi:10.1080/10408410902809431.
- A.M. Nanda, K. Thormann, and J. Frunzke, Impact of spontaneous prophage induction on the fitness of bacterial populations and host-microbe interactions, J. Bact. 197 (2015), pp. 410–419. doi:10.1128/JB.02230-14.
- D. Paez-Espino, I. Sharon, W. Morovic, B. Stahl, B.C. Thomas, R. Barrangou, and J.F. Banfield, CRISPR immunity drives rapid phage genome evolution in Streptococcus thermophilus, mBio 6 (2015), p. e00262-15. doi:10.1128/mBio.00262-15.
- D. Refardt, Within-host competition determines reproductive success of temperate bacteriophages, The ISME J. 5 (2011), pp. 1451–1460. Available at http://doi.org/10.1038/ismej.2011.30.
- F.J. Sanchez-Rivera and T. Jacks, Applications of the CRISPR/Cas9 system in cancer biology, Nat. Rev. Cancer 15(7), pp. 387–393. doi:10.1038/nrc3950.
- L. Selva, D. Viana, G. Regev-Yochay, K. Trzcinski, J.M. Corpa, I. Lasa, R.P. Novick, and J.R.Penadés, Killing niche competitors by remotecontrol bacteriophage induction, Proc. Natl. Acad. Sci. USA 106 (2009), pp. 1234–1238. doi:10.1073/pnas.0809600106.
- R. Sorek, C.M. Lawrence, and B. Wiedenheft, CRISPR-mediated adaptive immune systems in bacteria and archaea, Ann. Rev. Biochem. 82 (2013), pp. 237–266. doi:10.1146/annurev-biochem-072911-172315.
- P. Tao, X. Wu, and V. Rao, Unexpected evolutionary benefit to phages imparted by bacterial CRISPR-Cas9, Sci. Adv. 4 (2018), p. eaar4134. doi:10.1126/sciadv.aar4134.
- R.B. Vercoe, J.T. Chang, R.L. Dy, C. Taylor, T. Gristwood, J.S. Clulow, C. Richter, R. Przybilski, A.R.Pitman, and P.C. Fineran, Cytotoxic chromosomal targeting by CRISPR/Cas systems can reshape bacterial genomes and expel or remodel pathogenicity islands, PLoS Genet. 9 (2013), p. e1003454. doi:10.1371/journal.pgen.1003454.
- B. Wiedenheft, S.H. Sternberg, and J.A. Doudna, RNA-guided genetic silencing systems in bacteria and archaea, Nature 482 (2012), pp. 331–338. doi:10.1038/nature10886.
- A.D. Weinberger, Y.I. Wolf, A.E. Lobkovsky, M.S. Gilmore, and E.V. Koonin, Viral diversity threshold for adaptive immunity in prokaryotes, mBio 3 (2012), p. e00456-12. doi:10.1128/mBio.00456-12.
- M.E. Zegans, J.C. Wagner, K.C. Cady, D.M. Murphy, J.H. Hammond, and G.A. O'Toole, Interaction between bacteriophage DMS3 and host CRISPR region inhibits group behaviors of Pseudomonas aeruginosa, J. Bact. 191 (2009), pp. 210–219. doi:10.1128/JB.00797-08.
- F. Zhang, Y. Wen, and X. Guo, CRISPR/Cas9 for genome editing: Progress, implications and challenges, Hum. Mol. Genet. 23 (2014), pp. R40–R46. doi:10.1093/hmg/ddu125.
Appendix 1
Probability factors
Four probabilities are mainly used in this manuscript for model development. Most of them are described in the literature. Here we make an analysis of their behaviour to understand their impact on the modelled system (see Figure ). All four therapeutic sequences are studied that are possible in case of three distinct prophages in the lysogen. Constant therapeutic procedure type is studied that has 90 h procedural duration. Total population of CRISPR-immune bacteria C is calculated at the end of procedure for each value of underlying probability as shown in Figure .
Figure A.1. Populations of CRISPR-immune bacteria (C) against probability of lysogeny at the final time t=180 h. Lysogen are introduced with one, two or three prophages at a time. Four possible combinations of prophages are considered for each procedure, namely one prophage followed by two simultaneously, denoted by
(solid line), three prophages each introduced separately, denoted
(dashed line), two prophages simultaneously followed by one separately,
(dotted line), and finally the introduction of a lysogen containing all three prophage sequences,
(dash-dotted line).
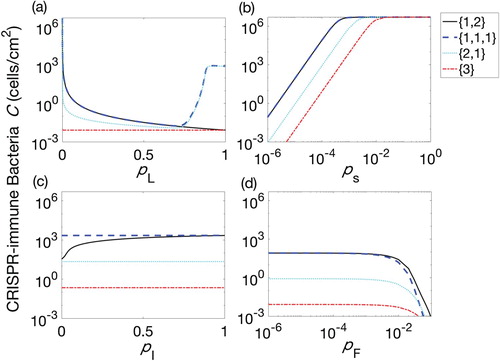
In case of probability of lysogeny, C dramatically decreased from the biofilm when lysogen were introduced into the system, i.e. . However, when lysogen contained all kind of prophages in their genome, see therapeutic sequence
, reduction in CRISPR-immune bacteria did not depend on the probability of lysogeny. The reason is simply because the lysogen already contained all kind of prophages and therefore did not allow any identical phage infections. The latest insertion of lysogen with a single prophage (
and
) showed an increase in the CRISPR-immune bacteria for high values of
. CRISPR bacteria was already immune against existing prophage while lysogen efficiency of inducing a new prophage was reduced due to the establishment of lysogeny from already existing phages. Thus, infections to lysogens from already existing phages reduced the effect of producing effective phage into the biofilm. High values of therapeutic sequence
brought CRISPR-immune bacteria to the same level as simultaneous insertion.
Surprisingly, probability of infection have shown no significant variations in the population of CRISPR-immune bacteria for three of the therapeutic sequences ,
and
while in case of
, CRISPR population increased in the system with the increase in
values.
Two other probabilities of gaining spacer and CRISPR-immunity failure
are also considered in this section. Interestingly, increasing the probability of failure does not show adverse effect on CRISPR bacteria near about the parameter value chosen in this study. On the other hand, probability of gaining spacer is highly sensitive in a sense that it shows a linear increase in the CRISPR population as probability of gaining spacer is increased. This probability is therefore further studied with respect to variation in biofilm formation rate
as shown in Figure .
Appendix 2
Here I describe four different procedural strategies out of which one therapeutic procedure is explained in the manuscript text. The types of procedures are explained by using Table for the therapeutic sequences based on three number of prophages ().
Table A1. Four strategies of therapeutic procedures are defined, namely constant phases, mixed phases, semi-mixed phases and separate phases.
Figure A.2. Colour combinations for the therapeutic procedure. Blue, cyan and black colours are used for the population of the first, second and third phage, respectively. The bacterial populations are based on the combinations of associated phages as follows. and
: Gray;
and
: Blue;
and
: green;
and
: Cyan;
and
: Red;
and
: Pink;
and
: Rose;
and
: Black.
Figure A.3. Populations of bacteria with CRISPR/Cas systems (dash-dot lines), lysogens (solid lines) and phage (dash lines) during the mixed phases therapeutic procedure. The simulation times are h (
and
), 180 h (
and
) and 300 h (
and
). The lysogens are inserted into the biofilm with up to three prophages either simultaneously or successively. The possible sequences of the number of prophages harboured in the lysogens are
and
, as described in the text.
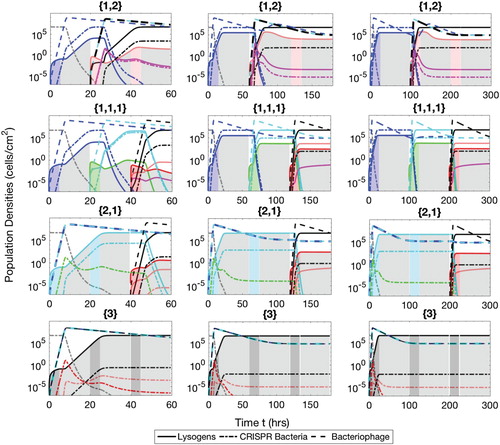
Figure A.4. Populations of bacteria with CRISPR/Cas systems (dash-dot lines), lysogens (solid lines) and phage (dash lines) during the semi-mixed phases therapeutic procedure. The simulation times are t=60 h ( and
), 180 h (
and
) and 300 h (
and
). The lysogens are inserted into the biofilm with up to three prophages either simultaneously or successively. The possible sequences of the number of prophages harboured in the lysogens are
and
, as described in the text.
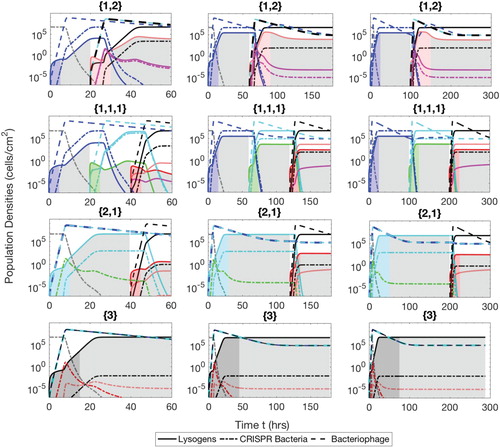
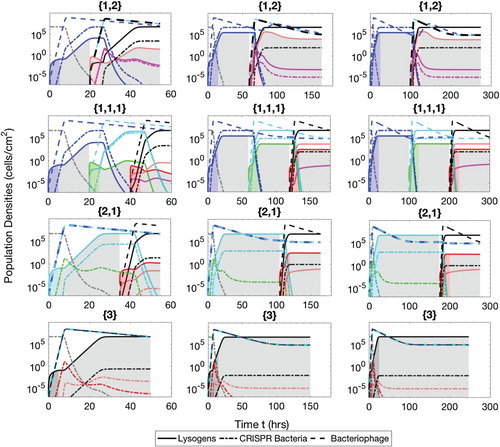
Figure A.5. Populations of bacteria with CRISPR/Cas systems (dash-dot lines), lysogens (solid lines) and phage (dash lines) during the separate phase therapeutic procedure. The simulation times are t=60 h ( and
), 180 h (
and
) and 300 h (
and
). The lysogens are inserted into the biofilm with up to three prophages either simultaneously or successively. The possible sequences of the number of prophages harboured in the lysogens are
and
, as described in the text.
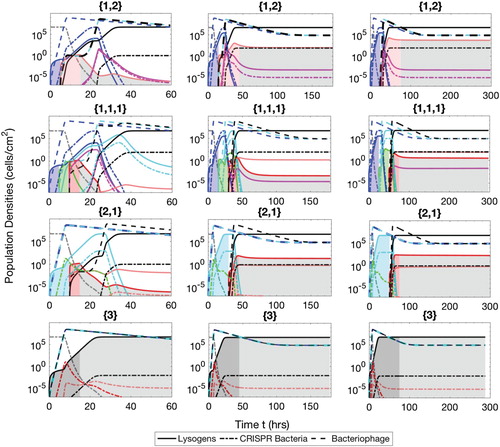
Figure A.6. Populations of bacteria with CRISPR/Cas systems (dash-dot lines), lysogens (solid lines) and phage (dash lines) during the constant phase therapeutic procedure. The simulation times are t=60 h ( and
), 180 h (
and
) and 300 h (
and
). The lysogens are inserted into the biofilm with up to three prophages either simultaneously or successively. The possible sequences of the number of prophages harboured in the lysogens are
and
, as described in the text.
Figures – are made coloured to show the difference among the bacterial classes that are associated to different combinations of bacteriophages. The colour association is shown in Figure .
Mixed phases
In mixed phases strategy, each insertion phase () is followed by competence phase (
) while the time for each phase is fixed. Moreover, the phase to phase cycle will be repeated according to the number of prophages present in the latest inserted lysogen. For instance, if
and
is chosen in the Matlab code then there would be 60 h therapeutic procedure. For the therapeutic sequence like
1,2
, phases are divided in such a way that
would have
and
would have
.
Figure is simulated for three therapeutic procedures (60 h, 180 h and 300 h) with and 25 h and Cp=15,45 and 75 h.
Semi-mixed phases
Semi-mixed phases procedural type is described in detail in the manuscript text. This strategy works similar to ‘mixed phases’ in case of successive insertions when each lysogen has only one prophage. In case of insertion of lysogen with multiple prophages, the phases are separated from each other. For example, therapeutic sequence with
and
,
would be
and
would be
. Population dynamics of two bacteria with CRISPR/Cas system and with lysogen, along three types of bacteriophage population are shown in Figure .
Separate phases
In this therapeutic procedure, lysogens are consecutively inserted without any delay of the competence phase. The time of each therapeutic phase depends upon the number of prophages present in the lysogen. If we consider the therapeutic sequence and the same values for
and
as in previous cases then
would be
and
would be
. Similarly other sequences can be traced out from Table .
Constant phases
In this therapeutic procedure, the time for the insertion phase is independent of the number of prophages and, therefore, constant. However, the time for the competence phase depends upon the number of prophages harboured in a given lysogen. Following the previous example of therapeutic phase ,
would be
and
would be
. Figure presents the population dynamics of bacterial and viral populations present in the biofilm.