
 ?Mathematical formulae have been encoded as MathML and are displayed in this HTML version using MathJax in order to improve their display. Uncheck the box to turn MathJax off. This feature requires Javascript. Click on a formula to zoom.
Abstract
The outbreak of COVID-19 was first experienced in Wuhan City, China, during December 2019 before it rapidly spread over globally. This paper has proposed a mathematical model for studying its transmission dynamics in the presence of face mask wearing and hospitalization services of human population in Tanzania. Disease-free and endemic equilibria were determined and subsequently their local and global stabilities were carried out. The trace-determinant approach was used in the local stability of disease-free equilibrium point while Lyapunov function technique was used to determine the global stability of both disease-free and endemic equilibrium points. Basic reproduction number, , was determined in which its numerical results revealed that, in the presence of face masks wearing and medication services or hospitalization as preventive measure for its transmission,
while in their absence
. This supports its analytical solution that the disease-free equilibrium point
is asymptotically stable whenever
, while endemic equilibrium point
is globally asymptotically stable for
. Therefore, this paper proves the necessity of face masks wearing and hospitalization services to COVID-19 patients to contain the disease spread to the population.
1. Introduction
Historically, human life has ever experienced three coronavirus diseases such as (HCoV-229E), (HCoV-OC43) and severe acute respiratory syndrome (SARS-CoV) in the year 2003 [Citation19]. COVID-19 is an acronym for Corona Virus Disease 2019 which erupted first time during December 2019 in Wuhan city at Hubei Province, China, whereby the first case of infection was identified [Citation26,Citation27,Citation44]. According to European Centre for Disease Prevention and Control (ECDC) [Citation17] and Jewell [Citation21], the outbreak of COVID-19 is more severe to human health and is highly spreading over many territories around the world regardless of nation status, unlike SARS-CoV and Middle East Respiratory Syndrome, MERS-CoV [Citation27]. COVID-19 is among the pandemic diseases in the twenty-first century which is also similar to SARS-CoV [Citation7] and MERS-CoV [Citation27].
According to Centers for Diseases Control (CDC) [Citation5], Shaikh et al. [Citation45] and Sanglier et al. [Citation44], major symptoms of COVID-19 are fever, cough and breath shortness which emerge 14 days after the infection occurred. Public Health [Citation39] and World Health Organization (WHO) [Citation49] claimed that major ways of transmission of COVID-19 are through respiratory droplets released through sneezing or coughing from potentially infected persons who are closely enough or in contact. In the presence of high temperature and relative humidity, COVID-19 transmission rate is likely lowered [Citation48]. Until 24th February 2020, COVID-19 proved to cause more than 2600 human deaths along with more than 77,000 infection cases in China alone [Citation27]. Due to its explosive and rapidly spreading nature, on 11th March 2020, WHO declared COVID-19 as a global pandemic disease [Citation20]. As of 20th April 2020, COVID-19 has caused more than 152,707 human deaths with confirmed infection cases of 2,246,291 globally in which the USA is a leading one with more than 771,000 confirmed cases and 41,000 deaths [Citation49]. Recently, COVID-19 confirmed death cases globally are updated by WHO and Johns Hopkins University, and yet, there is no cure found for the virus; however, only preventive and supportive measures have been applied to patients [Citation44]. Recommended preventive measures include isolation of suspected person, early diagnosis, washing hands with clean dropping water with soap, external use of sanitizer and medical supports [Citation49]. In Africa, COVID-19 was first discovered in Algeria on 25th February 2020 which was imported by an Italian who tested positive while in East Africa, Kenya was the first country to identify the infection on 13th March 2020 which was imported by Kenyan who arrived from the USA [Citation49]. According to WHO [Citation49] and Africa news on 20th April 2020, the confirmed cases in Africa hit more than 22,000 while deaths exceeded 1100.
2. Emergence of COVID-19 in Tanzania, its local transmission trend and control measures taken
Tanzania announced the first case of COVID-19 through the Ministry of Health, Community Development, Gender, Elderly and Children under its Minister Ummy Mwalimu on 16th March 2020, which was imported by a woman through Kilimanjaro International Airport (KIA) in Arusha from Belgium [Citation10]. Following the first case announcement, immediately on 17th March, the Prime Minister Kassim Majaliwa announced first control measures for COVID-19 local transmission: closure of all school levels and ban of all public or social gatherings while on the subsequent date the order was extended to colleges and higher education institutions for indefinite close [Citation8]. On 23rd March, the Government declared that all incoming travellers from COVID-19 affected countries to be quarantined for 2 weeks at their own costs [Citation2]. Self-isolation at home or hospitals and wearing face masks in crowded areas were compulsory to any who suspects any COVID-19 symptoms in order to avoid more spread of the virus [Citation31]. As the number of day counts, the first patient of COVID-19 got recovered on 26th March 2020 [Citation29]. The infection transmission trend was announced parallelly in both Tanzania main land and Zanzibar by the respective Ministers. On 31st March, the first COVID-19 death was recorded in Dar es Salaam [Citation11].
During the first week of April, more new cases and second recovery in Dar es Salaam were added, making the cumulative total of 20 cases, 3 recoveries and 1 death [Citation32]. Until 10th April, the reported cumulative cases both in Tanzania mainland and Zanzibar reached 32 [Citation35], and it was at this point of daily increase of infection, the President Magufuli asked spirituals to go to pray in their respective churches and mosques to seek help and protection from God against the disease [Citation4]. As the infection rate was exponentially growing up, on 12th April, the government through Tanzania Civil Aviation Authority (TCAA) decided to suspend all international passenger planes to land Tanzania as an added measure to combat COVID-19 importation while allowing only Cargo planes [Citation28]. On 17th April, 38 new infection cases in Dar es Salaam and 10 in Zanzibar were recorded while also starts spreading to other regions making the total of 147 cases with 5 deaths [Citation36]. Until 19th April, cumulative total of recoded cases was 188, with 7 deaths and 11 recoveries. As this peak of infection reached, the Tanzania Revenue Authority (TRA) issued an order of wearing face mask to all of its officials and clients from 20th day of April 2020, and in all official work stations like hospitals, government and non-government offices and crowded areas like markets countrywide [Citation9,Citation31].
Furthermore, on 20th April, more 3 COVID-19 deaths with an explosion of 87 new cases were recorded which spread over various regions: 33 found in Dar es Salaam, 4 in Arusha, 3 in Mbeya, 3 in Kilimanjaro, 3 in Pwani, 3 in Tanga, 2 in Manyara, 1 in Tabora, 3 in Dodoma, 2 in Ruvuma, 2 in Morogoro, 1 in Lindi, 1 in Mara, 3 in Mwanza, 1 in Mtwara, 1 in Kagera and 2 in Rukwa [Citation1,Citation30]. Subsequently, due to the overspreading of coronavirus over the country, the government prepared more than 70 COVID-19 stations to deal with the disease, which were located countrywide: 7 were located in Dar es Salam city, 3 in Arusha, 4 in Dodoma, 10 in Mwanza and more centres in other regions. Until 29th April, 196 more people were infected, bringing a total of 480, of which 167 were recovered and 16 died [Citation50]. Tanzania stopped reporting any new cases on 4th May 2020 following false test results issued by National Health Laboratory after biological samples submitted from a papaya, a car oil and a goat been tested positive during its laboratory equipment standard check-up [Citation15]. Officially, the confirmed cases counted a cumulative total of 509, with recovered patients 183 and 21 deaths [Citation51].
As the government stopped taking COVID-19 tests, it was accused by opposition activists on hiding real scale of pandemic, claiming that, if continue testing the projection would be more than 400 people died in Dar es Salaam alone while 16, 000–20,000 have been infected across the country until the end of May 2020 [Citation18]. More voices were raised following the deaths of three Members of Parliament, the situation alarmed the incidence rate [Citation42]. Due to this trend, it was suggested that between 20th April and 26th May 2020, about 10,000 infectious were recorded [Citation37]. Furthermore, epidemiologists projected that, if no effective measures were taken within 3 months, the infection number would run from more than 5000 to about 19 million active cases, with more than 16,000 COVID-19 new deaths in Tanzania [Citation38]. Until the time this report is compiled, no COVID-19 testing taking place any more in Tanzania except all other precautions measures like keep distancing, washing hand with soap or use hand sanitizer and wearing face masks in crowded areas [Citation31]. Although there is no biological evidence for disappearing of the disease, the President on 21st May 2020 declared that all colleges and high school students to reopen with effect from 1st June 2020, the same on sports and international flights without quarantine [Citation12].
So far, several mathematical models have been developed targeting on minimizing the transmission of COVID-19 [Citation21], such as isolation of victims, washing hands with clean dropping water with soap, hand sanitizer, keeping social distancing, closing down all official gatherings like schools, colleges, universities, sports club matches, and banning up all unnecessary gatherings in many territories, still the virus is threatening to human survival. Some of these models include the following;
In the study done by Ivorra et al. [Citation20], Susceptible-Exposed-Infected-Hospitalized-Recovered-Died (SEIHRD) model for COVID-91 transmission in China was developed, in which the results showed that the basic reproduction number , but the effective reproductive number
was successfully decreased below 1 after 1st February, 2020 as a result of some control measures. Again, Li et al. [Citation25] studied the model Susceptible-Exposed-Infected-Quarantined-Diagnosed-Recovered (SEIQDR) based on China context for COVID-19 transmission using time series approximation, in which the results showed that the epidemic was still increasing in the country during February 2020 as the approximated basic reproduction was
country-wise; however, the trend was expected to reach its peak in about 73 days due to the control measures taken. Okhuese [Citation34] developed the model with Susceptible-Exposed-Infected-Recovered-Undetectable (SEIRU) compartments to study COVID-19 general transmission rate as a global pandemic, and the study showed the hope of declining of
if control measures recommended by WHO were observed.
Furthermore, Shaikh et al. [Citation45] and Chen et al. [Citation6], developed a model with Susceptible-Exposed-Infected-Asymptotic Infected-Recovered (SEIAR) compartments showing the COVID-19 transmission rate in India and Korea nations, respectively, in which the Laplace Transforms and Iterative methods were applied to the former, while the next generation method was used to the later to find out the solutions. The results showed that the basic reproduction number ; however, after control measures like total lockdown were applied for about 50 days, the infection transmission rate was potentially decreased. A similar model was studied by Khan and Atangana [Citation23] with novel corona virus (2019-nCoV) transmission interactions between human and bats in China, in which the resulted approximated basic reproduction number
. In the study by Sameni [Citation43], a similar model with Susceptible-Exposed-Infected-Recovered-Passed (SEIRP) was constructed in which a fixed point analysis approach was used to find the stability of the system.
Li et al. [Citation26] and Kucharski et al. [Citation24], studied Susceptible-Exposed-Infected-Recovered (SEIR) model for COVID-19 transmission in Wuhan, China. The obtained basic reproduction number was 3.39 indicating the high transmission of the virus before the control measures taken in the former, while in the later declined from 2.35 to 1.05. A similar model was proposed by Prem et al. [Citation40] using the same compartmental model in the same context area, and the results showed that the rapidity transmission of COVID-19 has been reduced due to the complete lockdown of the city for about two months until late of April 2020.
Unlike the developed models discussed above, and taking into account the context of Tanzania, this study, therefore, intends to formulate and analyse the mathematical model for COVID-19 transmission between humans with the Susceptible-Masked-Unmasked-Exposed-Infected-Hospitalized-Recovered (SMUEIHR) compartments for analysing the significance of wearing masks and hospitalizing the detected infectious as preventive and supportive measures in reducing transmission rate to the susceptible group.
3. Materials and methods
In this part, a Susceptible-Masked-Unmasked-Exposed-Infected-Hospitalized-Recovered (SMUEIHR) model class is formulated involving human population. Susceptible humans are those who are healthy but are likely to be infected when interacting with the infectious,
and
are Masked and Unmasked humans respectively. Exposed
are the ones who might have been infected but not yet developed any disease symptoms, but the Infected
are those who developed clinical disease symptoms while the hospitalized
are the infectious who were isolated for getting treatment and supportive services, and the Recovered group
are the ones who get recovered after gaining immune supportive services or treatment either through hospitality or naturally. In this paper, masks wearing to susceptible is introduced to give more protection against suspected infected once they interact while the quarantined for detected infectious are important to reduce interactions with health one in the rest population groups. In formulating the model, we considered the context of Tanzania trend of infection under official data supplied by the Ministry of Health and also we assumed that, there is no movement control between people except for those hospitalized only and the transmission occurring from infectious who are not isolated
to the mask wearing
and mask unwearing
preventive measures. Also the following parameters were considered;
The recruitment rate of human population occurring in susceptible group
at the rate of π.
The infection rate of COVID-19 in human population occurs at the rate of β, and its proportion rate of occurrence between mask wearing
A proportion rate of masks preventive wearing and non-wearing supplied to the susceptible population
Infected class
After the treatment or supportive services provision in hospitalized class
Human population reduces due to COVID-19 in the rate α while natural death occurs in the rate, μ.
The recovered population
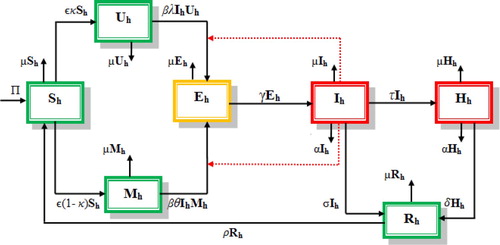
From the composition of variables and parameters described above, the model flow chart for COVID-19 transmission dynamics in Tanzania was developed as follows.
From the model flow chart (Figure ), a set of non-linear ordinary differential equations, showing novel corona virus disease dynamics in human population compartments, were constructed as follows:
Figure 1. The model flow chart.
3.1. Basic properties of the model
3.1.1. Invariant region
According to Ega et al. [Citation14] and Asamoah et al. [Citation3], population in biological sense is meaningful if its global solution is found within an invariant region Φ.
Theorem 3.1
The solution set of the model equation systems (Equation1
(1)
(1) ) is confined to the positive feasible region Φ.
Proof.
Suppose that feasible region be ∈
for
. At any time (t), Equation (Equation1
(1)
(1) ) gives total human population
as
(2)
(2) If we differentiate Equation (Equation2
(2)
(2) ) with respect to time t it gives
(3)
(3) Then, by substituting Equation (Equation1
(1)
(1) ) in (Equation3
(3)
(3) ) gives
(4)
(4) Simplifying Equation (Equation4
(4)
(4) ) and assuming that there is no disease-induced death in the presence of supportive and care services for the infected and hospitalized classes
and
, respectively, then Equation (Equation4
(4)
(4) ) gives
(5)
(5) Applying Equations (Equation2
(2)
(2) ) and (Equation5
(5)
(5) ), we obtain
(6)
(6)
(7)
(7) Solving Equation (Equation7
(7)
(7) ) and applying initial conditions, it concludes that all solutions in (Equation1
(1)
(1) ) contained in the region
for
3.1.2. Positivity of the model solutions
Biologically, population is well defined and is meaningful if its model solutions are positive for [Citation47].
Theorem 3.2
If the initial data then the solutions for
of the system (Equation1
(1)
(1) ) are non-negative for
Proof.
To prove the existence positivity of the model in (Equation1(1)
(1) ), all classes must be non-negative, and thus by considering susceptible class we have
(8)
(8) On the basis of Theorem 3.2, Equation (Equation8
(8)
(8) ) can be expressed in inequality form as
(9)
(9) Through the separation of variables, integrating and using initial conditions in Equation (Equation9
(9)
(9) ), we obtain the following:
(10)
(10) Thus from Equation (Equation10
(10)
(10) ), as t
, gives
.
Doing in a similar way, the rest classes can be proved to verify positivity solution. Therefore, this concludes that, all systems of equations in (Equation1(1)
(1) ) have non-negative solutions such that for
, we have
.
4. Equilibrium points of the model
4.1. Disease-free equilibrium point
Let be disease-free equilibrium point, then from the system of the equations in (Equation1
(1)
(1) ) we solve for variables by setting the right-hand side equals zeros which results
as
(11)
(11)
4.2. Basic reproduction number,
In mathematical epidemiology, basic reproduction number, means an average secondary infected individuals produced from a single primary infected one during its life time when it was firstly placed in the host population in the absence of intervention [Citation14,Citation47].
For this reason, basic reproduction number, is a very important quantity in analysing epidemiological models for the disease control which provides the interpretations below.
When , then the average number of secondary infections generated by a single primarily infected individual is less than the unity value, and hence, the disease dies out from the population [Citation13]. Similarly,
shows the threshold value [Citation16], whereby the average number of secondary infected individual generated by the primarily infected one is constantly in proportion; therefore, the disease dies as well. On the other hand, if
, then the number of secondary infected individual produced by a single primarily infected one is greater than the unity (threshold) value ; therefore, in this sense, the disease will become pandemic in the entire population [Citation46].
Basic reproduction number was determined through the Next Generation method [Citation6,Citation20,Citation23,Citation34,Citation45], in which from (Equation1
(1)
(1) ) we derived
(12)
(12)
4.2.1. Local stability of disease- free equilibrium point
To obtain local stability for the disease-free equilibrium point , the system of equations in (Equation1
(1)
(1) ) is linearized to get Jacobian Matrix J(
as
(13)
(13) Then from the Jacobian matrix in Equation (Equation13
(13)
(13) ), the trace-determinant method is applied to get the local stability of
[Citation14,Citation34], where it concludes that
(14)
(14)
(15)
(15) Again, in Equation (Equation13
(13)
(13) ) the determinant Det
can be derived as
(16)
(16) Through further simplification of Equation (Equation16
(16)
(16) ) and the use of Equations (Equation11
(11)
(11) ) and (Equation12
(12)
(12) ) we obtain the following:
(17)
(17) For the Determinant Det
, then from Equation (Equation17
(17)
(17) ) it follows that
(18)
(18) By referring Equation (Equation18
(18)
(18) ), Det J
for
. Thus biologically, COVID-19 disease will be exiting from human population.
This reaches to Theorem 3.
Theorem 4.1
If then the disease free equilibrium point
is locally asymptotically stable, while unstable for
in the region Φ.
4.2.2. Global stability analysis of disease- free equilibrium point
Global stability of disease-free equilibrium point, was determined by using the Lyapunov function approach [Citation3,Citation22,Citation41]. This needs to prove Theorem 4.2.
Theorem 4.2
If then the disease free equilibrium point
is globally asymptotically stable, while for
will be unstable in the region Φ.
Proof.
The Lyapunov function L is chosen with non-negative coefficients and
in the trivial equilibrium points
such that
(19)
(19) By differentiating Equation (Equation19
(19)
(19) ) with respect to time t it gives the following:
(20)
(20) From Equation (Equation1
(1)
(1) ), we substitute for
and
in Equation (Equation20
(20)
(20) ) which results in the following:
(21)
(21) Suppose
and
then by plugging in Equation (Equation21
(21)
(21) ) and simplify, we end up with the following:
(22)
(22) Simplifying Equation (Equation22
(22)
(22) ) and collecting similar terms of
and
, and at
point we have,
, then by solving for coefficients
and
and applying Equations (Equation11
(11)
(11) ) and (Equation12
(12)
(12) ), it yields
(23)
(23) Therefore, from Equation (Equation23
(23)
(23) ) we have the largest invariant non-negative compact set in
such that
is the singleton set of
of the system (Equation1
(1)
(1) ) for
. Thus, referring to Lasalle's invariant principle [Citation33], the disease-free equilibrium point,
of the system in (Equation1
(1)
(1) ) is globally asymptotically stable in the region Φ for
and unstable for
. Hence this derives Theorem 4.2.
4.3. Endemic equilibrium points
Let be an endemic equilibrium point, which exists for
as the disease is dominating in the entire particular population. Then by solving for
from the system of equations in (Equation1
(1)
(1) ) we obtain
(24)
(24) where
4.3.1. Global stability analysis of endemic equilibrium point
The Lyapunov function technique was used to determine the global stability of endemic equilibrium point [Citation41]. In doing so, we derive the Lyapunov function V as follows:
Proof.
Assume that , for which
exists, then to determine the global stability, we define and derive the Lyapunov function V as follows:
(25)
(25) where
= human population classes
and
= human population endemic equilibrium point,
.
From the system in Equation (Equation1(1)
(1) ), then (Equation25
(25)
(25) ) becomes
(26)
(26)
Differentiating Equation (Equation26(26)
(26) ) with respect to time t corresponding to Equation (Equation1
(1)
(1) ) we obtain
(27)
(27) But from Equation (Equation3
(3)
(3) ) given that
(28)
(28) Thus, by using Equation (Equation6
(6)
(6) ), then (Equation28
(28)
(28) ) gives
(29)
(29) But from Equation (Equation5
(5)
(5) ) we have
(30)
(30) By substituting equations (Equation29
(29)
(29) ) and (Equation30
(30)
(30) ) in equation (Equation27
(27)
(27) ) it becomes
(31)
(31) Through simplifying and re-arranging equation (Equation31
(31)
(31) ), we obtain
(32)
(32) Therefore, from Equation (Equation32
(32)
(32) ), it is obvious that
is a strictly Lyapunov function which indicates that the endemic equilibrium point
is globally asymptotically stable which is contained in the region Φ.
Biologically this implies that COVID-19 will be stable to remain in human population for a long duration.
Again, in Equation (Equation32(32)
(32) ),
iff we set
and
, and therefore,
converges in positive region Φ as t
. Thus this reaches to the proof of Theorem 4.3
Theorem 4.3
If then the endemic equilibrium point is globally asymptotically stable contained in region Φ.
5. Results and discussion
5.1. Numerical simulation
Numerical results are carried out using parameter values imported from several literatures as indicated in Table to show the reality of analytical solutions which were given in the rate of number of days. Parameter values, which are not found in the literatures, were assumed under the given reasonable proportions while others are calculated based on infected individuals in Tanzania. Some of initial sample of human population were taken from the reports presented through the Ministry of Health as Infected , Hospitalized
and Recovered
. For other classes we approximated reasonable population range according to the existing distribution across all Tanzania regions as Total population
or Susceptible
, Masked
, Unmasked
and Exposed
. The life expectancy for Tanzania approximated as
per year and for this sense
[Citation6]
Table 1. Parameter values of the model.
5.2. Discussion
The importance of wearing masks for susceptible people for the disease prevention when they become exposed to the crowded population, and hospitalization processes for the identified corona virus disease patients who are isolated and given supportive and medication services plays a crucial role in disease control (Figure ).
Figure 2. Proportion rates of wearing masks (left panel) and non-wearing (right panel) from the susceptible group.
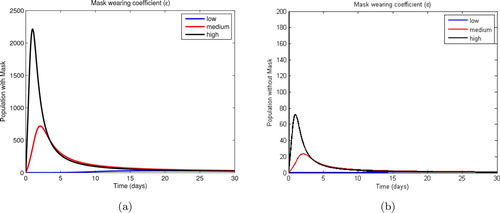
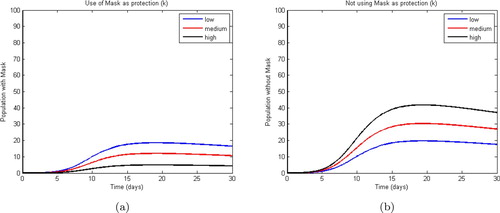
Referring to the trend shown in Figure , it is clear that the infection transmission rate for people who do not wear masks as protection measures against the disease is higher which hits about 40 individuals while for those wearing reached a maximum of 20 people only within 30 days.
Figure 3. Proportions of population wearing masks (left panel) and non-wearing (right panel) from the susceptible group.
In Figure , as more immunity gained through hospitalized patients through medication and supportive services succeeded to reduce the number of admitted patients from 297 to about 20, while the recovered will be pushed up to more than 500 within 30 days. On the other hand, Figure shows that the infected COVID-19 patients will be reduced from 509 to below 10 through natural immunity gain, and thus this contributes to the increment of the recovered from 183 to about 495 patients within 30 days.
Figure 4. Hospitalized population (left panel) and recovered (right panel) after gaining immunity through hospitalization.
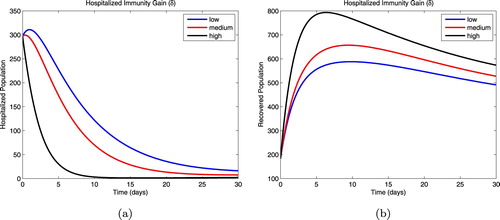
Figure 5. Infected population (left panel) and recovered (right panel) after gaining immunity naturally.
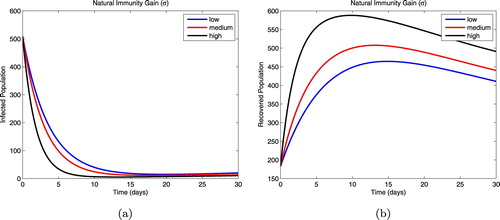
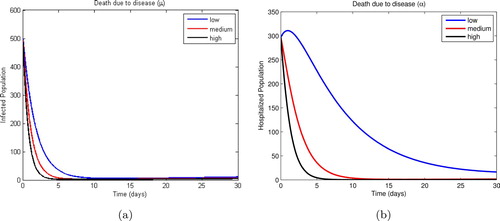
Figure shows that as more infected patients were identified and admitted to hospitals for medication and supportive services, the number of non-hospitalized infectious is reduced from 509 to about less than 10 patients in 30 days. On the other hand, Figure indicates that, within 30 days more number of deaths due to COVID-19 for non-hospitalized patients will be sharply reduced to about less than 10 deaths, while for admitted patients the disease-induced death rate seems to count about 20 deaths in the same duration.
Figure 6. Proportions of non-hospitalized infectious population (left panel) and hospitalized (right panel) after disease symptoms development.
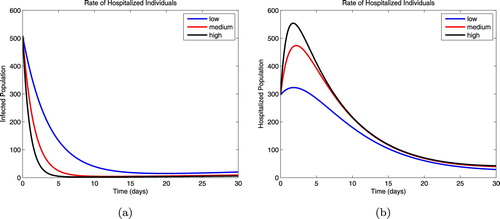
Figure 7. Disease induced death rate proportions between non-hospitalized infected patients (left panel) and hospitalized (right panel).
From numerical results, basic reproduction number, obtained is 3.8 which indicates that
in the absence of wearing masks and hospitalization of people. This supports the analytical solutions for the disease-free equilibrium point that
is unstable for
while for the endemic equilibrium point
is asymptotically stable. These results also concurred with the findings in the work done by Ivorra et al. [Citation20], Shaikh et al. [Citation45], Li et al. [Citation25], Khan and Atangana [Citation23], Li et al. [Citation26], Kucharski et al. [Citation24]. Biologically, this brings the sense that, the COVID-19 produced were above the threshold value since
.
Conversely, in the presence of wearing masks and medical services, numerical results showed that basic reproduction number implies that
in the disease-free equilibrium point
which is asymptotically stable. These findings signify the potentiality of wearing masks and hospitalization of the identified COVID-19 patients in reducing the disease transmission among people as
is below the threshold value.
6. Conclusion
Conclusively, as per the results and discussion above, the study proved the necessity of people wearing face masks and take medication services once identified any COVID-19 clinical symptoms to cut off the chain of the virus local transmission among human population in Tanzania.
7. Recommendation
The researchers, therefore, recommend and emphasize on people wearing face masks as frequently as possible especially in crowded areas and also on immediate isolation and seeking medication services if COVID-19 symptoms arise to contain the disease.
Data availability
Data that support these research findings are openly available, and accessed on 10th July 2020 through address; https://www.worldometers.info.coronavirus.tanzania or www.moh.go.tz/en/covid-19-info
Disclosure statement
No potential conflict of interest was reported by the author(s).
References
- AFP. Coronavirus arrives in Tanzania, as regional cases rise, The New Straits Times (17 March 2020). Available at https://www.nst.com.my/world/world/2020/03/575242/coronavirus-arrives-tanzania-regional-cases-rise.
- APO Group, Coronavirus – Tanzania: Travel Advisory No. 1 of 23.03.2020 – Update on COVID-19 in Tanzania, 2020. Available at https://www.africanews.com/2020/03/24/coronavirus-tanzania-travel-advisory-no1-of-23032020-update-on-covid-19-in-tanzania.
- J.K.K. Asamoah, F.T. Oduro, and B. Seidu, Data from: Modelling of Rabies Transmission Dynamics Using Optimal Control Analysis, Hindawi, 2017. Dataset available at https://doi.org/10.1155/2017/2451237.
- N. Bariyo and J. Parkinson, Tanzania's Leader Urges People to Worship in Throngs Against Coronavirus, The Wall Street Journal, (8 April 2020). Available at https://www.wsj.com/articles/tanzanias-leader-urges-people-to-worship-in-throngs-against-coronavirus-11586347200.
- Centers for Diseases Control (CDC), Symptoms of Coronavirus disease 2019, 2020.s
- T. Chen, J. Rui, and L. Yin, A mathematical model for simulating the phase-based transmissibility of a novel coronavirus, Infect. Dis. Poverty 9 (2020), pp. 24. Available at https://doi.org/10.1186/s40249-020-00640-3.
- V.C.C. Cheng, S.K.P. Lau, and K.Y. Yuen, Severe acute respiratory syndrome coronavirus as an agent of emerging and reemerging infection, Clin. Microbiol. Rev. 20(4) (2007), pp. 660–694. Available at doi:10.1128/CMR.00023-07.
- The Citizen Reporter, Tanzania bans all public gathering, closes schools, suspends the Premier League over Coronavirus, The Citizen, (17 March 2020). Available at https://www.thecitizen.co.tz/news/1840340-5494476-agwmfd/index.html.
- The Citizen Reporter, Covid-19: Two dead as Zanzibar records 23 more cases, The Citizen (19 April 2020). Available at https://www.thecitizen.co.tz/news/Covid-19–Two-dead-as-Zanzibar-records-23-more-cases-/1840340-5528546-wwp6tl/index.html.
- The Citizen Reporter @TheCitizenTZ, Health ministry calls for calm as Tanzania confirms first coronavirus case, The Citizen, (16 March 2020). Available at https://www.thecitizen.co.tz/news/1840340-5493064-agvtxf/index.html
- The Citizen Reporter @TheCitizenTZ, Tanzania records first Covid-19 death, The Citizen (31 March 2020). Available at https://www.thecitizen.co.tz/news/Tanzania-records-first-Covid-19-death/1840340-5509582-e6v2lk/index.html.
- The Citizen Reporter @TheCitizenTZ, Tanzania reopens colleges, sports activities as Covid-19 numbers drop, government says, The Citizen (21 May 2020). Available at https://www.thecitizen.co.tz/news/Tanzania-reopens-colleges-sports-activities-as-Covid-19-/1840340-5559368-13rqy6kz/index.html.
- P.V. Driessche and J. Watmough, Reproduction numbers and sub-threshold endemic equilibria for compartmental models of disease transmission, Math. Biosci. 180 (2002), pp. 29–48. doi: 10.1016/S0025-5564(02)00108-6
- T.T. Ega, L.S. Luboobi, and D. Kuznetsov, Modeling the dynamics of rabies transmission with vaccination and stability analysis, Appl. Comput. Math. 4(6) (2015), pp. 409–419. Available at doi:10.11648/j.acm.20150406.13.
- J.K. Elliott, Tanzanian president blames lab after goat, papaya ‘test positive’ for coronavirus, Global News (6 May 2020). Available at https://globalnews.ca/news/6910821/coronavirus-papaya-goat-tanzania/.
- L. Esteva-Peralta and J.X. Velasco-Hernandez, M-Matrices and local stability in epidemic models, Math. Comput. Modell. 36 (2001), pp. 491–501. doi: 10.1016/S0895-7177(02)00178-4
- European Center for Disease Prevention and Control (ECDC), Rapid Risk Assessment; Outbreak of acute respiratory syndrome associated with a novel coronavirus, China, First Local Transmission in the EU/EEA – Third Update, 2020.
- P. Fabricius, CORONAVIRUS: Is the Tanzanian government hiding true coronavirus stats? Daily Maverick (27 May 2020). Available at https://www.dailymaverick.co.za/article/2020-05-28-is-the-tanzanian-government-hiding-true-coronavirus-stats/#gsc.tab=0.
- L.V. Hoek, K. Pyrc, and K.C. Wolthers, Identification of a new human coronavirus, Nat. Med. 10(4) (2004). Available at doi:10.1038.nm1024.
- B. Ivorra, M.R. Ferrández, and A.M. Ramos, Mathematical modeling of the spread of the coronavirus disease 2019 (COVID-19) taking into account the undetected infections, The case of China, ResearchGate, 2020. Available at http://www.doi.org/10.13140/RG.2.2.21543.29604.
- N.P. Jewell, J.A. Lewnard, B. Jewell, Predictive Mathematical Models of the COVID-19 Pandemic Underlying Principles and Value of Projections, American Medical Association, London, 2020.
- J.C. Kamgang and G. Sallet, Computation of threshold conditions for epidemiological models and global stability of the disease-free equilibrium (DFE), Math. Biosci. 213 (2008), pp. 1–12. Available at doi:10.1016/j.mbs.2008.02.005. doi: 10.1016/j.mbs.2008.02.005
- M.A. Khan, A. Atangana, Modeling the dynamics of novel coronavirus (2019-nCov) with fractional derivative. Alexandria Eng. J. 59(4) (2020), pp. 2379–2389. Available at https://doi.org/10.1016/j.aej.2020.02.033.
- A.J. Kucharski, T.W. Russell, and S. Funk, Early dynamics of transmission and control of COVID-19, A mathematical modelling study, Lancet Infectious Disease, 2020. Available at https://doi.org/10.1016/S1473-3099(20)30144-4
- Y. Li, B. Wang, and Z. Liu, Mathematical modeling and epidemic prediction of COVID-19 and its significance to epidemic prevention and control measures, Ann. Infect. Dis. Epidemiol. 5(1) (2020), pp. 1052.
- J. Li, Y. Wang, and Y. Wang, Estimation of the epidemic properties of the 2019 novel coronavirus, A mathematical modeling study, The Lancet, 2020
- Q. Lin, S. Zhao, and S.S. Musa, A conceptual model for the coronavirus disease 2019 (COVID-19) outbreak in Wuhan, China with individual reaction and governmental action, Int. J. Infect. Dis. 93 (2020), pp. 211–216. doi: 10.1016/j.ijid.2020.02.058
- A. Malanga, Tanzania finally suspends all international flights over coronavirus, The Citizen (14 April 2020). Available at https://www.thecitizen.co.tz/news/business/Flights-suspended-over-virus/1840434-5523538-1871baz/index.html
- B. Materu, Tanzania first Covid-19 patient recovers, The East African (26 March 2020). Available at https://www.theeastafrican.co.ke/tea/science-health/tanzania-first-covid-19-patient-recovers-as-another-case-recorded-1439236
- B. Materu, Covid-19: Tanzania's cases soar to 254, The East African (21 April 2020). Available at https://www.theeastafrican.co.ke/tea/news/east-africa/covid-19-tanzania-s-cases-soar-to-254-1440270
- The Ministry of Health, Community Development, Gender, Elderly and Children, Standard Operating Procedures (SOPs) for Case Management and Infection, Prevention and Control, Case Management and Infection Prevention and Control Subcommittee, 2020
- R. Mirembe, Second Tanzanian patient recovers from coronavirus, The East African (1 April 2020). Available at https://www.theeastafrican.co.ke/tea/news/east-africa/second-tanzanian-patient-recovers-from-coronavirus-1439502
- R.M. Murray, Z. Li, S.S. Stastry, A Mathematical Introduction to Robotic Manipulation, CRC Press, London, 1994.
- V.A. Okhuese, Mathematical Predictions for COVID-19 as a Global Pandemic, Nasarawa State University, Keffi – Nigeria, medRxiv, preprint (2020). Available at https://doi.org/10.1101/2020.03.19.20038794
- P. Owere, Tanzania records two more deaths as Covid-19 cases rise to 32, The Citizen, (10 April 2020). Available at https://www.thecitizen.co.tz/news/-Tanzania-records-two-more-deaths-as-Covid-19-cases-rise-to-32/1840340-5520214-4vrxe7/index.html
- P. Owere, Covid-19: Tanzania's cases jump to 147 after 53 test positive, The Citizen, (17 April 2020). Available at https://www.thecitizen.co.tz/news/Covid-19–Tanzania-cases-jump-to-147-after-53-test-positive/1840340-5527284-anwicrz/index.html
- C.A.B. Pearson, C.V. Schalkwyk, and A.M. Foss, Projected early spread of COVID-19 in Africa through 1 June 2020, Euro Surveill, European Centre Dis. Prev. Control 25(18) (2020). Available at doi:10.2807/1560-7917.ES.2020.25.18.2000543.
- C.A.B. Pearson, K.V. Zandvoort, and I.J. Chris, Modelling Projections for COVID-19 Epidemic in United Republic of Tanzania, MRC Centre for Global Infectious Disease Analysis, Imperial College London, UK, 2020.
- Public Health; Seattle and King County, Novel Coronavirus, 2020.
- K. Prem, Y. Liu, and N. Davies, The effect of control strategies to reduce social mixing on outcomes of the COVID-19 epidemic in Wuhan, China; A modelling study, Lancet Public Health, 2020. Available at https://doi.org/10.1016/S2468-2667(20)30073-6
- M.A. Safi, Global stability analysis of two-Stage quarantine-Isolation model with holling type II incidence function, Mathematics 7(4) (2019), pp. 350. Available at http://doi:10.3390/math7040350. doi: 10.3390/math7040350
- S. Said, Tanzania President questions coronavirus kits after animal test, Al Jazeera (3 May 2020). Available at https://www.aljazeera.com/news/2020/05/tanzania-president-questions-coronavirus-kits-animal-test-200503174100809.html
- R. Sameni, Mathematical Modeling of Epidemic Diseases; A Case Study of the COVID-19 Coronavirus, Grenoble, France, 2020
- C.G. Sanglier, M.M. Robas, and G.P. Jimenez, Estimation of the epidemiological evolution through a modelling analysis of the Covid-19 outbreak, Acta Sci. Microbiol. 3(4) (2020), pp. 152–158. doi: 10.31080/ASMI.2020.03.0559
- A.S. Shaikh, I.N. Shaikh, and K.S. Nisar, A Mathematical Model of COVID-19 Using Fractional Derivative, Outbreak in India with Dynamics of Transmission and Control, Distributed under a Creative Commons CC BY license, 2020. Available at doi:10.20944/preprints202004.0140.v1
- M.B. Trawicki, Deterministic Seirs Epidemic Model for Modeling Vital Dynamics, Vaccination and Temporary Immunity, MDPI Mathematics, 2017. Available at doi:10.3390/math5010007
- A.M. Tulu and P.R. Koya, The impact of infective immigrants on the spread of dog rabies, Am. J. Appl. Math. 5(3) (2017), pp. 68–77. Available at doi:10.11648/j.ajam.20170503.12. doi: 10.11648/j.ajam.20170503.12
- J. Wang, K. Tang, and W. Lv, High Temperature and High Humidity Reduce the Transmission of COVID-19, ResearchGate, 2020.
- World Health Organization (WHO), Coronavirus disease 2019 (COVID-19): Situation Report-78, 2020.
- World Health Organization (WHO), Coronavirus disease 2019 (COVID-19): Situation Report-101, 2020.
- World Health Organization (WHO), Coronavirus disease 2019 (COVID-19): Situation Report-133, 2020.