
 ?Mathematical formulae have been encoded as MathML and are displayed in this HTML version using MathJax in order to improve their display. Uncheck the box to turn MathJax off. This feature requires Javascript. Click on a formula to zoom.
Abstract
Outbreaks of highly pathogenic strains of avian influenza (HPAI) cause high mortality in avian populations worldwide. When spread from avian reservoirs to humans, HPAI infections cause mortality in about 50% of human infections. Cases of human-to-human transmission of HPAI are relatively rare, and have, to date, only been reported in situations of close contact. These transmissions have resulted in isolated clusters of human HPAI infections, but have not yet caused a pandemic. Given the large number of human H5N1 HPAI infections to date, none of which has resulted in a pandemic, we estimate an upper bound on the probability of H5N1 pandemic emergence. We use this estimate to provide the likelihood of observing such a pandemic over the next decade. We then develop a more accurate parameter-based estimate of the emergence probability and predict the likelihood that, through rare mutations, an H5N1 influenza pandemic will emerge over the same time span.
1. Introduction
Avian influenza virus (AIV) is an RNA virus that is endemic in wild bird populations. While low-pathogenicity avian influenza strains have become established in agricultural bird populations such as chickens and turkeys, high-pathogenicity avian influenza (HPAI) outbreaks are relatively rare, but lead to huge economic losses as infected flocks are aggressively culled to contain the infection [Citation11].
HPAI can also spread from avian reservoirs to humans, with the H5N1 subtype causing mortality in about 50% of human infections [Citation11]. Following this initial transmission from an avian to a primary human host, however, cases of secondary human-to-human transmission of H5N1 are relatively rare: if such transmission occurs, clusters of only two to three cases within a single household have been reported [Citation1, Citation18, Citation19]. Consequently, estimates of the human-to-human for currently prevalent strains of H5N1 influenza are low (0.1 – 0.4, [Citation1]), and there is little evidence of any gradual change in this transmissibility over time [Citation19].
Despite this low transmissibility among humans, sustained aerosol transmission of H5N1 influenza has been observed in an animal model, for viral strains that differ from circulating strains by only three to five base pair substitutions [Citation6, Citation7]. Given the high mutation rate of RNA viruses, an H5N1 virus could acquire these mutations, for example, during the course of a short infection chain from bird to primary human to secondary human [Citation12]. There is wide-spread and continuing concern regarding this threat of the evolutionary emergence of a human-to-human transmissible HPAI pandemic [Citation9, Citation11, Citation12].
Mathematical modelling approaches have proven to be critical tools in estimating risk factors and assessing control measures for zoonotic infections [for review see Citation2, Citation10]. Previous models of HPAI have incorporated the distributions of transmission cluster sizes, household sizes and contact information to estimate the transmissibility, basic reproductive ratio () and attack rate of HPAI in humans [Citation1, Citation14, Citation18, Citation19]. Mathematical and computational methods have also addressed the question of which factors – such as the length of infection, fitness of intermediate mutations, or the immune response – are most important in predicting the emergence of human transmissible HPAI [Citation12].
Considered on a global scale, a relatively large number of human HPAI (subtype H5N1) infections have been documented. At the time of writing, the most recent case resulted in the death of a 21-year old male in the Kavrepalanchok district of Nepal [Citation17]. Yet none of these infections, to date, has resulted in the emergence of pandemic HPAI. In this contribution, we use this observation to provide a statistical estimate: an upper bound on the probability of H5N1 influenza pandemic emergence. This ‘worst-case scenario’ then allows us to predict the likelihood of observing such a pandemic over the next decade. We then develop a stochastic mutational model to refine this prediction, based on currently available parameter estimates.
2. Pandemic emergence
The World Health Organization has recognized 861 human H5N1 influenza infections since 2003 [Citation16]. Although these infections have sometimes been the source of a ‘cluster’ of infections, typically within a household, none of these clusters has spread more widely into the human community. More precisely, infection chains have been traced from an infected bird, to a primary infected human, and (rarely) to a secondary infected human, but all infection chains to date have gone extinct at or before this secondary stage [Citation1, Citation14, Citation18, Citation19].
We let denote the (small) probability that a single infection in a human is ultimately the source of a pandemic of human H5N1 HPAI. In other words,
gives the probability that a particular infected individual becomes ‘patient zero’ in an H5N1 pandemic. We will model the initial stages of this pandemic as a branching process, making the conservative assumption that the fate of each human infection is independent. This assumption is conservative in the sense that human H5N1 infections tend to occur within a household, and thus in reality each infection likely reduces the number of susceptible contacts for other infections. Thus we will overestimate (give an upper bound for) the emergence probability of the pandemic.
Starting from a single infected human, then, each infection chain goes extinct, with probability , or spreads, with probability
. Clearly if the infection spreads, the branching process approximation breaks down, but for this approach our only concern is whether the initial infection chain goes extinct.
Suppose N H5N1 influenza infections have occurred worldwide in humans. Each of these produces an infection chain that goes extinct with high probability, given by . The probability of observing N infections, all of which have gone extinct, is then given by the simple expression:
(1)
(1) Figure plots
as a function of
, for various values of N (labels on right). The bold line shows results for N = 861 (number of confirmed H5N1 infections in humans as of December 2019 [Citation16]). The figure demonstrates that if the pandemic emergence probability is high, it is increasingly unlikely that 861 human H5N1 infection chains would be observed to go extinct.
Figure 1. The probability of observing N infection chains that go extinct, Q, as function of the emergence probability for a single infection, . Each line plots
for a different value of N (labels on right). The horizontal line shows the rejection threshold (
= 0.05), while the bold line shows Q for
, the current worldwide number of observations. The upper bound on
which is consistent with observed data is shown by the filled circle (
).
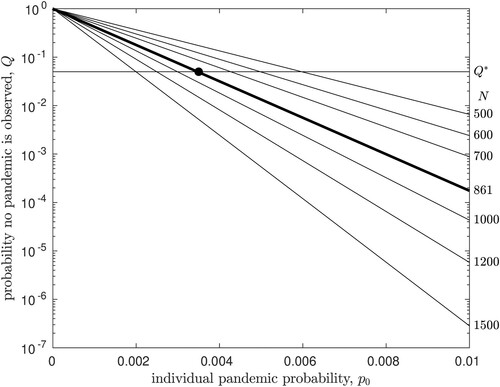
We take a 5% rejection threshold, that is, we assume that parameters are statistically inconsistent with observed data if the probability of the observation is less than 5%; the horizontal line on Figure plots this threshold, denoted . For N = 861, we see that the model is consistent with observation if
. This value (filled circle in Figure ) thus gives the upper bound on the probability that a single human H5N1 infection is the source of an infection chain that does not go extinct, i.e. is the source of a pandemic in humans. We will denote this upper bound
.
As N increases, that is, as more infection chains are observed in the absence of a pandemic, this statistical estimate of the upper bound on will be reduced. Clearly, if we have observed N infection chains and none has caused a pandemic, for a rejection threshold
, the upper bound on
that is consistent with the data is given by
The top panel of Figure illustrates how this estimate of
will change, as further H5N1 infection chains are observed in future, assuming that a pandemic does not occur. We note that at the 5% rejection threshold, given the relatively large number of infections that have already been observed,
is surprisingly insensitive to N.
Figure 2. The upper bound estimate of the emergence probability for a single infection, , as a function of the number of infection chains is observed. Each line plots
for a different value of the rejection threshold
(labels on right). The bold line shows
for the 5% rejection threshold discussed in the text. The upper bound on
which is consistent with currently observed data is shown by the filled circle (
, N = 861). In the top panel,
is plotted against the number of infections observed. In the lower panel, the value of
is plotted against time, assuming that infections continue to be observed at a rate of r = 53.8 per year.
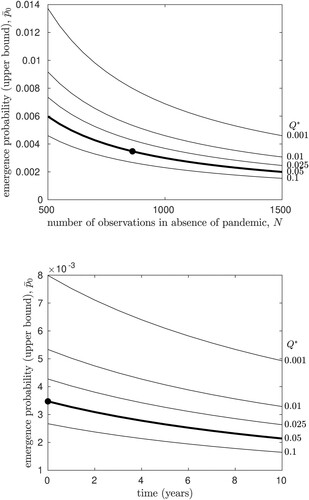
To investigate this further, we note that the 861 confirmed H5N1 infections in humans occurred worldwide over a 16-year interval, yielding the incidence rate r = 53.8 human infections per year. Under the simplest possible assumption of a time-homogeneous Poisson process, we then expect rn further human infections, on average, to occur in n years. If we have observed infections currently, we expect that over time, our estimate of
could be reduced, at best, to
in n years, again assuming that an H5N1 pandemic does not occur during that interval. The lower panel of Figure illustrates how the upper bound estimate for the emergence probability will change over the next n years, if we continue to observe human H5N1 infections at the current rate. We find that the statistical estimate of
is not expected to change substantially over the next several years, unless an unusually large number of infection chains are observed.
Thus the numerical value of is small and expected to decrease, but remains relatively stable, over time. Using this value, we would like to further predict the cumulative probability that an H5N1 pandemic emerges over the coming years. Again, under the assumption of a time-homogeneous Poisson process, we expect rn new human infections, on average, to occur in n years. Recalling that
is an upper bound, a lower bound on the probability that a pandemic is not observed in n years is then
. Finally then, an upper bound on the probability that one or more of these infections is the source of a pandemic is given by
(2)
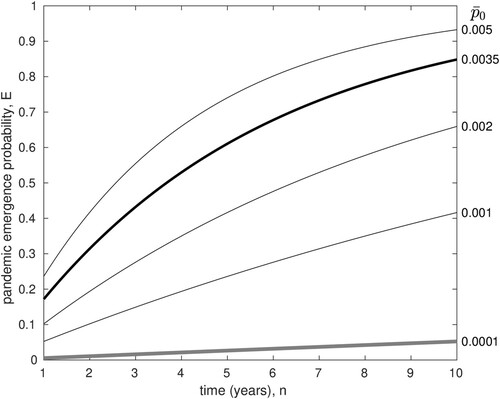
(2) Figure plots this pandemic emergence probability,
, as a function of n in years, for various values of
. The bold line shows results for the upper bound derived above,
. These results indicate that although the probability of emergence from each individual H5N1 infection is quite low, it is still possible that the cumulative chance of pandemic emergence over the next decade could be high. In other words, an 85% chance of pandemic emergence over the next decade is not inconsistent with the data.
Figure 3. The probability of pandemic emergence, E, versus time in years. Each line plots for a different value of
(labels on right). The bold black line shows E for
, the estimate of this upper bound using current incidence data. The grey line shows E for
, the highest estimate for
obtained in the evolutionary model (see Discussion).
3. Evolutionary emergence
In laboratory tests, engineered strains of HPAI virus have been created by adding specific mutations to circulating strains; these have been shown to elicit sustained transmission chains in mammals through aerosol transmission [Citation6, Citation7, Citation12]. The pandemic emergence of H5N1 influenza in humans thus presumably requires the following sequence of events: an initial infection chain, in humans, that lasts long enough for the required mutations to occur; transmission of the sufficiently mutated strain to a new human host; an infection chain starting from the newly infected host that does not go extinct [Citation9]. Following similar approaches for quantifying the risk of evolutionary emergence of a pathogen [Citation4, Citation5, Citation12], we now consider the probability of an H5N1 pandemic given this underlying mutational mechanism.
We use probability generating functions (pgfs) to describe the multi-type branching process underlying evolutionary emergence. In particular, we will let be basic reproductive ratio of wildtype (non-mutated) virus in humans, with
. We assume that the virus circulating in the avian reservoir does not carry the mutations necessary for aerosol transmission in humans. This is a reasonable assumption given that we have not observed an HPAI pandemic to date. We further assume that m mutations are required to produce the aerosol-transmissible strain; the basic reproductive ratio of the fully mutated virus is denoted
, with
. Although it is reasonable to assume that these mutations are not already circulating in the avian reservoir, it is possible that these mutations may emerge by chance in a single strain in this large reservoir, and then be transmitted to humans. We have not modelled this scenario, which seems less likely due to (1) the presumed lack of selective advantage for these rare mutations in the avian population, (2) strong selection on the virus within the avian reservoir, due to high prevalence and large population sizes, which will severely limit the drift of neutral or deleterious mutations, and (3) limited transmission events of avian influenza to humans.
3.1. Case 1: a single mutation (m = 1)
In the simplest case, a single mutation is required for aerosol transmission; m = 1. In this case, we let μ be the probability that the required mutation occurs during a single wildtype infection, grows to sufficient numbers during the in-host infection, and is successfully passed on to a subsequent individual in the infection chain, through the transmission bottleneck. Thus μ is a compound parameter, reflecting not only the de novo occurrence of the mutation but also the in-host growth process for the mutant lineage, and transfer of the mutant to the next host, as estimated in [Citation13].
Since , we can approximate the Poisson-distributed number of new infections created by each wildtype infection as a Bernoulli process: either transmission occurs, with probability
, or does not occur with probability
. If transmission occurs, the wildtype virus is transmitted with probability
, or the mutated strain is transmitted with probability μ. If
denotes the probability that a single individual, infected by the wildtype virus, transmits a wildtype infections and b mutant infections, the pgf describing this transmission process is written as
, where x and y denote the dummy variables associated with the wildtype and mutant respectively. The pgf describing disease transmission from a single individual infected by the wildtype virus is therefore:
(3)
(3) The mutant viral strain has
and thus we model disease transmission as a Poisson process with mean
. The pgf for disease transmission from a single individual infected by the mutant virus is thus:
(4)
(4) Note that we neglect back mutation, that is, the probability that the mutant virus reverts to the wildtype is considered negligible.
To find the extinction probability of the pandemic, we solve for the fixed points [Citation3]:
(5)
(5) The value
then yields the probability that pandemic AIV emerges, starting from a single individual infected by the wildtype virus.
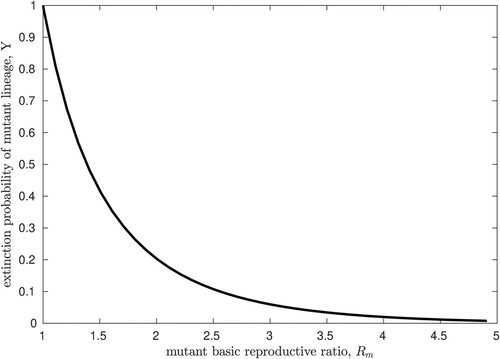
We note that the expression for Y in Equation (Equation5(5)
(5) ) is decoupled and simply yields the extinction probability of a Poisson branching process with mean
[Citation3]. For reference, we plot the numerical solution of this fixed point equation in Figure , against a range of values for
. We note that the numerical value of
is hypothetical since a strain of AIV that is capable of sustained aerosol transmission in humans has, fortunately, not yet been observed.
Figure 4. The probability of extinction, Y, for an AIV pandemic starting with a single individual infected by the fully mutated strain, with basic reproductive ratio . These results are simply the extinction probability for a Poisson branching process with mean
, reproduced here for reference.
Estimates of , for human-to-human transmission of H5N1 influenza are in the range 0.1−0.4 [Citation1]. Recall that μ is the probability that the required mutation both occurs and is transmitted to the subsequent host. Although the risk of pandemic H5N1 is known to be sensitive to this probability [Citation12], estimates of this composite parameter do not exist for AIV. Here, we take advantage of recent work that has provided a numerical estimate of this combined emergence and transmission probability for novel mutations in influenza A in humans; using a stochastic model coupled to a deterministic in-host model, this probability has been estimated to be about 1 in 2000 (
) [Citation13].
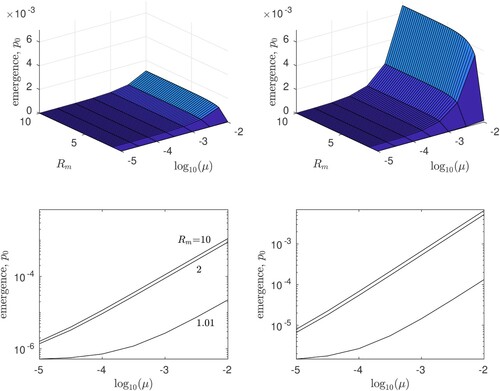
Taking these parameter estimates into account, Figure plots the numerically estimated probability of evolutionary emergence of AIV, 1−X, against a range of values for both and μ, assuming either
or
. We find that the risk of emergence is relatively insensitive to
, particularly if
substantially exceeds unity. However, both the mutation/transmission probability, μ, as well as the wildtype basic reproductive ratio,
, are important to numerical estimates of the risk of H5N1 emergence through mutation. We also note that in the previous section of the paper,
gives an upper bound for the probability that an H5N1 pandemic emerges starting from a single infected human. This upper bound is consistent with our estimates of the same quantity in the evolutionary scenario, 1−X, as long as the mutation probability μ is not substantially higher than the available estimate for influenza A virus (
, or -3.3 on the
axes if Figure ).
Figure 5. The probability of evolutionary emergence, , for an H5N1 pandemic starting with a single individual infected by the wildtype strain. Results are plotted for basic reproductive ratio
(left panels) and
(right panels); in the top panels we plot
against the basic reproductive ratio of the mutant
and the probability of mutation and transmission, μ. The lower panels show the same data in cross-section on log-log axes, for
= 1.01, 2, and 10. All results are for Case 1: m = 1, that is, a single mutation is required to achieve
.
3.2. Case 2: multiple mutations (m>1)
Engineered strains of AIV that were found capable of sustained aerosol transmission in mammals differ from circulating (wildtype) strains by three to five mutations [Citation6, Citation7, Citation12]. Understanding the more complex case in which several mutations are required to achieve is therefore essential.
Assume that m mutations are required, such that the fully mutated viral strain carries m specific mutations and has basic reproductive ratio . Classifying viral strains according to whether they carry each of the m required mutations, there are
viral strains in total, of which
are intermediate strains, carrying some but not all of the m mutations. The model predictions will depend on the transmissibility of these intermediate viral strains.
Following [Citation12], we demonstrate results for two simplified sub-cases. In the all-or-nothing model, we assume that intermediate strains have the same reproductive ratio as the wildtype, and only the fully mutated strain has . In the linear model, the transmissibility of intermediate strains will increase linearly from
to
, depending on the number of required mutations the strain carries.
In either case, we let denote the basic reproductive ratio of the mutant strain that carries
of the required mutations. For simplicity we maintain the assumption that
, such that a Bernoulli process approximates the wildtype transmission chain. However for intermediate strains, we allow for a Poisson distribution of new infections; each of these new infections may mutate such that it carries one additional mutation with probability
. Since we expect that
will be small, we neglect terms of order
, and thus a new infection can carry only one new mutation (only one mutational class can be added at each step in the transmission chain). Using the entries of
as dummy variables (such that
is associated with the wildtype strain), the pgfs describing this multi-type branching process are then:
(6)
(6) Again, to estimate the risk of evolutionary emergence, we find the fixed points of this set of equations numerically, such that
(7)
(7) The first entry of
, which we denote
, then gives the extinction probability of the pandemic, starting with a single individual infected by the wildtype strain; thus in this model we have
. We note that the more general case of the all-or-nothing scenario, for m required mutations, has been previously solved, assuming a Poisson offspring distribution at each stage of the transmission process [Citation8]. In that case, the emergence probability can be expressed in the form
, for some constant C [Citation8].
Finally, some care must be taken in assigning the values of , the mutation probability for a viral strain that contains i of m necessary mutations. In the simplest case, we set the mutation rate to be a constant,
,
. This case corresponds to a scenario in which a single mutational pathway connects the wildtype to the fully mutated strain, which may occur for example when other pathways involve lethal mutational combinations [Citation15]. In contrast, if multiple mutational pathways are available, then the wildtype virus can mutate in m possible ways, while a virus with one mutation can mutate in m−1 possible ways, etc. Thus for the case of multiple pathways, we let
.
Since Figure suggests that the risk of emergence is relatively insensitive to , in Figure we show results for
, for a single mutational pathway (
,
) allowing μ and
to vary. In the panels on the left, we assume the all-or-nothing mutational model:
for
. In the panels on the right, we assume the linear model:
. We show results for both m = 3 (top row) and m = 5 (bottom row).
Figure 6. The probability of evolutionary emergence, , for an H5N1 pandemic starting with a single individual infected by the wildtype strain. Results are plotted for basic reproductive ratio
= 0.1, 0.2 or 0.4 (labelled in first panel), against the probability of mutation and transmission, μ, assuming
. Results are shown for a single mutational pathway, for the all-or-nothing model (left panels) and for the linear model (right panels), with m = 3 (top row) or m = 5 (bottom row).
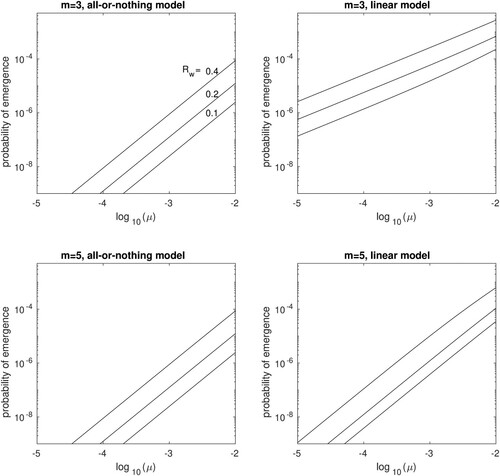
From Figure we see that in both models, the risk of emergence increases exponentially with mutation rate and is also very sensitive to the basic reproductive number of the wildtype strain. Emergence is less likely in the all-or-nothing model and also less likely when more mutational steps are required. Interestingly, the latter effect is much more pronounced in the linear model. A possible explanation is that in the all-or-nothing model, emergence requires a relatively long transmission chain to occur among the incompletely mutated strains, all of which have the same fitness as the wildtype. This long transmission chain could be the rate-limiting step in the emergence process, such that once it occurs the mutational space becomes more or less fully explored.
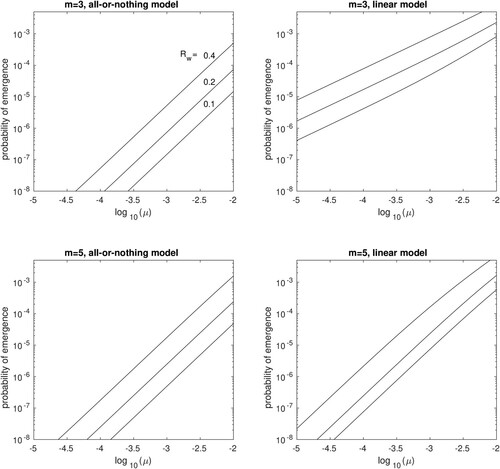
Results assuming multiple mutational pathways ( are qualitatively identical, showing a slight increase in the emergence probability as compared to the single mutational pathway (Figure ).
Figure 7. The probability of evolutionary emergence, , for an H5N1 pandemic starting with a single individual infected by the wildtype strain, assuming multiple mutational pathways. Results are plotted for basic reproductive ratio
= 0.1, 0.2 or 0.4 (labelled in first panel), against the probability of mutation and transmission, μ, assuming
. Results are shown for the all-or-nothing model (left panels) and for the linear model (right panels), with m = 3 (top row) or m = 5 (bottom row).
3.3. Monte Carlo validation
Since our approach is numerical, we validated solutions by performing individual-based Monte Carlo simulations. In brief, we begin a simulation trial with a single individual infected by the wildtype virus. We draw a uniformly distributed random number and compare to to determine whether this individual passes on the infection. If so, we draw a second uniformly distributed random number and compare with μ to determine whether the wildtype or a mutated strain of the infection is passed on.
In the event that a mutation occurs, a single individual infected by strain 1 of the virus is created in the simulation. A Poisson-distributed random number with expected value is then drawn to determine the number of new infections transmitted by this individual. For each of these new infections independently, a further mutation (to strain 2) may be transmitted with probability μ.
We keep track of all infections of every type until either the infection chain is extinct or has grown to a total infected population size of 100 individuals, which we define as emergence (results are insensitive to this choice of threshold, once sufficiently large). Note that only forward mutations are considered (from strain i to strain i + 1), as described in system Equation6(6)
(6) .
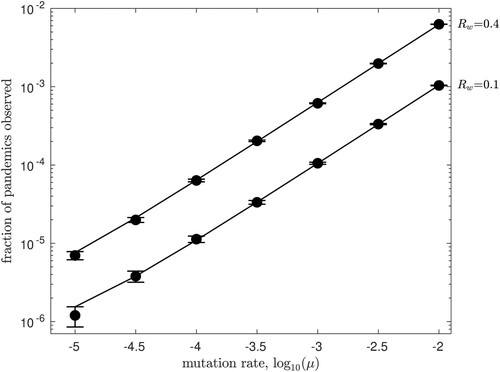
We repeat this process many times, starting with a single wildtype individual in each trial, and record the total number of extinctions that occur. In all cases, our Monte Carlo results converged to the analytical results shown in previous figures as the number of trials increased. As an example, in Figure we show a set of validation results for Figure , taking . Solid circles plot the fraction of Monte Carlo trials in which emergence occurred, versus the mutation rate μ, for
and
. Lines show the numerical predictions from Figure . Error bars plot each value of
± one standard error of the mean (
for
trials).
Figure 8. Monte Carlo simulation results verify the numerical results illustrated in Figure . Starting from a single infected human, the fraction of Monte Carlo trials in which pandemic emergence occurred is plotted versus the mutation rate μ, for and
. Solid lines show the numerical predictions from Figure with
, while circles show the Monte Carlo results after
trials. Error bars show ± one standard error of the mean.
4. Discussion
Recent outbreaks of avian influenza in agricultural bird populations have raised concern regarding the possibility of a pandemic of high-pathogenicity avian influenza (HPAI) in humans. We used two approaches to estimate the risk of an HPAI (subtype H5N1) pandemic. First, we develop a statistical approach to bound estimates of , the probability that a single human infected by H5N1 influenza becomes ‘patient zero’ in a pandemic; we demonstrate that
can be bounded, based on observed data to date, by
. As further data become available, this bound will decrease, but our results predict that rapid change is unlikely over the next several years. While this emergence probability appears low, we also illustrate that if
, at the current rate of spillover infections from birds to humans, the probability that an H5N1 pandemic occurs in the next 10 years would be nearly 85%.
In a second approach, we develop a stochastic model of the evolutionary emergence of an H5N1 pandemic. In this case, we assume that the basic reproductive ratio of H5N1 strains currently circulating in bird populations () is less than unity in humans, but that the accrual of several mutations could allow for efficient transmission among humans. Estimates of
using the stochastic model depend sensitively on the number of mutations required, on
, and on the chance that a specific mutation occurs during an infection time course and is passed on to a subsequent host (μ). While the latter composite parameter is difficult to estimate, a recent estimate for influenza A virus in humans suggests
[Citation13]. Engineered strains of HPAI have demonstrated that three to five mutations are required for efficient aerosol transmission among mammals [Citation6, Citation7, Citation12], and estimates for
are in the range 0.1–0.4 [Citation1]. Taken together, the highest estimate for
we obtained for this range of parameter estimates, across all the mutational models investigated here, was
(see Figures and , with
).
In Figure , the bold grey line plots the risk of H5N1 emergence assuming . In contrast with the ‘upper bound’ statistical approach, this parameter-based estimate implies that the risk of a pandemic is much lower, possibly only 5% in the next decade. In addition, we note that the World Health Organization reported 145 H5N1 cases in humans in 2015, followed by only 10 in 2016 and 4 in 2017. There were no reported cases in 2018 and a single case in 2018. Although these data reflect the stochastic nature of the incidence of H5N1 influenza epidemics in avian populations, an interesting possibility is that the incidence of human H5N1 infections may be declining over time. Modelling this possibility would require extending our approach to include a time-inhomogeneous branching process and would presumably lower the estimated risk of an H5N1 influenza pandemic.
Even under the assumption of a constant rate of incidence, the upper bound we estimate for will continue to decrease over time Figure , although ironically this reduction will only stop when an H5N1 pandemic occurs. As better parameter estimates become available, however, our predictions regarding pandemic emergence could be substantially improved. Figures and demonstrate that pandemic emergence probabilities, under several mutational models, depend exponentially on the probability that a novel mutation both occurs during a single human infection, and is passed on to a subsequent human host. Thus our work underscores the need for accurate estimates, through both modelling and experimental work, of the transmission probability of de novo mutations. This suggests a number of challenging avenues for future work.
Acknowledgements
This work was made possible through the support of the Centre Internationale des Mathématiques Pures et Appliquées, through the CIMPA Summer Research School in Mathematical Biology (Nepal, 2019). LMW was supported in part by the Natural Sciences and Engineering Research Council of Canada.
Disclosure statement
No potential conflict of interest was reported by the author(s).
Additional information
Funding
References
- T.Y. Aditama, G. Samaan, R. Kusriastuti, O.D. Sampurno, W. Purba, Misriyah, H. Santoso, A.Bratasena, A. Maruf, E. Sariwati, V. Setiawaty, K. Glass, K. Lokuge, P.M. Kelly, and I.N. Kandun, Avian influenza H5N1 transmission in households, Indonesia, PLoS ONE 7 (2012), pp. e29971.
- L.J.S. Allen, V.L. Brown, C.B. Jonsson, S.L. Klein, S.M. Laverty, K. Magwedere, J.C. Owen, and P.van den Driessche, Mathematical modeling of viral zoonoses in wildlife, Natural Resource Modeling 25 (2012), pp. 5–51.
- L.J.S. Allen, An Introduction to Stochastic Processes with Applications to Biology, 2nd ed., CRC Press, Hoboken, NJ, 2010.
- R. Antia, R.R. Regoes, J.C. Koella, and C.T. Bergstrom, The role of evolution in the emergence of infectious diseases, Nature 426 (2003), pp. 658–661.
- H. Chabas, S. Lion, A. Nicot, S. Meaden, S. van Houte, S. Moineau, L.M. Wahl, E.R. Westra, and S. Gandon, Evolutionary emergence of infectious diseases in heterogeneous host populations, PLoS Biology 16 (2018), pp. e2006738.
- S. Herfst, E.J.A. Schrauwen, M. Linster, S. Chutinimitkul, E. de Wit, V.J. Munster, E.M. Sorrell, T.M.Bestebroer, D.F. Burke, D.J. Smith, G.F. Rimmelzwaan, A.D.M.E. Osterhaus, and R.A.M. Fouchier, Airborne transmission of influenza A/H5N1 virus between ferrets, Science 336 (2012), pp. 1534–1541.
- M. Imai, T. Watanabe, M. Hatta, S.C. Das, M. Ozawa, K. Shinya, G. Zhong, A. Hanson, H. Katsura, S. Watanabe, C. Li, E. Kawakami, S. Yamada, M. Kiso, Y. Suzuki, E.A. Maher, G. Neumann, and Y.Kawaoka, Experimental adaptation of an influenza H5 HA confers respiratory droplet transmission to a reassortant H5 HA/H1N1 virus in ferrets, Nature 486 (2012), pp. 420–428.
- Y. Iwasa, F. Michor, and M.A. Nowak, Evolutionary dynamics of escape from biomedical intervention, Proc. R. Soc. London B Biolog. Sci. 270 (2003), pp. 2573–2578.
- M. Lipsitch, W. Barclay, R. Raman, C.J. Russell, J.A. Belser, S. Cobey, P.M. Kasson, J.O.Lloyd-Smith, S. Maurer-Stroh, S. Riley, C.A. Beauchemin, T. Bedford, T.C. Friedrich, A. Handel, S.Herfst, P.R. Murcia, B. Roche, C.O. Wilke, and C.A. Russell, Viral factors in influenza pandemic risk assessment, eLife 5(2016), pp. e18491.
- J.O. Lloyd-Smith, D. George, K.M. Pepin, V.E. Pitzer, J.R.C. Pulliam, A.P. Dobson, P.J. Hudson, and B.T. Grenfell, Epidemic dynamics at the human-animal interface, Science 326 (2009), pp. 1362–1367.
- J.S.M. Peiris, M.D. de Jong, and Y. Guan, Avian influenza virus (H5N1): a threat to human health, Clinical Microbiology Reviews 20 (2007), pp. 243–267.
- C.A. Russell, J.M. Fonville, A.E.X. Brown, D.F. Burke, D.L. Smith, S.L. James, S. Herfst, S. van Boheemen, M. Linster, E.J. Schrauwen, L. Katzelnick, A. Mosterín, T. Kuiken, E. Maher, G.Neumann, A.D.M.E. Osterhaus, Y. Kawaoka, R.A.M. Fouchier, and D.J. Smith, The potential for respiratory droplet-transmissible A/H5N1 influenza virus to evolve in a mammalian host, Science 336 (2012), pp. 1541–1547.
- D. Sigal, J.N.S. Reid, and L.M. Wahl, Effects of transmission bottlenecks on the diversity of influenza A virus, Genetics 210 (2018), pp. 1075–1088.
- M. van Boven, M. Koopmans, M.D.R. van Beest Holle, A. Meijer, D. Klinkenberg, C.A. Donnelly, and H.J.A.P. Heesterbeek, Detecting emerging transmissibility of avian influenza virus in human households, PLoS Computational Biology 3(2007), pp.e145
- D.M. Weinreich, N.F. Delaney, M.A. DePristo, and D.L. Hartl, Darwinian evolution can follow only very few mutational paths to fitter proteins, Science 312 (2006), pp. 111–114.
- World Health Organization, Cumulative number of confirmed human cases for avian influenza A(H5N1) reported to WHO, 2003-2019, Accessed: December 12, 2019. Available at https://www.who.int/influenza/human_animal_interface/2019_11_25_tableH5N1.pdf.
- World Health Organization, Information on avian influenza A (H5N1) identified in human in Nepal, Accessed: June 15, 2019. Available at http://www.searo.who.int/nepal/documents/emergencies/Avian_Influenza_A_In_Human/en/.
- Y. Yang, M.E. Halloran, J.D. Sugimoto, and I.M. Longini, Detecting human-to-human transmission of avian influenza A (H5N1), Emerging Infectious Diseases 13 (2007), pp. 1348–1353.
- L. Zhou, E. Chen, C. Bao, N. Xiang, J. Wu, S. Wu, J. Shi, X. Wang, Y. Zheng, Y. Zhang, R. Ren, C.M. Greene, F. Havers, A.D. Iuliano, Y. Song, C. Li, T. Chen, Y. Wang, D. Li, D. Ni, Y. Zhang, Z.Feng, T.M. Uyeki, and Q. Li, Clusters of human infection and human-to-human transmission of avian influenza A(H7N9) virus, 2013–2017, Emerging Infectious Diseases 24 (2018), pp. 397–400.